Journal of Chemical and Pharmaceutical Research
__________________________________________________
ISSN No: 0975-7384 CODEN(USA): JCPRC5
J. Chem. Pharm. Res., 2011, 3(6):423-432
Topological and Quantum chemical descriptors based Comparative
Quantitative Structure-Activity Relationship of benzothiazole derivatives
Bhuwan B. Mishra*, Abhishek Giri, Rajesh K. Singh and Pashupati P. Singh
Department of Chemistry, Maharani Lal Kunwari Post Graduate College, Balrampur(U.P.), India
______________________________________________________________________________
ABSTRACT
Comparative quantitative structure activity relationship study of twenty five benzothiazole derivatives has been presented. The study is mainly based on two sets of descriptors: topological descriptors and quantum chemical descriptors. For QSAR study, the structures of all the above compounds have been drawn and their geometries have been optimized with the help of CAChe software using PM3 Hamiltonian. The comparative study has shown that the best QSAR is constructed from quantum chemical properties: heat of formation, molecular weight, total energy and LUMO energy. Results emanated from this study show that these descriptors can be used as descriptors of biological activity.
Keywords: Benzothiazole derivatives, topological descriptors, quantum chemical descriptors,
QSAR, PM3, CAChe software.
______________________________________________________________________________
INTRODUCTION
In this work a comparative quantitative structure activity relationship (QSAR)1 study of twenty five benzothiazoles is presented. The parent skeleton of benzothiazole is shown in Figure-1.
Cl O N
NH
1
6 8 9 10
11 12
16 17
The QSAR study is mainly based on two sets of descriptors. One is based on topological descriptors 2 and the other is based on quantum chemical descriptors.3
A. Topological descriptors: Following are the topological descriptors used in the study
1. Connectivity Index (order 0, standard)4
2. Valence Connectivity Index (order 0, standard)4 3. Shape Index (basic kappa, order 1)5
4. Shape Index (basic kappa, order 3)5 5. Dipole Moment
6. log P6
7. Solvent Accessible Surface Area7
B. Quantum Chemical Descriptors: Following are the quantum chemical descriptors used in
the study
1. Heat of formation (∆Hf)8 2. Molecular Weight (MW)9 3. Total energy (TE)10 4. Electronegativity (χ)11 5. Absolute Hardness (η)12 6. HOMO energy (∈∈∈∈HOMO)13 7. LUMO energy (∈∈∈∈LUMO)13
These two sets of descriptors have been used in deriving regression models.14 The regression models as obtained by topological parameters have been compared with those obtained from quantum chemical parameters.
EXPERIMENTAL SECTION
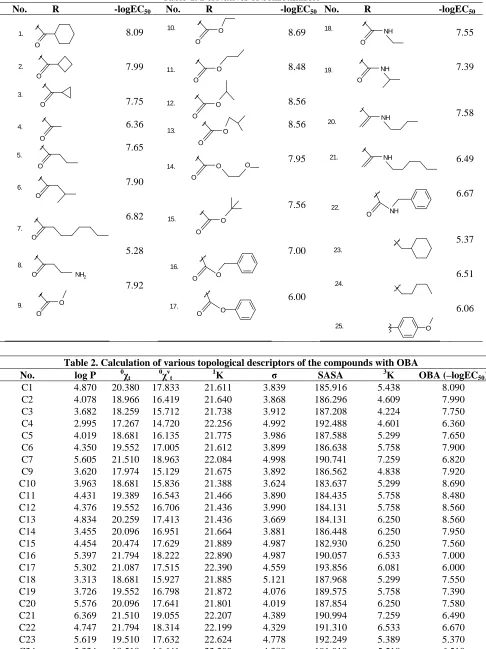
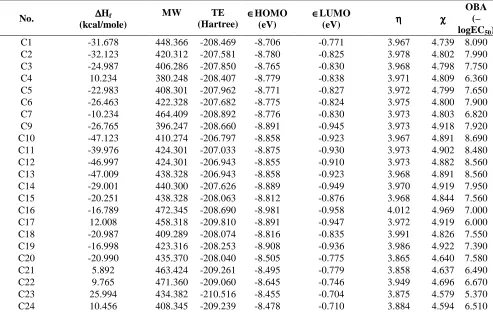
The study materials of this paper are twenty five benzothiazole derivatives15 and are presented in Table-1. For QSAR prediction, the structures of all the above compounds have been drawn and their geometries16 have been optimized with the help of CAChe software17 using PM3 Hamiltonian.18 The values of above topological and quantum chemical descriptors have been obtained from same software and the results are included in Table 2 and 3, respectively.
RESULTS AND DISCUSSION
Table-1. Derivatives of benzothiazole
No. R -logEC50 No. R -logEC50 No. R -logEC50
O O O O O O O
O NH2
O O 1. 2. 4. 5. 6. 3. 7. 9. 8. 8.09 7.99 7.75 6.36 7.65 7.90 6.82 5.28 7.92 O O O O O O O O O O O O O O O O O 10. 11. 12. 13. 14. 15. 16. 17. 8.69 8.48 8.56 8.56 7.95 7.56 7.00 6.00 O NH O NH NH NH O NH O 18. 19. 20. 21. 22. 25. 24. 23. 7.55 7.39 7.58 6.49 6.67 5.37 6.51 6.06
Table 2. Calculation of various topological descriptors of the compounds with OBA
No. log P 0χt 0χvt 1Κ σ SASA 3Κ OBA (–logEC50)
3)
Table 3. Calculation of various quantum chemical descriptors of the compounds with OBA
No. ∆∆∆∆Hf
(kcal/mole)
MW TE
(Hartree)
∈ ∈ ∈
∈HOMO (eV)
∈ ∈ ∈ ∈LUMO
(eV) ηηηη χχχχ
OBA (– logEC50)
C1 -31.678 448.366 -208.469 -8.706 -0.771 3.967 4.739 8.090 C2 -32.123 420.312 -207.581 -8.780 -0.825 3.978 4.802 7.990 C3 -24.987 406.286 -207.850 -8.765 -0.830 3.968 4.798 7.750 C4 10.234 380.248 -208.407 -8.779 -0.838 3.971 4.809 6.360 C5 -22.983 408.301 -207.962 -8.771 -0.827 3.972 4.799 7.650 C6 -26.463 422.328 -207.682 -8.775 -0.824 3.975 4.800 7.900 C7 -10.234 464.409 -208.892 -8.776 -0.830 3.973 4.803 6.820 C9 -26.765 396.247 -208.660 -8.891 -0.945 3.973 4.918 7.920 C10 -47.123 410.274 -206.797 -8.858 -0.923 3.967 4.891 8.690 C11 -39.976 424.301 -207.033 -8.875 -0.930 3.973 4.902 8.480 C12 -46.997 424.301 -206.943 -8.855 -0.910 3.973 4.882 8.560 C13 -47.009 438.328 -206.943 -8.858 -0.923 3.968 4.891 8.560 C14 -29.001 440.300 -207.626 -8.889 -0.949 3.970 4.919 7.950 C15 -20.251 438.328 -208.063 -8.812 -0.876 3.968 4.844 7.560 C16 -16.789 472.345 -208.690 -8.981 -0.958 4.012 4.969 7.000 C17 12.008 458.318 -209.810 -8.891 -0.947 3.972 4.919 6.000 C18 -20.987 409.289 -208.074 -8.816 -0.835 3.991 4.826 7.550 C19 -16.998 423.316 -208.253 -8.908 -0.936 3.986 4.922 7.390 C20 -20.990 435.370 -208.040 -8.505 -0.775 3.865 4.640 7.580 C21 5.892 463.424 -209.261 -8.495 -0.779 3.858 4.637 6.490 C22 9.765 471.360 -209.060 -8.645 -0.746 3.949 4.696 6.670 C23 25.994 434.382 -210.516 -8.455 -0.704 3.875 4.579 5.370 C24 10.456 408.345 -209.239 -8.478 -0.710 3.884 4.594 6.510
∆Hf° is heat of formation, MW is molecular weight, TE is total energy, ∈HOMO is energy of highest occupied molecular orbital, ∈LUMO is energy of lowest unoccupied molecular orbital, η is absolute hardness and χ is electronegativity
3A. QSAR Modeling with Topological Descriptors: Firstly we have been done QSAR study
with the help of topological descriptors2 and various QSAR models in different combinations of descriptors have also been developed but only five top models are reported and are presented as below
I. First QSAR model: The first QSAR model is obtained when multi linear regression analysis
is done by taking connectivity index (order 0, standard) as first descriptor, valence connectivity index (order 0, standard) as second descriptor, Shape index (Kappa alpha, order 1) as third descriptor and solvent accessible surface area as fourth descriptor. The regression equation is given below:
PAT1=0.327217×0χt -0.367639×0χvt -0.98488×1Κ -0.146137×SASA+56.275
rCV^2=0.757041
r^2=0.921985 Eq.1
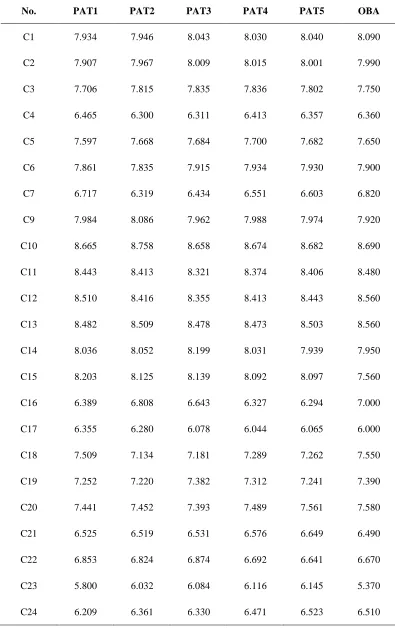
The values of the predicted activity PAT1 of all the compounds are listed in the Table-4.
II. Second QSAR model: The second QSAR model is obtained when multi linear regression
PAT2=0.276387×0χt -0.356254×0χvt -0.466599× σ -0.206309×SASA+48.8135
rCV^2=0.762696
r^2=0.913327 Eq.2
The values of the predicted activity PAT2 of all the compounds are listed in the Table-4.
III. Third QSAR model: The third QSAR model is obtained when multilinear regression
analysis is done by taking log P as first descriptor, connectivity index (order 0, standard) as second descriptor, dipole moment as third descriptor and solvent accessible surface area as fourth descriptor. The regression equation is given below:
PAT3=-0.216619×log P+0.0820541×0χt -0.512349× σ -0.196507×SASA+45.9261
rCV^2=0.74055
r^2=0.911394 Eq.3
IV. Fourth QSAR model: The fourth QSAR model is obtained when multi linear regression
analysis is done by taking log P as first descriptor, Shape index (Kappa alpha, order 1) as second descriptor, dipole moment as third descriptor and solvent accessible surface area as fourth descriptor. The regression equation is given below:
PAT4=-0.0913334×log P-0.452415×1Κ -0.317529× σ -0.172×SASA+51.4488 rCV^2=0.598521
r^2=0.91129 Eq.4
The values of the predicted activity PAT4 of all the compounds are listed in the Table-4.
The values of the predicted activity PAT3 of all the compounds are listed in the Table-5.
V. Fifth QSAR model: The fifth QSAR model is obtained when multi linear regression analysis
is done by taking valence connectivity index (order 0, standard) as first descriptor, Shape index (Kappa alpha, order 1) as second descriptor, dipole moment as third descriptor and solvent accessible surface area as fourth descriptor. The regression equation is given below:
PAT5=-0.0346735×0χvt -0.56486×1Κ -0.264708× σ -0.170769×SASA+53.6309
rCV^2=0.57125
r^2=0.906937 Eq.5
Table 4. Predicted activities of compounds as obtained topological descriptors
No. PAT1 PAT2 PAT3 PAT4 PAT5 OBA
C1 7.934 7.946 8.043 8.030 8.040 8.090
C2 7.907 7.967 8.009 8.015 8.001 7.990
C3 7.706 7.815 7.835 7.836 7.802 7.750
C4 6.465 6.300 6.311 6.413 6.357 6.360
C5 7.597 7.668 7.684 7.700 7.682 7.650
C6 7.861 7.835 7.915 7.934 7.930 7.900
C7 6.717 6.319 6.434 6.551 6.603 6.820
C9 7.984 8.086 7.962 7.988 7.974 7.920
C10 8.665 8.758 8.658 8.674 8.682 8.690
C11 8.443 8.413 8.321 8.374 8.406 8.480
C12 8.510 8.416 8.355 8.413 8.443 8.560
C13 8.482 8.509 8.478 8.473 8.503 8.560
C14 8.036 8.052 8.199 8.031 7.939 7.950
C15 8.203 8.125 8.139 8.092 8.097 7.560
C16 6.389 6.808 6.643 6.327 6.294 7.000
C17 6.355 6.280 6.078 6.044 6.065 6.000
C18 7.509 7.134 7.181 7.289 7.262 7.550
C19 7.252 7.220 7.382 7.312 7.241 7.390
C20 7.441 7.452 7.393 7.489 7.561 7.580
C21 6.525 6.519 6.531 6.576 6.649 6.490
C22 6.853 6.824 6.874 6.692 6.641 6.670
C23 5.800 6.032 6.084 6.116 6.145 5.370
In order to explore the reliability of the proposed model we have used regression coefficient (r^2) and cross-validation coefficient (rCV^2). The regression summary of these models is as shown below
QSAR rCV^2 r^2 Variable Used Variable Count
PAT1 0.757041 0.921985 0χt, 0
χvt, 1
Κ, SASA 4 PAT2 0.762696 0.913327 0χt,
0
χvt, σ, SASA 4
PAT3 0.740550 0.911394 log P, 0χt, σ, SASA 4
PAT4 0.598521 0.911290 log P, 1Κ, σ, SASA 4 PAT5 0.57125 0.906937 0χvt ,
1
Κ, σ, SASA 4
From the above study it is clear that the QSAR model PAT1 has highest predictive powers as it has highest values of r^2 (0.921985) among the five QSAR models
3A. QSAR Modeling with Quantum Chemical Descriptors: After that we have done QSAR
study with the help of quantum chemical descriptors3 and various QSAR models in different combinations of descriptors have also been developed but only five top models are also reported and are presented below
I. First QSAR model: The first QSAR model is obtained when multi linear regression analysis
is done by taking heat of formation as first descriptor, molecular weight as second descriptor, total energy as third descriptor and LUMO energy as fourth descriptor. The regression equation is given below:
PAQ1=-0.0368321×∆Hfº -0.00116938×MW +0.150046×TE+0.842993 ×∈∈∈∈LUMO + 39.2451
rCV^2=0.939872
r^2=0.97528 Eq.6
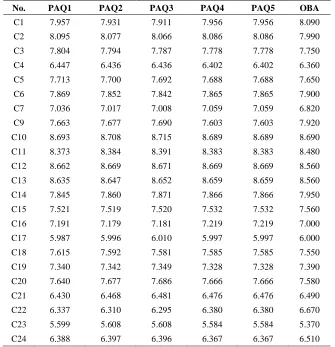
The values of the predicted activity PAQ1 of all the compounds are listed in the Table-5.
II. Second QSAR model: The second QSAR model is obtained when multilinear regression
analysis is done by taking heat of formation as first descriptor, molecular weight as second descriptor, total energy as third descriptor and electronegativity as fourth descriptor. The regression equation is given below:
PAQ2=-0.0368968×∆Hfº -0.00124271×MW+0.150427×TE-0.603669 × χ +41.5391
rCV^2=0.932379
r^2=0.975231 Eq.7
The values of the predicted activity PAQ2 of all the compounds are listed in the Table-5.
III. Third QSAR model: The third QSAR model is obtained when multi linear regression
The values of the predicted activity PAQ3 of all the compounds are listed in the Table-5.
IV. Fourth QSAR model: The fourth QSAR model is obtained when multi linear regression
analysis is done by taking heat of formation as first descriptor, HOMO energy as second descriptor and electronegativity as third descriptor. The regression equation is given below:
PAQ4=-0.0360544 × ∆Hfº +0.179285 × TE-0.601553 × ∈∈∈∈HOMO -1.41398 × χ +45.6528
rCV^2=0.943749
[image:8.595.139.474.239.586.2]r^2=0.974474 Eq.9
Table 5. Predicted activities of compounds as obtained quantum chemical descriptors
No. PAQ1 PAQ2 PAQ3 PAQ4 PAQ5 OBA
C1 7.957 7.931 7.911 7.956 7.956 8.090
C2 8.095 8.077 8.066 8.086 8.086 7.990
C3 7.804 7.794 7.787 7.778 7.778 7.750
C4 6.447 6.436 6.436 6.402 6.402 6.360
C5 7.713 7.700 7.692 7.688 7.688 7.650
C6 7.869 7.852 7.842 7.865 7.865 7.900
C7 7.036 7.017 7.008 7.059 7.059 6.820
C9 7.663 7.677 7.690 7.603 7.603 7.920
C10 8.693 8.708 8.715 8.689 8.689 8.690
C11 8.373 8.384 8.391 8.383 8.383 8.480
C12 8.662 8.669 8.671 8.669 8.669 8.560
C13 8.635 8.647 8.652 8.659 8.659 8.560
C14 7.845 7.860 7.871 7.866 7.866 7.950
C15 7.521 7.519 7.520 7.532 7.532 7.560
C16 7.191 7.179 7.181 7.219 7.219 7.000
C17 5.987 5.996 6.010 5.997 5.997 6.000
C18 7.615 7.592 7.581 7.585 7.585 7.550
C19 7.340 7.342 7.349 7.328 7.328 7.390
C20 7.640 7.677 7.686 7.666 7.666 7.580
C21 6.430 6.468 6.481 6.476 6.476 6.490
C22 6.337 6.310 6.295 6.380 6.380 6.670
C23 5.599 5.608 5.608 5.584 5.584 5.370
C24 6.388 6.397 6.396 6.367 6.367 6.510
The values of the predicted activity PAQ4 of all the compounds are listed in the Table-5.
V. Fifth QSAR model: The fifth QSAR model is obtained when multi linear regression analysis
is done by taking heat of formation as first descriptor, total energy as second descriptor, HOMO energy as third descriptor and LUMO energy as fourth descriptor. The regression equation is given below:
PAQ5=-0.0360544×∆Hfº +0.179285 ×TE +0.105435 ×∈∈∈∈HOMO +0.706988×∈∈∈∈LUMO +45.6528
rCV^2=0.943749
r^2=0.974474 Eq.10
In order to explore the reliability of the proposed model we have used regression coefficient (r^2) and cross-validation coefficient (rCV^2). The regression summary of these models is as shown below
QSAR rCV^2 r^2 Variable Used Variable Count
PAQ1 0.939872 0.975280 ∆Hf º
, MW, TE, ∈∈∈∈LUMO 4 PAQ2 0.932379 0.975231 ∆Hf
º
, MW, TE, χ 4
PAQ3 0.926904 0.974865 ∆Hfº, MW, TE, ∈∈∈∈HOMO 4 PAQ4 0.943749 0.974474 ∆Hfº, TE, ∈∈∈∈HOMO, χ 4 PAQ5 0.943749 0.974474 ∆Hf
º
, TE, ∈∈∈∈LUMO, ∈∈∈∈LUMO 4
From the above study it is clear that the QSAR model no. 1 i.e., PAQ1 has highest predictive powers as it has highest values of r^2 (0.975280) among the five QSAR models.
The top five models of each set of descriptors are given below.
Topological Descriptors Quantum Chemical Descriptors
QSAR r^2 rCV^2 QSAR r^2 rCV^2
PAT1 0.757041 0.921985 PAQ1 0.939872 0.975280 PAT2 0.762696 0.913327 PAQ2 0.932379 0.975231 PAT3 0.740550 0.911394 PAQ3 0.926904 0.974865 PAT4 0.598521 0.911290 PAQ4 0.943749 0.974474 PAT5 0.57125 0.906937 PAQ5 0.943749 0.974474
The above data show that the best model is provided by the quantum chemical descriptors than topological descriptors. The best model has been selected on the basis of values of correlation coefficient and cross-validation correlation coefficient.
CONCLUSION
The study has shown that the best QSAR (PAQ1) is constructed from quantum chemical properties: heat of formation, molecular weight, total energy and LUMO energy. Results emanated from this study show that these descriptors can be used as descriptors of biological activity.
REFERENCES
[1] C. Hansch; A. Leo, Exploring QSAR. Washington, DC: American Chemical Society, 1995. [2] P. G. Mezey, Shape in Chemistry : An Introduction to Molecular Shape and Topology. VCH Publ.: New York, 1993.
[3] M. Karelson; V. S. Lobanov; A. R. Katritzky, Chem. Rev. 1996, 96, 1027.
[4] L. B. Kier; L. H. Hall, Molecular Connectivity in Chemistry and Drug Research, Academic Press, New York, 1976.
[5] L. H. Hall; L. B. Kier, The Molecular Connectivity Chi Indices and Kappa Shape Indices in
[9] F. A. Pasha; H. K. Srivastava; P. P. Singh, Bioorg. & Med. Chem. 2005, 13, 6823. [10] V. K. Sahu; A. K. Soni; P.P. Singh, Asian J. Chem. 2010, 22, 3025.
[11] R. G. Pearson, Proc. Natl. Acad. Sci. USA., 1986, 83, 8440. [12] R. G. Parr, R. G. Pearson, J. Am. Chem. Soc., 1983, 105, 7512.
[13] (a) G. J. Klopman, Am. Chem. Soc. 1968, 90, 223. (b) V. K. Sahu; R. K. Singh, Clean-soil,
air, water, 2009, 37, 850.
[14] D. C. Montgomery; E. A. Peck, Introduction to Linear regression analysis 2nd edition. John
Wiley. New York. 1992.
[15] M. Yoshida; I. Hayakawa; N. Hayashi; T. Agatsuma; Y. Oda; F. Tanzawa; S. Iwasaki, Koyama; H. Furukawa; S. Kurakatad; Y. Sugano, Bioorg. Med. Chem. Lett. 2005, 15, 3328. [16] (a) W. J. Thiel, Mol. Struct. 1988, 163, 415. (b) Komornicki A.; McIver, J. W. Chem. Phys.
Lett. 1971, 10, 303.
[17] www.CACheSoftware.com