Business Intelligence Improved by Data Mining
Algorithms and Big Data Systems: An Overview of
Different Tools Applied in Industrial Research
Alessandro Massaro1,*, Valeria Vitti1, Angelo Galiano1, Alessandro Morelli2
1Dyrecta Lab s.r.l., IT Research Laboratory, via Vescovo Simplicio, 45, 70014 Conversano (BA), Italy 2IT Power Consulting s.r.l., via Fuggetta, 47, 00149, Roma, Italy
Copyright©2019 by authors, all rights reserved. Authors agree that this article remains permanently open access under the terms of the Creative Commons Attribution License 4.0 International License
Abstract
The proposed paper shows different tools adopted in an industry project oriented on business intelligence (BI) improvement. The research outputs concern mainly data mining algorithms able to predict sales, logistic algorithms useful for the management of the products dislocation in the whole marketing network constituted by different stores, and web mining algorithms suitable for social trend analyses. For the predictive data mining and web mining algorithms have been applied Weka, Rapid Miner and KNIME tools, besides for the logistic ones have been adopted mainly Dijkstra’s and Floyd-Warshall’s algorithms. The proposed algorithms are suitable for an upgrade of the information infrastructure of an industry oriented on strategic marketing. All the facilities are enabled to transfer data into a Cassandra big data system behaving as a collector of massive data useful for BI. The goals of the BI outputs are the real time planning of the warehouse assortment and the formulation of strategic marketing actions. Finally is presented an innovative model oriented on E-commerce sales neural network forecasting based on multi-attribute processing. This model can process data of the other data mining outputs supporting logistic actions. This model proves how it is possible to embed many data mining algorithms into a unique prototypal information system connected to a big data, and how it can work on real business intelligence. The goal of the proposed paper is to show how different data mining tools can be adopted into a unique industry information system.Keywords
Artificial Intelligence, Data Mining, Business Intelligence, Embedded Information Platform, E-Commerce Sales Predictions, KNIME, Rapid Miner, Big Data Systems1. Introduction: Main Project
Architecture
The Business Intelligence (BI) is a tool to support decisions and control of company performance widely discussed in the scientific literature [1-4]. BI systems however, are suitable for Decision Support Systems (DSS), in Business Performance Measurement Systems (BPMS), and are able to integrate large database architectures [5]. The term "embedded system" derives mainly from the BI integrated into a specific communication system. This system integration can be improved by collecting different structured and unstructured data into a big data systems [6]. Furthermore, the alignment of Enterprise Resource Planning ERP platform with big data is a research issue [7] which requires an accurate database design.
Big data are used also for the application of data mining and artificial intelligence algorithms [8]-[9]. In this direction Apache Cassandra is a god scalable big data system [9], suitable for cloud computing and for predictive analytics.
1.1. Platform Data Flow Design
According to the preliminary state of the art has been formulated the main project architecture illustrated in Figure 1, where the physical stores, adopting their customer relationship management (CRM) and project management (PM), can be interconnected with a big data system collecting all BI data: big data can import data from different tools and database systems, by analyzing them in order to examine the "initial organizational status" of the company (indicated in the inset of Fig. 1 by the variables x0,t0), and to predict information useful for the
BI. Business intelligence incudes:
the specific customer geolocation (nation, mountains, seaside, etc.) or to customer behaviors observing results of promotion activities;
• social networks (important for predictive analysis of consumption and sales): they represent consumer trends and can provide the customer satisfaction ratings;
• E-commerce data (analysis of sales of products available online useful for the comparison of store sales);
• statistical analysis;
• data mining processing (association rules, clustering and classification [10], etc.);
• other combined data analyses (correlations of attributes by using weather data, market data, open data, etc.);
• logistics (BI associated to logistic aspects and to product traceability).
[image:2.595.88.508.312.623.2]Concerning the last point some methodologies are related to the minimum path to follow (Dijkstra's algorithm) [11-12], the loading and unloading of products in the same location (Savings algorithm) [13], the maximum flow problem (Ford-Fulkerson's algorithm) [14], the return to a starting point after the performing of a certain operation (Eulerian cycle algorithm) [15-16], the shortest route that crosses the transit nodes (2-opt algorithm) [17], the minimization of the total cost (Hungarian method) [18], the flexible transport solutions (Vogel 's approximation method) [19], the fewest kilometers allowing the greatest possible load and the maximum profit (Greedy algorithm) [20], the minimum cost of flows (Relabel-to-front-algorithm) [21], the minimum path "weighed" by appropriate conditions (Floyd-Warshall algorithm) [22], and the crossing of the nearest nodes starting from a random starting point (Nearest Neighbor algorithm) [23].
Figure 1. Main architecture of the project “Predishoes”.
Big Data System
E- business
intelligente
Store 1
Store 2
Store n
Logistic
Customer
behavior
analysis
CRM+PM CRM+PM CRM+PM Statistics Management; Business Intelligence; Data Mining; E-commerce dataConsulting Marketplace Digital Marketing Tecnology Operations Creativity Social Network
Initial condition x0, ti
Time (t) Sal es pr edi ct io n
x0, t0 x1, t1 x
Other recent papers highlighted the research topic of sales forecasting by sentiment analysis including big data analytics methodology [24]. Some researchers analyzed in details E-commerce customer experience and segmentation by predicting purchases [25]. Neural networks are good candidates for purchasing prediction [26]. Sales performance prediction in E-commerce has been performed in literature by sentiment mining [27], thus suggesting to consider sentiment analysis as an important input of the predictor. E-commerce customer preferences and browsing behavior data have been
processed by algorithms in big data processing systems [28]. Sentiment analysis in E-commerce is suitable also for price prediction [29]. All the information associated with the features above described travel into the data flow of Fig. 2 illustrating the architecture of the case of study of the project. In this data flow all data sources are migrated into a Cassandra big data system by means of java and php scripts enabling timing (cron) of data migration and csv importing actions. Figure 2 indicates a way to manage data processed by using different BI tools.
Figure 2. Functional workflow of the data transfer approach related to the case of study.
MSSQL DB
(Microsoft)
PHP
Cassandra DB
(Ubuntu)
Web service/Cloud access
Social Data
Source
Data Transfer
Migration
MySQL
Workbench/Sqoop/
…
Social
Table
Main Data Transfer Workflow
1
1
2
2
3
MySQL DB
4
4
5
5
csv
csv
6
6
Weather data
Source
7
7
Weather
Table
Table 1
Table n
2. BI and Sales Prediction by Data
Mining Algorithms
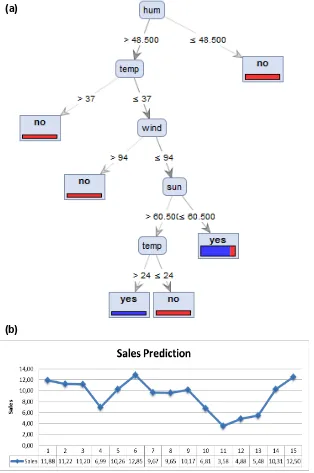
An important aspect related the BI is sales prediction. In this direction, using initially a simulation dataset, it has been adopted a Decision Tree algorithm in order understand how weather data influence the buying behavior in a single store: in Fig. 3 (a) is illustrated the simulation results of a RapidMiner workflow enhancing the best weather conditions for the sales of a store (major number of sales). Similarly also the Regression technique
could be applied in order to predict sales of a store located in a defined geographical position [30] (see Fig. 3 (b)).
The used model for the prediction results of Fig. 3 (b) is represented by [30]:
Salesij=-13,28-1,68x1+0x2+0.44x3-0.11x4+0.17x5
--0.03x6+0.16x7+1.67 (1)
being xi the intercepts embedding weather information.
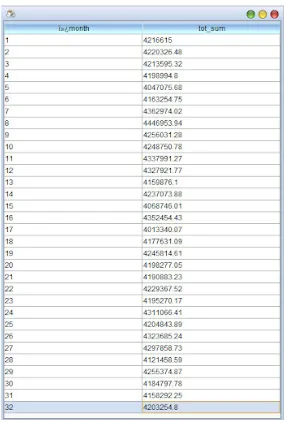
[image:4.595.144.458.228.701.2]Finally artificial neural networks (ANNs) provided the sales predictions by taking into account a training dataset made by monthly sales of a store (see Fig.4).
Figure 3. (a) RapidMiner Decision Tree output of (hum is humidity, temp is temperature, wind is the wind force, and sun is the sun condition). (b) Regression technique of sales prediction [30].
(a)
Figure 4. (Above) Artificial neural network for time forecasting of monthly sales of a single geolocated store (one hidden layer) and (below) simulation results.
For the ANN simulation has been adopted Weka libraries (Time Series Forecasting with Multilayer Perceptron -MLP- classifier [31]). Starting from an Excel file, artificial sales data have been created using the "RANDOM" function in Excel (the extracted CSV contains sales data relating to some months of the years 2016, 2017 and 2018). Figure 4 shows the graph of the predicted values (last blue points) calculated on synthetic data (training dataset indicated by the red points).
3. Logistic Algorithms Embedded in
the Prototype Platform
The geolocation of a single store represent an important aspect for BI. As previously mentioned there are different which can be applied for logistic optimization, such as:
• Dijkstra’s algorithm;
• Eulerian Cycle algorithm;
• Ford-Fulkerson algorithm;
• Greedy algorithm;
• Hungarian method;
• Nearest Neighbor;
• Savings algorithm;
• Floyd-Warshall algorithm;
• Vogel’s Approximation Method;
• Lavesdk.
Figure 5. Graph of nodes constructed on a map containing different stores in the same region.
Figure 6. Screenshot of the outputs of the Dijstra’s algorithm stored into a Cassandra table.
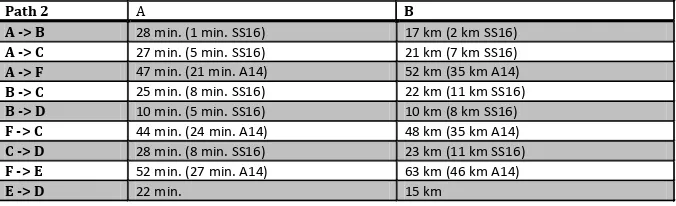
Weights are calculated through a proportion based on different distances and travel time. Data are extracted by means of Google Maps tool and of the web site ViaMichelin.it determining routes, time and costs in function of traffic, road conditions and the type of road chosen (city, provincial, highway…). In particular, two different paths are chosen comparing the minimum path under defined conditions (in path 1, kilometers are less than in path 2, where provincial roads are not used). Table 1 and Table 2 show the two chosen paths.
The Dijstra’s algorithm has been applied on the following stores represented by the cities where are located:
A. Barletta; B. Trani; C. Andria; D. Bisceglie; E. Corato; F. Cerignola.
(a)
Table 1. Path 1 (SS16 indicates a state roads).
Table 2. Path 2 (SS16 and A14 indicate a state roads and highway, respectively).
By defining D location as the starting point, the Dijstra’s algorithm provides the following outputs of the minimum paths:
In path 1A (where weights are equal to minutes), minimum paths to reach every destination from D (Bisceglie) are:
• D -> C (28 min.) -> F (74 min.)
• D -> B (10 min.) -> A (38 min.)
• D -> B (10 min.)
• D -> C (28 min.)
• D -> E (23 min.)
In path 1B (where weights are equal to kilometers), minimum paths to reach every destination from D (Bisceglie) are:
• D -> C (18 km) -> F (64 km)
• D -> B (10 km) -> A (26 km)
• D -> B (10 km)
• D -> C (18 km)
• D -> E (15 km)
In path 2A (where weights are equal to minutes), minimum paths to reach every destination from D (Bisceglie) are:
• D -> C (28 min.) -> F (72 min.)
• D -> B (10 min.) -> A (38 min.)
• D -> B (10 min.)
• D -> C (28 min.)
• D -> E (22 min.)
In path 2B (where weights are equal to kilometers), minimum paths to reach every destination from D (Bisceglie) are:
• D -> C (23 km) -> F (71 km)
• D -> B (10 km) -> A (27 km)
• D -> B (10 km)
• D -> C (23 km)
• D -> E (15 km)
[image:8.595.346.490.482.602.2]In Fig. 7 is illustrated the constructed shortest path tree related to all the examples: the shortest-path tree is the same for every chosen route (with minutes or kilometers). The calculated routes (D -> F) show that even if in route 2 there are 7 km more than in route 1, in terms of time it is possible to gain 2 minutes: this happens because, in the second route, 46 of the 71 km to travel are on state roads and highways.
Figure 7. Constructed graph of minimum paths.
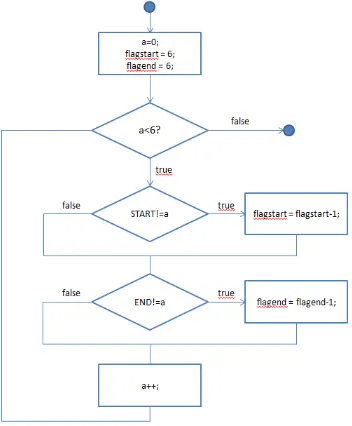
A control code has been implemented thus allowing the user to select the correct vertices of a path graph: this provides an optimization of the computational cost and the overcome of CPU loop problems. In fact, through the use of a while cycle, the code compares the vertices inserted with the standard ones. In particular the following three variables are created:
• variable a (it is the variable that allows to cycle all the possible vertices; it has been initialized to 0 and can reach a maximum number of 5; once it has passed 5, the system will exit the while loop);
Path 1 A B
A -> B 18 min. (7 min. SS16) 16 km (10 km SS16)
A -> C 20 min. 11 km
A -> F 54 min. 38 km
B -> C 29 min. 15 km
B -> D 10 min. (5 min. SS16) 10 km (8 km SS16)
F -> C 46 min. (24 min. SS16) 46 km (34 km SS16)
C -> D 28 min. 18 km
F -> E 56 min. (2 min. SS16) 51 km (4 km SS16)
E -> D 23 min. 15 km
Path 2 A B
A -> B 28 min. (1 min. SS16) 17 km (2 km SS16)
A -> C 27 min. (5 min. SS16) 21 km (7 km SS16)
A -> F 47 min. (21 min. A14) 52 km (35 km A14)
B -> C 25 min. (8 min. SS16) 22 km (11 km SS16)
B -> D 10 min. (5 min. SS16) 10 km (8 km SS16)
F -> C 44 min. (24 min. A14) 48 km (35 km A14)
C -> D 28 min. (8 min. SS16) 23 km (11 km SS16)
F -> E 52 min. (27 min. A14) 63 km (46 km A14)
• variable flagstart (it is the flag variable of the source node; it is initialized at 6 and decremented by 1 whenever the START variable is different from a; if the vertex is not valid, at the end of the cycle the flagstart variable will be equal to 0);
• variable flagend (it is the flag variable of the source node; it is initialized at 6 and decremented by 1 whenever the END variable is different from a; if the
vertex is not valid, at the end of the cycle the flagend
variable will be equal to 0).
Figure 8 shows the flowchart of the algorithm implemented for vertex control.
[image:9.595.126.478.203.629.2]By applying the Floyd-Warshall algorithm have been compared the minimum paths with ones of the Dijstra’s algorithm checking the same solution convergence (see Fig. 9 where E is the destination node and A is the source one).
Figure 9. Screenshot of the outputs of the Dijstra’s and Floyd-Warshall algorithms.
Both the Dijstra’s and the Floyd-Warshall algorithms have been implemented in java language adopting Eclipse platform. In Appendix A is listed the java script allowing the saving of the logistic algorithm into the Cassandra big data.
4. Web Mining: Analysis of Social Trends
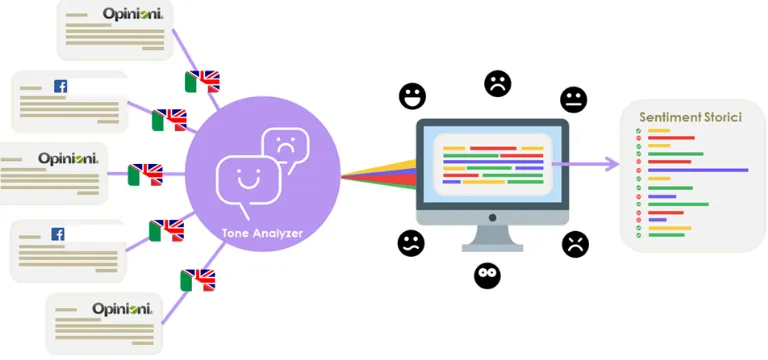
Other important information to analyze for the BI can be obtained by web mining. In particular information found in social network could provide an interesting scenario about the social trends of particular classes of products. A critical aspect for web mining is to traduce the text into a sentiment score. In order to create a model of positive and negative words, it is important to apply before a tool able to extract this information from a phrase. A way is to adopt the tool “Tone Analyzer” [32]. In Fig 10 is illustrated the main data flow adopted for the sentiment extraction: (i) a keyword of a features of a product is found by a social network engine (Facebook, Twitter, etc.); (ii) the social network engine provides post and phrases containing the keyword; (iii) “Tone Analyzer” extracts the sentiment scores about the searched keywords embedded into a phrase; (iv) the sentiment data are stored into the big data system containing other historical sentiment scores. The analysis with historical data could provide the time evolution of the sentiment.
[image:10.595.108.492.552.732.2]A workflow suitable for text mining is illustrated in Fig. 11: the proposed Rapid Miner workflow implements a Support Vector Machine (SVM) algorithm [33]. The workflow of Fig. 11 is structured in the following four main step:
• step 1 (data input and data pre-processing able to provide a numerical representation of the text);
• step 2 (SVM model performance and model training);
• step 3 (document creation and testing);
• step 4 (sentiment outputs performed by the implemented model).
Another workflow adopted for the social sentiment analysis is the KNIME workflow of Fig. 12: this model executes the Decision Tree model and is structured in three stages such as: data pre-processing, data processing (training and testing), and model performance (model score and ROC curve).
[image:11.595.100.494.200.508.2]Figure 11. RapidMiner workflow: sentiment scores extracted from a text.
Figure 12. KNIME Sentiment analysis workflow [34].
DATA INPUT
Document creation
Sentiment scores
Model performance
Data pre-processing
Data processing
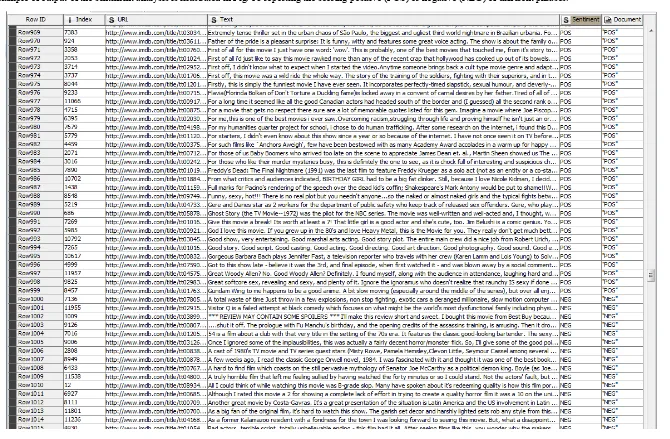
[image:11.595.115.481.521.738.2]An example of output of the sentiment analysis is illustrated in Fig. 13 reporting the scoring positive (POS) or negative (NEG) of different phrases.
A sentiment analysis output of KNIME workflow is shown in Fig. 14 where each keywords are allocated into a tree structure indicating also the occurrences into the analyzed text. The decision tree begins (first level) with the supposition that half of the 1400 classified reviews are positive. The decision to move from a "parent" leaf to a "child" leaf is based on the percentage of presence (<= 0.5 or > 0.5) of the chosen word. For example, at the second level of the tree, the word most often used was "bad". 61.4% of the 1082 reviews, in which the word "bad" is less present, that is “bad <= 0.5” (664 reviews), was classified as "positive". 88.7% of the 318 reviews in which the word
"bad" is more present, that is “bad > 0.5” (282 reviews), was classified as "negative". At the third level, we find the other words which are subclasses of the weighted word “bad”.
[image:14.595.102.496.230.555.2]The good performance of the Decision Tree algorithm is represented by the receiver operating characteristic curve (ROC) of Fig. 15. The ROC curve is a graphical plot illustrating the diagnostic ability of a binary classifier system as its discrimination threshold is varied. The sentiment results are saved into the Cassandra big data by means of the php script reported in Appendix B.
Figure 16. Big Data layout design.
Product
Order
Weather
Logistic Model Social Network
Sentiment/correlations
Customer Promotion to customer
Warehouse Promotion
Promotion product
Fashion (product accessories Fashion accessories
Customs warehouse
Order of customs warehouse
Product ordered
[image:15.808.76.739.74.513.2]5. Big Data Integration
All the data of the algorithms proposed in this paper are collected into a Cassandra big data system. In Fig. 16 is shown the big data layouts embedding different NoSQL tables such as warehouse products availability, promotions, customer data, logistic inputs and outputs, social sentiment results, catalog list of products and accessories. For the database design of the proposed case of study has been adopted the tool DB Designer 4 [35]. Figure 16 represents a possible implementation of data integration into a big data system.
6. Data Mining Algorithm Improving
Data Processing Innovation:
E-Commerce Sales Prediction by
Multi-attribute Processing
As proved by recent studies innovations in research involve multi-attribute analysis [36], and
multi-dimensional analysis adopting Deep learning algorithms [37]. Furthermore it is developing the concept of data analysis from multi-dimensional big data multi-panel [38]. According with multi attribute analysis approach is proposed the model of Fig. 17 where are stored into a big data system (Cassandra or Vertica DB) the following attributes:
• historical E-commerce sales data;
• social sentiment scoring;
• marketing scoring (ratio between marketing trend score and product price);
In Fig. 17 is illustrated an example of the dataset layout adopted for the E-commerce sales prediction.
All data refers to the last 360 days of electronic commerce. For the first time is applied an innovative algorithm proposed in [39]. This KNIME workflow, based on ANN-MLP and RProp approaches [40]-[41], has been recently applied in medical applications for a single attribute input. For the first time this algorithm is applied for multi-inputs thus providing good performance.
[image:16.595.91.498.350.413.2]
Figure 17. Layout of the experimental dataset
Figure 18. Innovative data mining multi-attribute model and related neural network KNIME workflow.
Vertica DB
Cassandra DB
E-Commerce
Social scoring
Marketing/Competitors (dynamic pricing)
Neural
Network
Sales prediction Multi-Attribute input
(weigth functions ) Big Data System DSS Outputs
Python node
Node 1 Node 2 Node 3
Node 4
Node 5
Node 6
[image:16.595.101.489.439.737.2]Below are described the nodes of Fig. 18:
• Node 1 (Python node): this node enables the connectivity with big data systems such as Cassandra or HP Vertica;
• Node 2 (Normalizer): this operator normalizes all values in a scale between 0 and 1 (0 corresponds to the minimum sales number, and 1 is the maximum one) thus allowing to reduce the data processing error;
• Node 3 (Partitioning): this block allows to provide the training dataset (first partitioning) and the testing dataset (second partitioning) ;
• Node 4 (RProp MLP Learner): module able to learn the MLP model processing the training dataset;
• Node 5 (MultiLayerPerceptron Predictor): MLP algorithm testing the neural network model;
• Node 6 (Line Plot): module able to plot sales prediction results;
• Node 7 (Numeric Scorer): block providing model performances.
In Fig. 19 is shown the E-commerce sales prediction trend for the next 17 days.
[image:17.595.82.526.291.616.2]The parameters of the adopted for the neural network model are the following ones: 95% is the relative size of the first partition, the maximum number of iterations is 300, the hidden layers number is 2, the hidden neurons number per layer is 10. The performed means absolute error is 0.1, this means that the predicted sales of the next could oscillate around ± 0.05. In Fig. 20 is illustrated the error plot trend validating the algorithm performance.
Figure 19. Innovative data mining multi-attribute model and related neural network (plot provided by the execution of the node 6 of Fig. 18).
Nor
m
al
is
ed
sa
le
Figure 20. Error plot trend.
7. Conclusions
The proposed paper analyzes some important tools implemented in an industry research project oriented on business intelligence. These tools are related to logistic algorithms, sales prediction, and social analysis. Data mining has been applied for the last two tools by means of WEKA libraries, and Rapid Miner and KNIME workflows. A good performance is checked for all the algorithms outputs, finding a good matching between Dijkstra Floyd-Warshall results, and a good ROC curve for the sentiment analysis. Furthermore the proposed study enhances the integration of these tools into a structured communication systems embedding big data. In order to provide a feasibility study about data flow implementation, have been provided the data management scheme and the database layout able to collect all the input and data outputs of the proposed algorithms. Cassandra big data has been designed and implemented for the integration of different data sources suitable for the data processing of business intelligence outputs and marketing
strategies. The paper illustrates a review of different tools which can be adopted for business intelligence, by providing information about how they can be applied by showing some examples. The proposed work could be help to understand how algorithms could be integrated into an industrial information system. As final results is proposed an innovative model based on multi-attribute analysis, big data connection and neural network workflow able to predict E-commerce sales with a good performance score. Some of inputs of this model are the outputs of other data mining tools such as social sentiment analysis.
Appendix A
code is shown below:
import com.datastax.driver.core.Cluster; import com.datastax.driver.core.Host; import com.datastax.driver.core.Metadata; import com.datastax.driver.core.Session; import static java.lang.System.out; public class CassandraConnector {
private Cluster cluster; private Session session;
public void connect(final String node, final int port) {
this.cluster = Cluster.builder().addContactPoint(node).withPort(port).b
uild();
final Metadata metadata = cluster.getMetadata(); out.printf("Connected to cluster: %s\n", metadata.getClusterName());
for (final Host host : metadata.getAllHosts()) {
out.printf("Datacenter: %s; Host: %s; Rack: %s\n",
host.getDatacenter(), host.getAddress(), host.getRack());
}
session = cluster.connect("test_primadonna"); }
public Session getSession() {
return this.session; }
public void close() {
cluster.close(); }
}
The implemented code follows a precise structure: 1). Connection to the Cassandra server;
2). Path displaying (1A, 1B, 2A, 2B); 3). Path selection;
4). Displaying of weight matrix that refers to the selected path;
5). Initial and destination vertex selection; 6). Algorithm selection;
7). If Dijkstra, shortest path and weight visualization; 8). If Floyd-Warshall, final matrices (weights and
predecessors) displaying and path and weight visualization;
9). Insertion in the DB (if it is not already present).
Appendix B
In order to save the sentiment results to the Cassandra database it is necessary to set some connection parameters through the following php code (it save the .csv data into the Cassandra database):
<?php …
$cassandra = new Cassandra(); $server_host = '[nome_server]'; $server_port = [porta_server]; $server_username = '[nome_user]'; $server_password = '[password]'; $server_keyspace = '[nome_keyspace]';
$cassandra->connect($server_host, $server_username, $server_password, $server_keyspace, $server_port);
…
$cassandra -> close(); …
?> Where:
• • The $server_host variable contains the name of the host to which the user must connect;
• The $server_port variable contains the connection port number;
• The variable $server_username contains the connection username;
• The $server_password variable contains the connection password;
• The $server_keyspace variable contains the name of the keyspace to which the script must connect;
• The code $cassandra-> connect (...) with all the above parameters as input variables allows the script to open the connection;
• The code $ cassandra -> close () corresponds to the command to close the previously opened connection.
Acknowledgements
The work has been developed within the framework of the project titled: Sistema di Business Intelligence di tipo “embedded” basato su prediction real time in sistemi Big Data orientate al settore di calzature e accessori moda “Predishoes” (Business Intelligence Embedded System based on real time prediction in Big Data systems oriented on fashion “Predishoes”).We are very grateful to the following Dyrecta Lab researchers: G. Birardi, V. Custodero, L. D’Alessandro, F. De Carlo, G. Fanelli, M. Legrottaglie, A. Leogrande, G. Lofano, V. Maritati, L. Pellicani, D. D. Romagno, N. Savino, P. Scagliusi, A. Semeraro, M. Solazzo, D. Suma, and E. Valenzano.
REFERENCES
Information Technology, Vol. 9., No. 1, 60 – 70, 2009. [2] G. Muhammad, J. Ibrahim, Z. Bhatti, A. Waqas. Business
intelligence as a knowledge management tool in providing financial consultancy services, American Journal of Information Systems, Vol. 2, No. 2, 26-32, 2014.
[3] M. I. Nofal, Z. M. Yusof. Integration of business intelligence and enterprise resource planning within organizations. Procedia Technology, Vol. 11, 658 – 665, 2013.
[4] R. Fitriana, Eriyatno, T. Djatna. Progress in business intelligence Ssystem research: A literature Review, International Journal of Basic & Applied Sciences IJBAS-IJENS, Vol. 11, No. 03, 96-105, 2011.
[5] R. A. Khan, S. M. K. Quadri. Business intelligence: an integrated approach, Business Intelligence Journal, Vol.5, No.1, 64-70, 2012.
[6] H. Chen, R. H. L. Chiang, V. C. Storey. Business intelligence and analytics: from big data to big impact, MIS Quarterly, Vol. 36, No. 4, 1165-1188, 2012.
[7] A. Elragal. ERP and big data: the inept couple, Procedia Technology, Vol. 16, 242-249, 2014.
[8] B. R. Prasad, S. Agarwal. Comparative study of big data computing and storage tools: a review, International Journal of Database Theory and Application, Vol.9, No.1, 45-66, 2016.
[9] Z. Zheng, P. Wang, J. Liu, S. Sun. Real-time big data processing framework: challenges and solutions, Applied Mathematics & Information Sciences An International Journal, Vol. 9, No. 6, 3169-3190, 2015.
[10]X. Wu et al., Top 10 algorithms in data mining, Knowl. Inf. Syst., Vol. 14, 1–37, 2008.
[11]L. X. Yan, C. Y. Li, Application of Dijkstra Algorithm in Logistics Distribution Lines, Proceedings of the Third International Symposium on Computer Science and Computational Technology(ISCSCT ’10) Jiaozuo, P. R. China, 14-15,August 2010, 48-50.
[12]I. Beker et al., Shortest-path algorithms as a tools for inner transportation optimization, International Journal of Industrial Engineering and Management (IJIEM), Vol.3, No 1, 39-45, 2012.
[13]M. Kiran et al., A Modified savings algorithm based approach for vehicle routing problem with simultaneous pick-up and delivery, International Journal of Emerging Technology and Advanced Engineering, Vol. 3, No. 10, 2013.
[14]Z. Hong et al. Study on Cost Optimization in Logistics Distribution Process, Journal of Next Generation Information Technology(JNIT), Vol. 4, No. 7, 78-86, 2013. [15]Online available from: http://www.exampleproblems.com/
wiki/index.php/Eulerian_path
[16]F. Ghionea, M. Pirvan, An extrapolation of Fleury’s Algorithm for determining the longest path in an undirected graph,” International Journal of Mathematical Models and Methods in Applied Sciences, Vol. 7, No. 6, 647-656, 2013. [17]G. A. Croes, A method for solving traveling salesman
problems. Operations Res., Vol. 6, 791-812, 1958.
[18]H. W. Kuhn, The Hungarian method for the assignment problem', Naval Research Logistic Quarterly, Vol. 2, 83–97, 1955.
[19]M. Mathirajan et al. , Experimental analysis of some variants of vogel's approximation method, AsiarPaicific Journal of Operational Research, Vol. 21, No. 4, 447-462, 2004. [20]Online available from:
http://www.vargosolutions.com/wp-content/uploads/2013/01/VASFT009-Cover.pdf
[21]A. Aly et al. , Securely Solving Simple Combinatorial Graph Problems, 17th International Conference, FC 2013, Okinawa, Japan, April 1-5, 2013, Revised Selected Papers, Springer, Financial Cryptography and Data Security, Vol. 7859 of the series Lecture Notes in Computer Science, 239-257.
[22]S. Sanan et al.,Shortest Path Algorithm, International Journal of Application or Innovation in Engineering & Management (IJAIEM), Vol. 2, No. 7, 2013.
[23]L. Zhang et al. , An Improved K-nearest Neighbor Model for Short-term Traffic Flow Prediction, Procedia - Social and Behavioral Sciences, Vol. 96, 653 – 662, 2013.
[24]R. Y. K. Lau, W. Zhang, W. Xu, Parallel aspect-oriented sentiment analysis for sales forecasting with Big Data. Production and Operations Management, Vol. 27, No. 10, 1775-1794, 2017.
[25]E. Wong, Customer online shopping experience data analytics: integrated customer segmentation and customized services prediction. International Journal of Retail & Distribution Management, Vol. 46, No. 4, 406-420, 2018. [26]H. Sheil, O. Rana, R. Reilly, Predicting purchasing intent:
automatic feature learning using recurrent neural networks. SIGIR eCom workshop, Ann Arbor, Michigan, USA, arXiv:1807.08207 , 2018.
[27]H. Yuan, Q. Li, R. Lau, Topic sentiment mining for sales performance prediction in E-commerce. Annals of Operations Research, Vol. 270, No. 1-2, 553-576, 2018. [28]D. Malhotra, O, P. Rishi, An intelligent approach to design
of E-commerce metasearch and ranking system using next-generation big data analytics. Journal of King Saud University –Computer and Information Sciences, in press, https://doi.org/10.1016/j.jksuci.2018.02.015 , 2018. [29]K.T. Tseng, R. F.-Y. Lin, H. Zhou, K. J. Kurniajaya, Q. Li,
Price prediction of E-commerce products through internet sentiment analysis. Electronic Commerce Research, Vol. 18, No. 1, 65-68, 2018.
[30]A. Massaro, D. Barbuzzi, V. Vitti, A. Galiano, M. Aruci, G. Pirlo, Predictive sales analysis according to the effect of weather, Proceeding of RTA-CSIT 2016.
[31]R. Kumar, & P. Balara P., Time series forecasting of nifty stock market using Weka, JRPS International Journal for Research Publication & Seminar, Vol. 5, No. 2, 1-6, 2014. [32]Online available from:https://tone-analyzer-demo.ng.bluem
ix.net/
[34]Online available from: https://www.knime.com/blog/sentim ent-analysis
[35]Online available from: http://fabforce.eu/dbdesigner4/ [36]S. Bhatia, N. Stewart, Naturalistic multiattribute choice,
Cognition, Vol. 179, 71-78, 2018.
[37]T. Young, D. Hazarika, S. Poria, E. Cambria, Recent trends in deep learning based natural language processing. IEEE Computational Intelligence Magazine, DOI:10.1109/MCI.2 018.2840738, 2018.
[38]L. Matyas, The econometrics of multi-dimensional panels theory and applications,” Springer book 2017.
[39]A. Massaro, V. Maritati, N. Savino, A. Galiano, D. Convertini, E. De Fonte, M. Di Muro, A study of a health resources management platform integrating neural networks and DSS telemedicine for homecare assistance. Information, Vol. 9, No. 176, 1-20 2018, doi:10.3390/info9070176. [40]C. Igel, M. Toussaint, W. Weishui, RProp using the natural
gradient. Trends and Applications in Constructive Approximation; Mache, D.H., Szabados, J., de Bruin, M.G., Eds.; Birkhäuser: Basel, Switzerland, 2005, Vol. 151, 259– 272. ISBN 978-3-7643-7124-1.


![Figure 12. KNIME Sentiment analysis workflow [34].](https://thumb-us.123doks.com/thumbv2/123dok_us/8783124.905338/11.595.100.494.200.508/figure-knime-sentiment-analysis-workflow.webp)