A New Technique for Archiving Manuscript Documents
Muhammad Adeel Javaid
Member Vendor Advisory Council CompTIA *Corresponding Author: [email protected]
Copyright © 2014 Horizon Research Publishing All rights reserved.
Abstract
In the specific context of safeguard of old documents encountered by specific problems of conservation (damp patches, folds, tears, shade… etc.), we are interested in the diagnosis of the methods of compression of the two families: reversible (without loss) and irreversible methods (with loss). Particularly, we are interested in the current methods like RLE, Compression LZ and LZW, Huffman, Deflate, CCITT Group 3 and 4, JPEG, JPEG2000, png, and fractal Compression. The goal of this work is to develop a semi-automatic tool able to quantify the quality of a compression of old documents. Then, can answer objectively for the choice of a compression method from a collection of images. The choice of this collection must be representative in terms of a number of images and typology of images of the same context, like here the old documents. In this paper, we propose a semi-automatic method that operates at the first time on a supervised classification of the original image to raise K groups with distinguished characteristics. The choice of K is previously determined by the user: writing, bottom, tear….etc. In the second step, we calculate the movements (intra class and inter class). The last step consists in calculating of the degradation measurement.Keywords
Classification Application, ArchiveApplication, Manuscript Archival Application
1. Introduction
All treatment applied on digital images must be validated by a process of quality. In the context of images compression, and especially concerning the compression of the images of ancient manuscripts, this process is based on measures of the quality of the rebuilt image. For applications in which images are finally degraded, the only correct method for measuring of the visual quality of image is by the subjective assessment. In practice this assessment is realized by subjective criteria such as the Mean Opinion Score (MOS) [1]. This measure i s still heavy, and very costly. However, this assessment cannot be in any case used in a scheme of image coding [2]. In order to avoid this problem, it is necessary to assess the quality of the compressed images, this is realized by MSE: Means Square Error or PSNR: Peak
Signal Noise Ratio. Until today the measure of PSNR is considered as the most used criteria for evaluating the quality in image processing, however, the PSNR is a quantitative measure and need sometimes a subjective assessment of the degradation.
From quantitative measures, the objective methods assessing the perceptual quality of the image have traditionally attempted to measure the visibility of the errors between an image deteriorated and a reference image using a set of properties inspired by the human visual system (HVS) [3][4][5]. Our contribution is interested in distinguish in groups the elements of the image to associate a strong weighting for the relevant groups, and shall be less important for the groups less relevant according to HVS.
Our method is going to take advantage of both types (objective and subjective), then we developed a semiautomatic tool capable of quantifying the quality of a compression in front of archive documents. So, it allows answering objectively the choice of a method of images compression. The choice of this collection must be representative in terms of number of images and typology of images of the same context, as here the old documents.
2. Process of Classification
The techniques of automatic classification are intended to produce groups of objects by an algorithmic step. The objects to be classified are in general individuals whom we wish to divide into disjoined homogeneous classes. The methods used are different and many but the total step articulate on three principal axes:
Identify the criteria of selection of the individuals
Calculate the similarities between the individuals
Use the heuristic ones to classify the individuals. Moreover, we distinguish two types of classifications:
Supervised classification: the classes and their properties are known with priori. A semantic is generally associated to each class.
Here, we are informed on the characteristics of the image. Supervised classification is more suitable.
Figure1. Example of image
For example of the figure 1 we observe that are three classes in the image: writing, bottom, tear.
3. Process of Measurement
3.1 Supervised Classification
[image:2.595.68.286.107.240.2]Our algorithm uses a method of classification overseen more exactly the method of distance minimum. With this method, the rule of decision for the affectation of a pixel in a class is the distance minimum between the value of the pixel and the center of a cloud of point representing a class. So pixels are allocated to the class to which the average is closest. This nearness spatial and often are measured by the Euclidian distance.
Figure 2. pixels affectation
Iterative algorithm Initialization
Choice of a distance suited (in our work it is the Euclidian distance).
Read the entry classes
Calculate the center of gravity of each class
Calculate the distance between the individual and the centers of the classes
Affectation of every individual has the class of the closest center of gravity
Pass in the following pixel
Our function of classification is based on the calculation of the distances between every pixel and the centers of
classes; the distances are calculated by the formula of the distance of Manhattan:
𝑫𝑫=𝒂𝒂𝒃𝒃𝒔𝒔(𝒂𝒂(𝒊𝒊,𝒋𝒋,𝟏𝟏)−𝒂𝒂(𝒊𝒊𝟏𝟏,𝒋𝒋𝟏𝟏,𝟏𝟏))+𝒂𝒂𝒃𝒃𝒔𝒔(𝒂𝒂(𝒊𝒊,𝒋𝒋,𝟏𝟏)−
𝒂𝒂(𝒊𝒊𝟐𝟐,𝒋𝒋𝟐𝟐,𝟏𝟏))+𝒂𝒂𝒃𝒃𝒔𝒔(𝒂𝒂(𝒊𝒊,𝒋𝒋,𝟏𝟏)−𝒂𝒂(𝒊𝒊𝟑𝟑,𝒋𝒋𝟑𝟑,𝟑𝟑)) (1)
3.2. Movements Measurement
After every compression we redo the same process (supervised classification) and we calculate the movements of pixels. We notice two types of movements.
[image:2.595.318.548.236.412.2]Intra class: the pixel moves in the same class. Inter class: the pixel moves towards another class.
Figure 3. Pixels movements
Iterative algorithm
Applied the function of classification to both images (original and compressed).
Read the classes (the classes in that case are the result of the previous function)
While N ° of class <=3
o While we did not arrive at the end of the picture
Read N of pixel (the current compartment of the 1st lines)
Look for the same element in three classes of the image tablet.
Compare both distances If they are different and have the same N ° of class we are in the case of a movement intra classy.
If they are different and have the same N ° of class we are in the case of an Intra class movement.
The movement is calculated by the differences between both distances. o Pass in the following element.
Pass in the following class
3.3. Measure of degradation
After the stage of the movements’ measurement, it still remains to us the last stage, calculating our measure. Our measure is calculated by the following formula:
(2)
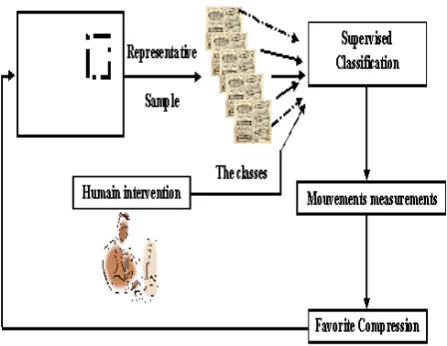
4. General schema
[image:3.595.66.290.318.491.2]We carry out our regrouping on the basis of property of coding of the color of the image. In this first version in mode RGB (component Red, Green, Blue). The problem of regrouping in this case, can be seen like a problem of separation of a set of pixels in a certain number of groups according to their components RGB.
Figure 4. General schema of the proposed model of measure According to the schema given (figure 4), let us recall the architecture which we propose for a tool for evaluation of the quality of compression of archival manuscript documents:
a) Starting of corpus of images, a decider must bring the answer on which method compression to choose? Our system known as “semi-automatic” makes it possible to answer this question with objective evaluations (movements measurement) and subjective ones (notations of the decision maker). Of course, these evaluations are operated on a subset of the selected corpus in terms of representativeness of the typology of documents treated.
b) Each image of the subset must initially pass by the phase known as automatic, then the phase known as semi-automatic insofar as it utilizes human (appraiser).
Automatic phase: This phase consists in making a distinctive regrouping of pixels, i.e.: the pixels relating to the writing will form the same group, those of the bottom of the image another group; it will be the same for the tasks, shades, and other spots of conservation. This operation called classification is
ensured by a process explained in section 2. Remain to determine the number of groups to build. (three in our case)
Semi-automatic phase: Once the various groups are well distinguished in the preceding phase. An appraiser gives more weight to the important groups for the legibility of the document like the writing and the bottom. The task of compression should not degrade these groups. By opposition, the groups translating of the noise are slightly balanced in terms of importance; a degraded compression is probably without incidence.
c) Then it acts to measure degradation after the choice of a method of compression. Several methods should be tested to have the best compromise between the qualitative factor and the size one, after compression.
5. Movements Measurement of Pixels
for Several Methods of Compression
We constituted 6 documents to lead 6 sets of tests on the model which we propose. The tested methods of compression are: GIF,
PNG-8,
PNG-24,
JPEG,
JPEG2000
Table 1. Number of intra-class movements
Image
(Original size) PNG TIFF Jpeg Jpeg2000
Im1 (98 ko) 18720 18720 18515 164
Im2 (119 ko) 37862 37862 36776 55
Im3 (178 ko) 52143 52143 53804 117
Im4 (253 ko) 63752 63752 73325 132
Im5 (545 ko) 70725 70725 70235 56
Im6 (1136 ko) 142973 142973 141172 412
Min 18720 18720 18515 55
Max 142973 142973 141172 412
Average 64363 64363 65638 156
[image:3.595.311.554.354.623.2]of compression towards the nature of the image.
The results indicate initially, a correlation between the size of the original and degradation. Certainly, more the image is voluminous; more the number of movements are high.
We also notice that the number of movement increases with regard to the method of compression, what indicates that our model is really sensitive to the slightest degradation which affects the image after a compression.
[image:4.595.310.552.220.325.2]The following table (table 2) shows Number of interclass movements
Table 2. Number of interclass movements Image
(original size) PNG TIFF Jpeg Jpeg2000
Im1 (98 ko) 11881 11881 13153 2
Im2 (119 ko) 2017 2017 983 1
Im3 (178 ko) 6162 6162 5271 9
Im4 (253 ko) 21332 21332 9848 2
Im5 (545 ko) 1908 1908 1863 1
Im6 (1136 ko) 1989 1989 1909 7
Min 1908 1908 983 1
Max 21332 21332 13153 9
[image:4.595.59.301.228.385.2]Moyenne 7548 7548 5668 4
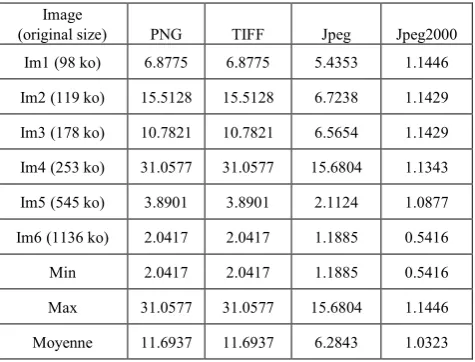
Table 3. Degradation measure of the compression quality according to the compression method
Image
(original size) PNG TIFF Jpeg Jpeg2000
Im1 (98 ko) 6.8775 6.8775 5.4353 1.1446
Im2 (119 ko) 15.5128 15.5128 6.7238 1.1429
Im3 (178 ko) 10.7821 10.7821 6.5654 1.1429
Im4 (253 ko) 31.0577 31.0577 15.6804 1.1343
Im5 (545 ko) 3.8901 3.8901 2.1124 1.0877
Im6 (1136 ko) 2.0417 2.0417 1.1885 0.5416
Min 2.0417 2.0417 1.1885 0.5416
Max 31.0577 31.0577 15.6804 1.1446
Moyenne 11.6937 11.6937 6.2843 1.0323
The table 2 shows well the difference marked between the methods as the JPEG and the JPEG 2000 and others. We know the power of the JPEG model as an irreversible model but the loss of which is planned in a sensible way, by taking into account capacities of the human eye. For our model it’s rather clear that the JPEG and JPEG2000 models presents fewer movements inter class than the rest of the methods, what is already a good comparative measure.
The table 3 shows the stability of the tests, what allows us to conciliate for the same compression ratio as 2 methods (PNG, TIFF) remain nearby and less powerful. The interest is carried for the JPEG and JPEG 2000 methods which give
good results in that case of tests. The economic aspect is also determining to slices between these two formats
[image:4.595.60.298.418.599.2]6. Variation of the Degradation
According To Compression Ratio
The following table (table 4) shows the variation of the average of degradation according to 5 selected levels of compression (1:12, 1:24, 1:30, 1:40, 1:50)Table 4. Variation of degradation according to the compression ratio
Taux de compression PNG TIFF Jpeg Jpeg2000
10% 3.5891 3.5891 2.5236 1.1115
20% 4.1236 4.1236 2.6129 1.1219
30% 4.6325 4.6325 3.0455 1.1205
40% 8.6523 8.6523 5.3256 1.1311
50% 10.5891 10.5891 6.2351 1.3228
According to our model, the table shows well that degradation believes very quickly with the increase in the compression ratio, in particular for methods GIF, PNG-8, and PNG-24. In less marked, it will be the same for method JPEG. Method JPEG 2000 after a compression 1:50 one remains with a tiny degradation. Clearly, the effectiveness of this method was already proven in the literature, it is not the object of this section. This being said, that makes it possible to note the relevance of the model of evaluation which we set up.
7. Conclusion
We presented a new method of measure of the compression quality, based on a supervised classification and movement’s measurement.
The results of the evaluation of this method show initially, logic of the model of evaluation compared to the results noted through other method. Also, the numerical results coming from the model reflect the conclusions noted in the literature for each studied model. Some experiments control highlighted the major impact of certain post processing on the visibility of the artefacts of compression. The principal post processing of which the use must be supervised in combination with compression is the reinforcement of contour (for the description of the writing).
REFERENCES
[1] CCIR, « Method for the subjective assessment of the quality of television pictures », Recommendations and Report of the CCIR, Rec. 500-2, Genève 1982.
[2] A. Tamtaoui, M. Ribagnac, D. Aboutajdin,« Elaboration de critères de mesure de qualité objective pour la qualité subjective », Dix-septième colloque GRETSI, Vannes, 13-17 septembre 1999.
[3] J. M. Foley, G. M. Boynton, « A new model of human luminance pattern vision mechanisms: Analysis of the effects of pattern orientation, spatial phase, and temporal frequency », in Computational Vision Based on Neurobiology, Proc. SPIE (T. A. Lawton, ed.), vol.2054, 1994.
[4] J. Lubin, «A visual discrimination mode for image system
design and evaluation », in Visual Models for Target Detection and Recognition (E. Peli, ed.), p.245–283, singapore: World Scientific Publishers, 1995.
[5] D. R. Fuhrmann, J. A. Baro, J. R. Cox, « Experimental evaluation of psychophysical distortion metrics for JPEGencoded images », Journal of Electronic Imaging, vol. 4, p. 397–406, Oct. 1995.
[6] E.W. Forgy, « Cluster analysis of multivariate data: efficiency versus interpretability of classifications », Biometric Society meeting, No. 21, 1965
[7] M. Jambu, « Exploration informatique et statistique des données », Collection technique et scientifique des télécommunications, 1989