Structure-Properties Relationship of TRIP-assisted Steels
by Non-destructive Testing Method
Animesh Talapatra
1,*,
Jayati Datta
2, N.R.Bandhyopadhyay
31MCKV Institute of Engineering (affiliated WBUT), 243 G.T.Road, Howrah, West Bengal, PIN-711204, India 2Chemistry Dept, Howrah, West Bengal, India and BESU, Shibpur, Howrah, West Bengal, India
3School of Materials Science and Engineering, BESU, Shibpur, Howrah, West Bengal, India
*Corresponding Author: animesh [email protected]
Copyright © 2013 Horizon Research Publishing All rights reserved.
Abstract
This study was conducted on twoTRIP-assisted steels (having low temperature (–400C) high
Charpy impact value) designated A (having no Cr and Cu content, VHN=169, UTS=542MPa) and B (having higher Ni, Cr and Cu content, VHN=217, UTS=657MPa).These steels were heattreated under different conditions to investigate correlation between heat treatment, microstructure and different properties. Micro-structural characterizations were carried out by optical microscope and scanning electron microscope after electrolytic etching. Non-destructive electro-chemical and ultrasonic testing on two TRIP-assisted steels were used to find out corrosion and mechanical properties of different alter microstructure phase’s steels. Furthermore, micro-structural studies accompanied by the evaluation of mechanical properties revealed that steels having martensite phases with higher corrosive and hardness value were less sound velocity and also steel’s microstructure having finer grains that was more grain boundary was less corrosion resistance. Steel containing more Cu, Ni and Cr was less corrosive compared to other steels having same processing or microstructure i.e. Rp (B) > Rp (A).The additions of alloying elements, such as Cu, Cr, Mo, Ni, etc. within the rust layer contribute to the improvement of electro-chemical characteristic of TRIP assisted steel. The corrosion current or icorr increases and
corrosion resistance or Rp decreases with increasing Cl− ions
in solution up to a threshold value beyond which the corrosion rate starts to decrease.
Keywords
TRIP-assisted steels, heat treatment, corrosion, electro-chemical techniques, micro-structural characterization, non-destructive (ultrasonic) technique1. Introduction
1.1. Literature Review on TRIP Assisted Steels
The automotive industries pay a great deal of attention to
development of the new classes of steels with enhanced combination of strength–formability for more affordable, safe and fuel-efficient vehicles. From the 1950’s to the 1960’s, the rimmed steel was researched and used. From the 1960’s to 1970’s, many killed steels were developed and employed. From the 1980’s to the 1990’s, to highly improve the formability of sheet steel, the research of auto steel was mainly centralized in interstitial-free (IF) steel. By the 21st
century, most projects of auto steel focused on developing new kinds of HSS and new style steels to meet the needs of the plan of ultra light steel auto body (ULSAB).These steels include double-phase (DP) steel, TRIP-steel and TWIP-steel. Transformation induced plasticity (TRIP) aided steels and twinning induced plasticity (TWIP) aided steels are the promising candidates fulfilling such demands Ref [1]-[3].The main difference between TRIP-assisted and TWIP steel is that the austenite in the former is stable on cooling but not under mechanical load, i.e. phase transformation happens when the material is loaded. In contrast, there is no phase transformation in TWIP steel during cooling or deformation, but the orientation of part of austenite will change due to mechanical twinning. The different behavior of the austenite is attributed to its stacking fault energy (SFE). If SFE is very low (<20 mJ/m2),
martensitic-induced plasticity is favoured Ref [4]. Higher SFE of the order 25mJ/m2 suppresses martensitic phase
transformation and favours mechanical twinning until SFE values <60 mJ/m2 Ref [5]-[6]. Steels having a fully austenitic
microstructure are called TRIP steels Ref [3]. These steels tend to be rich in nickel and other expensive austenite stabilizing elements. By contrast, austenite is only a minor phase in the overall microstructures of TRIP-assisted steels Ref [7].
however, on the resistance of TRIP steels to localized attack (pitting corrosion), especially in chloride solutions, including sea-water. Nor was there in form formation on the corrosion resistance of TRIP steels that have been cold-worked and thus partly transformed to Martensite. Corrosion of automotive components by road salt is a widely known problem. The different parts under the car body and the interior surface of body panels suffer easily from the corrosive products deposited on roads and used mainly to melt snow. Automotive corrosion is classified into three types’ perforation corrosion, cosmetic corrosion and edge corrosion. In moderate-velocity and high velocity sea atmosphere, Ni base alloys have excellent resistance to cavitations, erosion and exhibits corrosion rates of less than 0.025mm/year. Other Ni-base alloys containing Cr and Mo offer increased resistance to localized corrosion in stagnant sea atmosphere. There are so many factors and elements responsible for corrosion but the most important ones to consider are; oxygen, formation fluids, drilling mud, water and carbon dioxide, high velocity sand, hydrogen sulphide and complications from temperature, pressure and stress Ref [11]-[13].
1.2. Purpose of the Study
Keeping in view above study on corrosion behaviours to moderately low carbon steels having Si, Mn, Ni, V, Nb, Mo and/or Cu and Cr, designed and develop for naval application has been attempted in this study. Electro-chemical test under simulated condition of marine atmosphere both at laboratory stage and real seawater condition, beside immersion test by varying the control parameters viz. exposure time, influence of pH, salinity etc. are the methodology that would be adopted for evaluation of corrosion-characteristics.
No data base being available in literature on the systematic study on effect of corrosion on multi-phases microstructure. Efforts are being made to find out a correlation between heat treatment, post and pre-corrosion microstructure with corrosion behaviour of the steels. The microstructure after heat-treatment consists of ferrite, bainite, retained austenite and sometimes, martensite. The excellent mechanical properties exhibited by Transformation Induced Plasticity steels are mainly due to the martensite transformation of the metastable retained austenite induced by strain. The stability Ref [10]-[12] of retained austenite depends on the carbon content in the retained austenite lattice (chemical stability), the size and the distribution of residual austenite as well as the morphology of the surrounding phase (mechanical stability). It has also been observed that the optimum
elongation behaviour is obtained when the retained austenite is present in the microstructure in the form of the thin films between the bainitic ferrite laths rather than as a blocky type between the bainitic ferrite grains. TRIP-aided steel are composed of four phases forming a very fine microstructure which makes their observation difficult. For light microscopy observation, some specific etchants have been tested.
It is essential to do more study in corrosion behaviour and performance of the material in order to evaluate and improve the design, cost effectiveness and reliability of each material used. Khoshnaw Ref [10] studied fatigue strength of low alloy steels in chloride solution. Turnbull Ref [12] studied stress corrosion cracking of stainless steel in chloride solutions. Chen Ref [11] studied mechanical properties of low-alloy steels in atmosphere containing chloride in tension test.
2. Experimental Procedures
2.1. Materials
Two moderately low Carbon high strength low alloy steels for sea atmosphere automotive application are designated as A and B having composition given in Table 1.They were supplied by DMRL, Hyderabad, India.
2.2. Heat Treatment
Steels were heat treated as per schedules as shown in below in Table 2 to develop different microstructure phases in different steels.
2.3. Optical Micrograph
Table 1. Chemical composition of Steel A & Steel B
Steel C Mn Si P Ni Cr Cu V Nb Mo
A 0.1 1.3 0.3 0.02 0.7 0 0 0.03 0.03 0
B 0.1 0.4 0.2 0.02 2 0.4 0.6 0.03 0 0.4
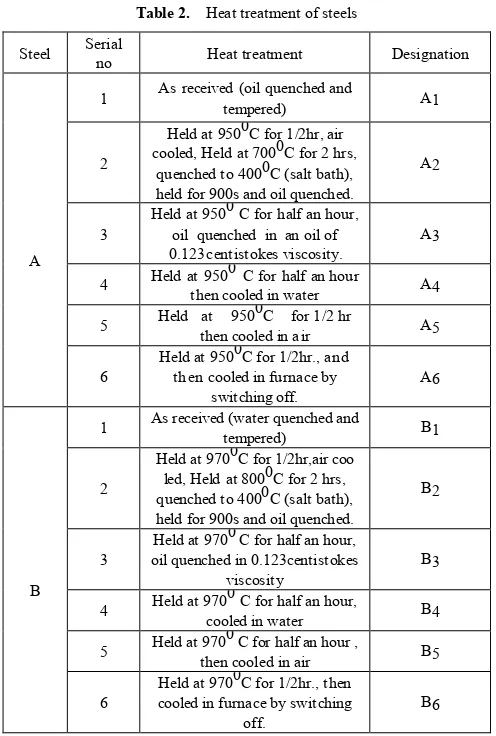
Table 2. Heat treatment of steels
Steel Serial no Heat treatment Designation
A
1 As received (oil quenched and tempered) A1
2
Held at 9500C for 1/2hr, air cooled, Held at 7000C for 2 hrs,
quenched to 4000C (salt bath), held for 900s and oil quenched.
A2
3 Held at 9500 C for half an hour, oil quenched in an oil of
0.123centistokes viscosity. A3
4 Held at 9500 C for half an hour then cooled in water A4
5 Held at 9500C for 1/2 hr then cooled in air A5
6 Held at 9500C for 1/2hr., and then cooled in furnace by
switching off. A6
B
1 As received (water quenched and tempered) B1
2
Held at 9700C for 1/2hr,air coo led, Held at 8000C for 2 hrs, quenched to 4000C (salt bath), held for 900s and oil quenched.
B2
3 oil quenched in 0.123centistokes Held at 9700 C for half an hour,
viscosity B3
4 Held at 9700 C for half an hour, cooled in water B4
5 Held at 9700 C for half an hour , then cooled in air B5
6 cooled in furnace by switching Held at 9700C for 1/2hr., then
off. B6
2.4. Phase Analysis
This is used to estimate the area percentage of different phase’s composition of material. In phase analysis thresholding images can be done by different color. It is calculated area% and area of selected Phase in different colors. Single Phase can be done by simply clicking on particular portion and it can be reset or deleted. It allows user to acquire, process, and analyze the images of the polished sections when it is necessary to estimate the area percentage of different phases. If the image is color or b/w (depending on the image) the program starts its processing. The phases for (e.g. different minerals, inclusions in the metals, etc.) are threshold. For phase thresholding the B/W or Color manual thresholding method is used. If you are not satisfied with their thresholding there is an ability to adjust it by moving the graphical sliders. The phase analyses ASTM
E 566 1245 have been done by using Olysia m3 software. Samples were prepared as like as preparation of sample for optical microscope observation. Then images were taken in optical microscope. The acquired images of a multiphase object were taken for analysis. Phase analysis will be conducted on a gray-value image. The image is selected and threshold is set to define the gray value ranges for the separate phases. The OLYSIA software created a measurement sheet showing the absolute area and proportional area (in %) of all the phases. The measured values are taken.
2.5. Electro-chemical study
2.5.1. Samples and Solution preparation
Cutting samples were polished on belt followed by polishing on polishing wheel (rough to fine) emery papers. The polished surface appeared like mirror having no scratches. They were then degreased with acetone before exposing to the electro-chemical test. Solution of 0%, 0.1%, 1% and 3% NaCl at pH 7(Nearly) were prepared with triple distilled water.
2.5.2. Polarization Study
Samples were taken in an area of 0.204 square cm size coupons for performing potentiodynamic polarization studies in de-aerated condition in cells with three electrodes (working electrode, aqueous saturated calomel SCE (W) as the reference electrode and Pt foil as counter electrode). Linear sweep voltammetry was preformed with the help of AUTOLAB 12 PGSTAT, Eco Chemic B.V (the Netherlands) at 0.5 mV/s scan rate within the potential range of -1500 mV to the cathodic potential of 650 mV vs.SCE. Potential scans were conducted in de-aerated conditions by purging the solution with nitrogen for 10min.Tafel analysis was perfomed to determine the corrosion parameters. The relationship between current density and potential of anodic and cathodic electrode reactions under charge transfer control is given by the Butler-Volmer equation.
2.5.3. Electro-chemical Impedance Spectroscopy
[image:3.595.54.302.176.544.2]pH. The experiment was performed in three electrode one compartment cell containing the test coupons as working electrode, a large area Pt foil as counter electrode and a saturated calomel reference.
2.6. Nondestructive Testing
The measurements of the ultrasonic velocities were accomplished using a longitudinal and transverse wave transducer. The technique used was the pulse echo based on the direct contact with the sample. To measure the velocities of longitudinal waves, it was used a normal incidence transducer of 5 and 10 MHz.The EPOCH4 ultrasonic flaw detector with its high voltage pulse, the quality of its square pulse and selectable narrowband filters is the instrument of choice for this technique.With the values of material densities and ultrasonic velocities (longitudinal and transverse waves), the elastic modulus was calculated based on the ASTM E 494-1995 norm (Measuring Ultrasonic Velocity in Materials) using the equation. After the measurements of the longitudinal and transversal wave ultrasonic velocities, the elastic modulus of each samples were calculated, considering the ASTM E 494-95 norm. According to the ASTM E-494-05 norm, the results for the elastic modulus obtained by ultrasound testing have an error around 1% in comparison to the values obtained by mechanical testing. Elastic modulus is related to the inter-atomic forces and hence indicates maximum attainable strength. There exists a direct mathematical relationship between elastic modulus and ultrasonic longitudinal and shear velocity.
These relationships are as follows:
i)Young’s Modulus E = ρ.VT2. (3VL2 – 4VT2) / (VL2 – VT2),
ii ) Shear Modulus G = ρ. VT2,
iii ) Bulk Modulus B = ρ. (VL2 – 4. (VT2 ) / 3),
iv ) Poisson’s Ratio υ = (VL2 – 2. VT2)/(2.VL2 – 2. VT2),
v ) Fracture toughness KC is given by: KC = √E.Gc.
E is the Young’s Modulus; Gc is the strain energy release factor. Kim and Johnson et.al (2007) using resonant ultrasonic spectroscopy measured the elastic modulus of ferrite, ferrite pearlite, and martensite microstructures, being the obtained elastic modulus of 211.9, 210.3 and 203.5 GPa and the density values of 7.851, 7.835 and 7.709 g/cm³, respectively. According to Hakan and Orkun (2005), in the case of the specimens consisting of pearlite-ferrite, the main difference in the microstructure is the spacing of the cementite lamellae-ferrite, and content and size of ferritic phase. Yield strength is defined as a lower yield point or as the strength at 0.2% offset strain in case of the absence of a yield point. The work-hardening behaviour is described
using the change in the instantaneous work-hardening exponent n is defined as the following equation evaluated from the true stress-strain curve.
3. Results and Discussion
3.1. Microstructural Characteristic
The microstructure characterization was carried out using optical microscope OLYMPUS CK4OM-CP JAPAN. Microstructures of the corroded samples were studied by optical microscope after electrolytic. The morphology of retained austenite has been classified into five different phase categories:
- Blocky shape enclosed by polygonal ferrite, - Blocky or layer shape enclosed by acicular ferrite, - Blocky or layer shape enclosed by bainite packets, - Interlayer film enclosed by martensite laths, - Austenite/ martensite constituent.
Pre corrosion samples
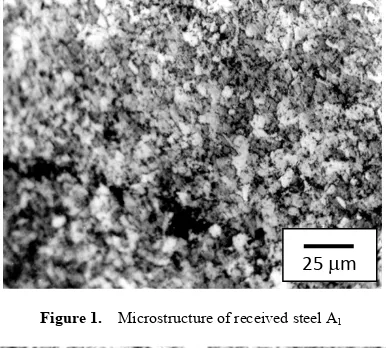
[image:4.595.336.529.409.583.2]The optical microstructure of as received condition (A1) reveals mostly polygonal ferrite with certain amount of tempered bainite as shown in Figure1. The optical microstructure of as received condition (B1) reveals mostly tempered bainitic structure with certain amount of blocky polygonal ferrite as shown in Figure 2.
[image:4.595.337.530.577.727.2]Figure 1. Microstructure of received steel A1
Figure 2. Microstructure of received steel B1
25 µm
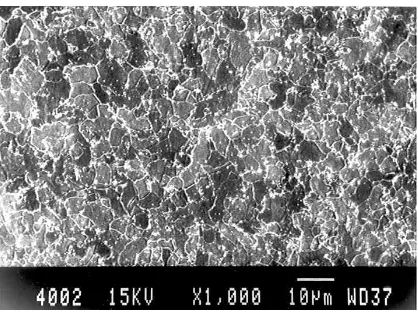
The SEM images of as received condition show mostly polygonal ferrite (A1) but microstructure with higher magnification reveals a grain boundary thickening may be due some carbide precipitation and tempered bainite (A1) as shown in Figure 3. SEM image of the steel in as received condition show mostly, acicular ferrite with some polygonal and quasi-polygonal ferrite and tempered bainite (B1) as shown in Figure 4. Etching using 0.1% NaCl, 1% NaCl solution. When the A steel was intercritically annealed and quenched in salt bath for incomplete bainitic transformation, following the conventional heat-treatment schedule of TRIP aided dual phase steel (A2) as shown, the microstructure is,
[image:5.595.75.284.237.393.2]as expected, consist of granular ferrite and bainite.
Figure 3. SEM of received steel A1
Figure 4. SEM of received steel B1
There must have been some amount of martensite-austenite (MA) constituent. The microstructures comprise of mostly acicular ferrite/ bainite with certain amount of quasi-polygonal and granular ferrite. When the steel B was heat-treated, the microstructure is found to be consisting of acicular ferrite/ bainite with some islands of polygonal and quasi-polygonal ferrite (B2). A2 and B2 reveal
granular ferrite plus bainite and granular ferrite plus tempered bainite. The microstructure of the steel continuously cooled with increasing cooling rate (A3) i.e.
decrease in viscosity of the quenching medium, has increased the acicularity of the microstructure. The microstructure of the steel continuously cooled with
increasing cooling rate (B3) as comprise of low temperature
transformation product of austenite, mostly acicular ferrite/bainite with some amount of granular ferrite. Increase in cooling rate has increased the acicularity of the microstructure with some amount of martensite laths could be noticed at the structure with parallel lath groups replacing the non-parallel laths of acicular ferrites. A3 and B3 reveal acicular ferrite plus bainite and accicular ferrite. B4 as ferrite and martensite. Finally B5 reveals ferrite and pearlite. Post-corrosion samples
Post corrosion microstructures were taken for a few samples for both steels, reveal adequate corrosion both in the form of grain boundary attack and pitting. However steel having high percentage of Cu and Cr, in case of steel B, this corrosion attack is comparatively less in all heat treatment schedules seemingly due to formation of protective oxide layer. All the above microstructure when subjected to image analysing system, it is seen that high % of martensite and/ or pearlite in ferrite matrix during water and air cooling. Corresponding threshold images of A steel and B steel as shown in Figure no-5(A), (B), (C) and 6 (A), (B), (C).
(A)
(B)
[image:5.595.348.517.332.652.2](C)
Figure 5. Corresponding threshold image of Steels (A 1), (A 2) & (A3)
Here also B6 shows the most corrosion resistance property compared to other sample.
[image:5.595.73.285.415.576.2]corrosion behaviour of the normalized sample was found to be greater than the alloy in quenched condition (water). This may be due to fact that the amount of non equilibrium phases in A4 is much higher than A5. As the second phase in A5 may contain with some amount of bainite and mostly pearlite. When the alloy was annealed the amount of ferrite increases considerably and the second phase being pearlite. When the alloy was heat-treated accordingly schedule 2 and 3 the microstructure predominantly consists of ferrite and bainite with certain possibility of presence of martensite-austenite (MA) constituent. Though the phase analysis shows a comparable phase distribution A2 and A3, general acicularity of A3 microstructure is definitely higher and hence corrosion rate for A3 was also higher though marginally. A1 sample is quenched and tempered directly from the hot rolled condition.
(A)
(B)
[image:6.595.348.515.222.487.2](C)
Figure 6. Corresponding threshold image of Steels (B 1), (B 2) & ( B3 )
Though the amount of second phase’s presence in microstructure is lower than A2 and A3, corrosion result shows that it has least corrosion resistance in this particular
condition. This may be due to presence of high density of dislocation in microstructure, which is not possible to reveal in the microscopy made in this work. Incase of alloy B similar phenomenon could be observed in almost all the heat treated condition. Here also B6 shows the most corrosion resistance property compared to other sample. In case of B2 and B3, like alloy A, corrosion results are comparable, B3 showing A marginally lesser corrosion resistance particularly at lower concentration of NaCl. Here also it is found that B1 is the most corrosive in nature and this may also be attributed has to presence of dislocation in the microstructure.
[image:6.595.349.517.230.348.2]
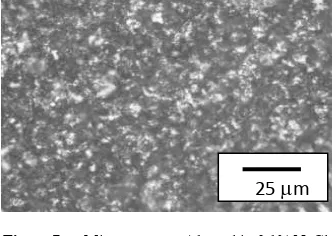
Figure 7. MicrostructureA1 steel in 0.1% NaCl
[image:6.595.91.269.272.686.2]Figure 8. MicrostructureB1 steel in 0.1% NaCl
Table 3. Volume fraction of micro structural phases of steel A and B
Sample Ferrite
Tempere d Bainite
Bainite Pearlite Martensite
A1 70.617 29.382
A2 46.515 53.484
A3 52.485 47.514
A4 26.964 73.035
A5 13.975 86.024
A6 52.255 47.744
B1 43.117 56.882
B2 50.675 49.324
B3 56.561 43.438
B4 23.855 76.144
B5 29.177 70.822
B6 75.220 24.779
It is generally found that alloy B has superior corrosion resistance property than alloy A when compared at any
25 µm
[image:6.595.312.552.517.706.2]particular heat treatment condition. This is probably due to presence of Cr and Cu in alloy B. The steel shows the highest corrosion resistance property. This is due to the presence of equilibrium phases in the microstructure.
All the above microstructure when subjected to image analyzing system and volume fraction of phase present in structure are determined (table 3). While the in the conventionally heat treated A4, A5, A6 and B4, B5, B6 volume fraction of phases of the microstructure maintained its typical behaviour of high % of martensite and/or pearlite in ferrite matrix during water and air cooling, incase of furnace cooling / annealing volume fraction of ferrite is found to be higher due to obvious reason. In case of other microstructures of both steels heat treated at different schedules having multi-phases, primarily reveal the higher percentage of nonequilibrium phases according to rate of cooling. Two major phases, in such cases, are broadly considered for further co-relation with corrosion behaviour.
3.2. Corrosion Characteristic
Typical polarisation plots as shown in Fig no-9 of A2 and B2 in 0.1% NaCl shows that B2 is characterized with a narrow but distinct passive region while in A2 there is no such region. It may be predicted that matrix / grain boundary of A is more reactive than that of B in neutral conditions and that may be due to formation of thicker and stern passive layer (oxide film) in alloy B. This gets disrupted immediately in contact with Cl-. In most of A and B samples 10-fold
decrease is observed when exposed to 0.1% NaCl as shown in Fig 10 (A) & (B). However this decrease is much restricted in case of B2 and B3 samples. With further increase in Cl- ion Rp decrease as usual. A more or less
similar behaviour is reflected with polarization studies.
Figure 9. Polarization plot for Steel A2 and B2 in 0.1% NaCl solution
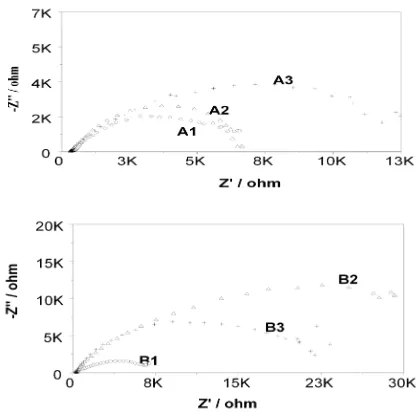
EIS measurement reveals the Nyquist plot as shown in Figure no-11(A) & (B) where the diameter of semicircles represents the circuit resistance of the material. While in pure water (0%NaCl) Nyquist plots as shown in are characterized with two subsequent but overlapping semicircles, in Cl- ions
containing solution only single semicircles are obtained. In neutral pH when EIS represents dual character B samples are more resistant than A samples Rp (B) > Rp (A).
[image:7.595.321.540.215.484.2] [image:7.595.67.292.492.627.2]Such conclusion can be found from tables of corrosion rate. Corrosion current or corrosion rate are much higher for A samples then B ones. Increase in Cl- ion concentration increases the corrosion rate in both samples as shown in Table 4 and 5 .Interestingly enough, in case of B2 and B3 samples corrosion rates are not that significantly accelerated with [Cl-] as in case of A samples. In the contrary, B2, B3 sample exhibits resistant behaviour when polarized in 0.1%, even more than when studied in 0% NaCl .This in fact translates to a dual influence of oxidation kinetics and film repair process in the mild Cl- concentrations.
Figure 10. Polarization plot for Steel A and B in 0.1% NaCl solution
[image:7.595.326.536.520.726.2]3.3. Non-Destructive Characterization
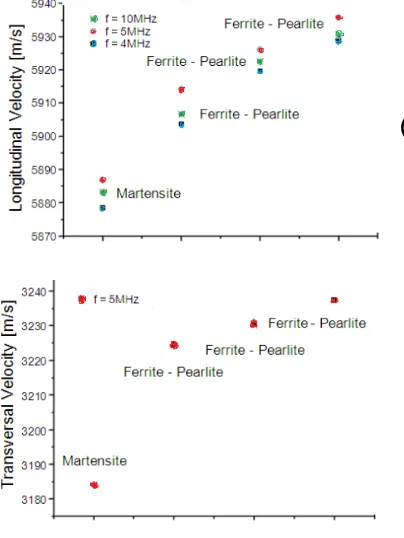
The variation of the longitudinal ultrasonic velocities in frequencies of 5 and 10 MHz, and transversal ultrasonic velocity in frequency of 5 MHz for the samples. According to the obtained results for the longitudinal and transversal ultrasonic velocities’ values, for 5MHz, it can be noted a higher velocity for the ferrite (5930 ± 3 and 3230 ± 1 ) and lower for the martensite (5884 ± 1 and 3180 ± 1.2), being the pearlite (5917 ± 2.5 and 3234 ± 2 ) with an intermediate value as shown Figure no-12 (A) and (B). The lowest ultrasonic velocity verified for martensite can be explained by the great quantity of internal tension it presents, resulting from crystal lattice distortions caused by the increase in volume during the austenite-martensite transformation. Previous studies showed that ultrasonic velocity decreases as the plastic deformation level of the material increases, due to an increase in discrepancy density Ref [18]. According to Gür and Tuncer Ref [19], the ultrasonic velocity in martensite is essentially affected by changes in the modulus of elastic of individual grains, in the crystal lattice distortion level and in the orientation of primary austenite grains. For the materials studied and the frequencies adopted, the ultrasonic measurements show that fine grain sizes led to lower ultrasonic velocity than coarse grain sizes, this was also observed by Albuquerque et al. Ref [20]. However, the opposite behavior was reported by Palanichamy et al. Ref [21]. Microstructure also affects the ultrasonic measurements Ref [22] was given martensite presents high resistance to ultrasound waves, because of its compact and fine granulation.
(A)
(B)
Figure 12. Ultrasonic velocities (VL & VT) values in different phases
3.3.1. Mechanical Properties of Samples
The tensile properties as shown in table no-6 of A2
samples are almost comparable to A1.This may be due to the
presence of some amount of tempered bainite and retain austenite, which improve the strength and ductility in mostly ferrite matrix. Further increase in hardness due to increase in acicularity microstructure. The mechanical properties study of the B2 and B3 reveals a bit of dissimilarity in
characteristics to that of steel sample A1, A2. A considerable
fall in the ductility property of B2 sample due to some
[image:8.595.308.554.267.703.2]amount of retain austenite is not capable of strain–induced transformation. When the steel is continuous cooled a significant improvement in the strength due to increase in acicularity of the microstructure.
Table 4. Corrosion rate (mm/yr) of steels
Steel CR( mm/yr )
0 % NaCl 0.1% NaCl 1% NaCl 3% NaCl
A
A1 0.361 0.539 5.467
-A2 0.107 0.277 2.094
-A3 0.115 0.446 3.441
-A4 - 0.351 2.704 1.076
A5 - 0.247 1.313 1.066
A6 - 0.128 0.619 0.874
B
B1 0.185 0.178 7.207
-B2 0.223 0.146 0.77
-B3 0.362 0.301 0.708
-B4 - 0.316 0.9303 1.826
B5 - 0.282 0.831 1.042
[image:8.595.70.272.456.725.2]B6 - 0.159 0.367 0.881
Table 5. Corrosion current, I corr (A / Cm2 X 105) of steels
S teel Corrosion current, I corr (A / Cm2 X 105 )
0 % NaCl 0.1% NaCl 1%NaCl 3% NaCl
A1 4.7 7 71
-A2 1.4 3.6 27.2
-A3 1.5 5.8 44.7
-A4 - 3.127 9.378 9.589
A5 - 2.207 7.081 9.493
A6 - 1.143 5.518 7.788
B1 2.4 2.3 93.6
-B2 2.9 1.9 10
-B3 4.7 3.9 9.2
-B4 - 2.812 8.288 9.261
B5 - 2.511 7.4 7.848
B6 - 1.418 3.269 0.163
In general, the retained austenite can affect the mechanical properties in several ways:
during water quenching and improve the strength
- Retained austenite inter lath layers could increase the strength by enhancing the ability of lath boundaries to obstacle dislocation movement
[image:9.595.60.295.168.330.2]- Retained austenite could increase the elongation due to the TRIP effect.
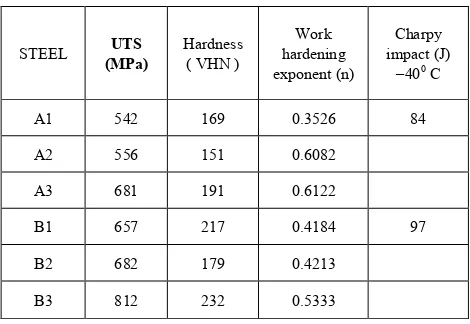
Table 6. Mechanical Properties of TRIP- assisted steels
STEEL (MPa) UTS Hardness ( VHN ) hardening Work exponent (n)
Charpy impact (J)
–400 C
A1 542 169 0.3526 84
A2 556 151 0.6082
A3 681 191 0.6122
B1 657 217 0.4184 97
B2 682 179 0.4213
B3 812 232 0.5333
4. Conclusions
Localized corrosion is a serious problem of TRIP assisted steels when they are exposed to chloride solutions. As high-energy r e g i o n s are prone to corrosion, microstructure having finer grains boundaries have less corrosion resistance. Microstructure contains more low temperature transformation products like bainite and/or martensite and other no equilibrium are more corrosion.
Steel containing more Cu, Ni and Cr is less corrosive compared to other steels having same processing or micro-structure. Steels in rolled condition are more corrosive in both the case, probably due to high dislocation density. The retained austenite in non-Niobium steel is more stable, the non-Niobium steel has shown the optimum combination of mechanical properties. The rate or icorr increases and Rp decreases with increasing Cl− ions in
solution up to a threshold value beyond which the corrosion rate starts to decrease. For Nb-containing TRIP steel, the critical Cl− concentration is lesser than its value for the
Nb-free sample. This indicates that Nb micro-alloyed in the TRIP steel favors the formation of oxide films with better insulating character.
The highest ultrasound propagation velocity was observed for ferrite, then for pearlite and finally for martensite, both for longitudinal and transverse waves. Microstructure contains more low temperature transformation products like bainite and/or martensite and other non equilibrium are more corrosion. This behavior was observed in all frequencies used. Ultrasound velocity is mainly affected by the changes in the elastic module of the individual grains that is dependent upon the degree of lattice distortion and disorientation in the prior austenite grains.
For the analyzed steels, the ultrasonic velocity, either longitudinal or transverse waves, increased from the hardest stage (martensite) to the softest stage (ferrite) in all frequencies, while the opposite happened in ultrasonic attenuation.
Acknowledgements
The results presented in this paper were obtained within the project work of M.Tech thesis in School of materials science and engineering, BESU, shibpur, west Bengal. The authors would like to thank Head & Director (Ex), Prof.N.R.Bandhyopadhyay with all the faculty members of school of materials science and engineering and Prof.(Dr.) Jayati Datta ,dept. of chemistry, BESU, Shibpur,West Bengal, India for fruitful help for this project. The ndt project part of this work was done in sponsored project work in IIT, kharagpur as a senior research fellow under Dr.Rahul Mitra, dept of metallurgical and materials engg. I would like to thanks to Prof. (Dr.) K.K.Roy, IIT, kharagpur, dept of metallurgical and materials engg for special help to do this project work sponsored by DRDL, Hyderabad. India. The author (AT) expresses his gratitude to DRDL, Hyderabad for the award of a senior research fellowship in HTA project, IIT, Kharagpur.
REFERENCES
[1] G.Frommeyerand,O.Grassel:HighstrengthTRIP/TWIPsuperp lasticsteels:Development,properties,Application,LaRevueDe, MetallurgieCIT,october,1998,1299
[2] Ultra light steel auto body-advanced vehicle technology (ULSAB-AVC)overviewreport,IISI,2002,p.66,www.worldau toteel.org.
[3] V.F. ZACKAY, E.R.PARKER, D. FAHR AND R. BUSCH: Trans. ASM, 60 (1967), p. 252
[4] Krüger L, Meyer LW, Brüx U, Frommeyer G & Grässel O Stress-deformation behaviour of high manganese (Al, Si) TRIP and TWIP steels. J Phys IV 110: 189-194(2003). [5] Frommeyer G, Brüx U & Neumann P (2003) Supra-Ductile
and High-Strength Manganese-TRIP/TWIP Steels for High Energy Absorption Purposes. ISIJ Int 43:438-446.
[6] Han YS & Hong SH (1997) The effect of Al on mechanical properties and microstructures of Fe32Mn-12Cr-xAl-0.4C cryogenic alloys. Mater Sci Eng A 222:76-83.
[7] Matsumura, O., Sakuma, Y. and Takechi, H.Transactions of the Iron and Steel Institute 27 (1987) 570.
[8] J. R. Challande (M. S. Thesis) UCRL-18475, (1968). [9] F.J.Padilla(M.S.Thesis) UCRL-19678, (1970).P.J. JAQUES,
J. LADRIERE, F. DELANNAY, Metall.Trans.32A, (2001); p.2759.
10.1108/000355907107486441
[11] Chen Y.Y., Tzeng H.J., Wei L.I., Shih H.C. (2005): Mechanical properties and corrosion resistance of low-alloy steels in atmospheric conditions containing chloride, Materials Science & Engineering A, 398, pp. 47-59.doi:10.1016/j.msea.2005.02.064
[12] Turnball A., Zhou S. (2008): Impact of temperature excursion on stress corrosion cracking of stainless steels in chloride solution, Corrosion Science, Vol. 50, pp. 913-917. doi:10.1016/j.corsci.2008.01.020
[13] Sadhukhan S., Das K. P., Bandyopadhyay N. R. and Banerjee M. K. Journal of the Institution of Engineers, India, 82 (2001) 65.(6).Bhadeshia, H. K. D. H. and Honeycombe, R. W. K. Steels: Microstructure and Properties, Elsevier, UK, (2006) [14] Takechi,H.,Matsumura,O.,Sakuma,Y.Japan Kokai Tokyo
KohoJapan Patent 62,188,729 (1987)
[15] Matsumura, O., Sakuma, Y. and Takechi, H. Transactions of the Iron and Steel Institute 27 (1987) 570
[16] Kim, S. A. and Johnson, W. L., 2007, “Elastic constants and internal friction of martensitic steel, ferritic-pearlitic steel,and
α-iron”, Material Science and Engineering A, 452-453, pp 633-639.
[17] Hakan, C.G.andOrkun, B.T., 2005, “Characterization of micro structural phases of steels by sound velocity measurement’, Materials Characterization Vol. 55, pp. 160-166.
[18] R. Prasad, S. Kumar, Journal of Materials Processing and Technology. 42 (1994) 51-59.
[19] C.H. Gür, B.O. Tuncer, Materials Characterization. 55 (2005) 160-166.
[20] V.H.C. de Albuquerque, T.A.A. Melo, D.F. de Oliveira, R.M. Gomes, J.M.R.S. Tavares, Materials & Design, DOI: 10.1016/j.matdes.2010.02.010
[21] P. Palanichamy, A. Joseph, T. Jayakumar, Baldev Raj, NDT & E International. 28 (1995) 179-185