Application of queuing theory in analyzing the use of production capacity
7
0
0
Full text
(2) International Journal of Integrated Engineering (Issue on Mechanical, Materials and Manufacturing Engineering). . 1. INTRODUCTION Many manufacturing systems can be modeled as a network of queues. When manufacturing systems created, a danger arises that these resources may interfere with one another. For example, if a part must pass through two machines before it is completed, and one of those machines is out of order (down, failed, or other terms) then the other cannot be used. In addition, a production system may have insufficient available capacity to achieve the desired throughput. This happens because of a perfectly good facility forced to wait. Since major field of manufacturing cycle time is due to queuing, evaluating the capacity of production system resources closely related to the issue of estimating manufacturing cycle times. For these reason it is important to study from queuing theory model to measure system performance and optimization facilities to guide the capacity planning decision. The main objective of this study is to apply queuing theory in determining and analyzing the use capacity from the production facilities for a complete production process. The study is also conducted with intention to create an analytical model for the facility that involve in the production flow and see how it affects the performance of the manufacturing system by analyzing the capacity requirements and estimating the manufacturing cycle times. Thereupon the aims of this study are to achieve an appropriate queuing mathematical model and determine the performance measures of the queuing model. The study will be emphasis on the complete production process for the product, which is from an early stage (input) until end product (output). The study will also focus on the related facilities/work station involved in the production flow for selected part/product and attention is given only for discrete part flow. The study will not involve others element that influence the use capacity such as plant layout, human factors/errors, facilities and product design and others. Besides that, this study will only take into account the steady state queuing system since the transient state is far too complex. Some of the expected results for this study are: Being able to establish an analytical model for the production facility which be related to the study.. . Gain the use rate for the workstation as well as total manufacturing cycle time for selected part/product and make improvement suggestions to improve the performance measures. Being able to identify the variable parameters that affect the performance measures or analytical model developed.. 2. RELATED WORK Main interest in the capacity planning is the utilization. Utilization refers to the amount of output of a production facility relative to its capacity. This expression often defined as the proportion of time that the facility is operating relative to the time available under the definition of capacity, and usually the result is expressed as a percentage (%). Utilization is useful measures of performance in a manufacturing plant especially in providing a measure of how well production facilities are being used. If the utilization is low, the facility has not operated nearly to its capacity. Otherwise if utilization is very high (near 100%), it mean that the facilities are being fully utilized. Many authors have described capacity planning methods that are part of traditional manufacturing planning and control systems. Typical objectives include minimizing equipment costs, inventory, and throughput time. These approaches do not consider how the product design affects the manufacturing system performance. Taylor [1] uses a capacity analysis model to determine the maximum production quantity that an electronics assembly facility can be achieved. The analysis has done for a set of existing products and the detailed design of a new product. If the maximum production quantity is insufficient, the product design is changed so that its manufacture avoids a bottleneck resource, which increases the achievable production quantity to an acceptable level. This work does not estimate throughput time. Bermon [2] present a capacity analysis model for a manufacturing line that produces multiple products. His approach does not focused on product design but it is oriented towards decision support and quick analysis. They define available capacity (utilization) as the number of operations that a piece of equipment can perform each day. Given 14.
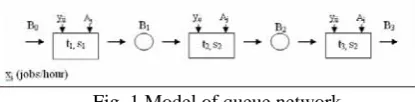
(3) International Journal of Integrated Engineering (Issue on Mechanical, Materials and Manufacturing Engineering). record data (check list) past collected data self timing After all the data are collected, the information is then transferred into the analytic models to get the real picture of the system. This done after the data has been arranged and simplified. In this section, we show how queuing theory can be used to model capacity usage of the production facility systems, in accordance with the ideas depicted in the introduction. This done by presenting an example for such an application: using formulations and methods adopted from queuing theory. A model for a queuing network of arbitrary size and structure is constructed and analyzed. The manufacturing system model requires the following data about the product: the part arrival rate (number of parts per time unit of factory operation), the batch size (number of parts) at order release, and the sequence of workstations that each job must visit. The model also requires the following data for each workstation: the number of identical resources available, the mean job setup time, the mean part processing time, and the normal yield. Given the input data, the analytical model aggregates the part processing times and job setup times to estimate the mean and SCV (squared coefficient of variation) of the job processing times at each workstation. Then, it approximates the manufacturing cycle time at each workstation, the total manufacturing cycle time, the throughput, and the utilization which represent capacity requirement.. information about the equipment available, the products, and the operations required, their approach allocates equipment capacity to satisfy the required throughput and availability constraints. To model the relationship between utilization and queue time, his approach uses a queuing model approximation. Thus, the approach can determine if the manufacturing line has sufficient capacity to meet the required production and achieve reasonable throughput times. 3. METHODOLOGY An important application area of queuing models for this study is production systems with concentration on a product and work centers. Queuing models are particularly useful for this system in terms of capacities and control. There are two methods in conducting the research which are analytical and practical. The primary analytical method applied in this paper is analysis of the modeling, while for practical the approach is through observation. The analysis has been made based on state model method where the related data such as data for product and workstation as well as data for setup and processing time are collected. The state model method is the mathematical analysis of the network of queues, as represent by Fig. 1, where all the feasible states of the Markov chain describing the model are identified, and after the steadystate probabilities are solved for, the various performance measures are calculated. The study will also take consideration on process sequential, types and related processing time of workstation and product involved. Capacity of the production facility is the focus of this study as well as other related data.. 3.1 Yield The cumulative yield is the product of the yields at each station that the product visits.. Yij =. y. ik. (1). kRij. Yi =. Fig. 1 Model of queue network. y. ik. (2). kRi. There are several mechanism of collecting data and information used in conducting the research, which supposedly rely on the environment and situation at the selected plant. There are three major methods to procure the data from the production line according to the desire mechanism and it depends on the situation available in the selected company. The mechanism can be categorized as follow:. xi Aj where: 15. Ti BiYi m jf. m jf m rj. (3) (4).
(4) International Journal of Integrated Engineering (Issue on Mechanical, Materials and Manufacturing Engineering). Yij cumulative yield of product i through Rij. cijs SCV of the setup time. Rij the subsequence that precedes station j. cijt SCV of the part process time. Ri the sequence of stations that the product. Equation (9) and (10) modify the mean and SCV for the process times by adding the effects of resource availability.. i must visit. Yi cumulative yield of product i through Ri y ik yield of product i at station k. t. xi release rate of product i (jobs per hour) Ti desired throughput of product i Bi = job size of product i at release A j resource at station availability of a j. m rj t j. (10). workstation j c SCV of the modified aggregate process * j. time. 3.3 Performance Measures The performance measures of interest are TT j , the average throughput time. 3.2 Process Time The time spent by a job at station j is the sum of the part processing times and the setup time. The job size depends on the cumulative yield of the preceding operations.. t ij BiYij t ij sij 2 ij. ij. j. . iV j. t c. j. (manufacturing cycle time) at each workstation while TTi , the total manufacturing cycle time. Another important quantity is uj, the utilization of the resources at station j. The manufacturing cycle time at each workstation is the sum of the average waiting time in the queue plus the average job processing time. The total manufacturing cycle time is the sum of the workstation manufacturing cycle times.. (5). BiYij t ij2 cijt sij2 cijs. (6). xi t ij. iV j. (7). xi. 1 . . iV j. xi t ij cij 1 2. . iV j. xi. TT j . t ij total process time of product i at station j. TTi . t ij mean part process time of product i at station j t aggregate. . uj. (8). where:. j. (9). Aj. t *j modified aggregate process time at the. station j. 2 j. . where:. station j m rj mean time to repair for a resource at. t . t j. c j c j 2 A j 1 A j . m jf mean time to failure for a resource at. t c. j. process. time. workstation j s ij mean job setup time of. at. t j nj. x. iV j. (11). i. 2 n j 2 1 1 a uj cj cj t j t j (12) 2 n j 1 u j . . TT jRi. . j. (13). Clearly,. the. u j the average resource utilization. product i at. nj . station j c j SCV of the aggregate process time. the number of resources in the. workstation j TTi the total throughput time of jobs of product i * TT j the average throughput time at station j. V j = set of products that visit the workstation. cij SCV of the total process time 16.
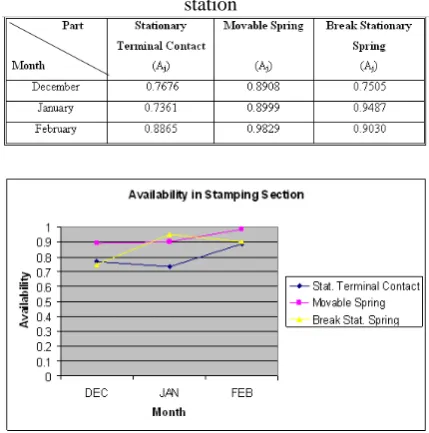
(5) International Journal of Integrated Engineering (Issue on Mechanical, Materials and Manufacturing Engineering). c aj the squared coefficient of variation (SCV). stamping station, riveting station and cutting/bending station. For this paper, only result for stamping station is shown as stated in Table 1 and Fig. 2.. of interarrival times at the resource j 3.4 Sensitivity Analysis This analytical model allows one to evaluate how system performance, average throughput time (cycle time) changes when parameters such as the processing time or arrival rate change.. Mj . 2 n 2 1 uj j 1 a 1 cj cj 2 n j 1 u j . . Table 1: The availability analysis for stamping station. . TT j. (14). t j. Any station j with the utilization uj ≥ 1 has insufficient capacity to achieve the desired production rate of the existing products and the new product. If the sum of TTi is unacceptably large, then consider the stations with the highest utilization uj, throughput time (cycle time) at each station TT j , and. Fig 2 Distribution of availability in stamping section. throughput time multiple M j . The operations. The facility environment of these relay components is a batch manufacturing system. The facility gets their raw material in shape of coil. There are stamping machine tools which capable of forming the required holes and shape. The facility has the riveting machine for the purpose of contact riveting. Apart from that, there are a number of cutting and bending machines which are controlled by three employees. The facility has also two employees to handle the packing and recording process. All inspection station as well as packing station are assumed to be perfectly reliable (Aj=1). The results for desired product throughput and process plans are shown in Table 2 and 3.. that occur at these stations should be examined, and the suggestions are given on how to reduce the processing times at these operations. 4. RESULT AND DISCUSSION There are several data collected from the production line before the analysis conducted. Data collected refer to the requirement of manufacturing model to suit the queuing theory, and they are grouped into each station by part and month. The input is the critical manufacturing process information of the product such as the setup and processing time as well as batch size and yield rate. Availability is defined using two other reliability terms, mean time to failure ( m jf ) and. mean. time. to. repair. ( m rj ).. Table 2: Desired product throughput (January). The. f j. m indicates the average length of time Table 3: Process plans (January). between breakdowns of the resource. The m rj indicates the average time required to service the equipment and put it back into operation when a breakdown occurs. For the purposes of this study, availability analysis has done only on three main stations, which are on 17.
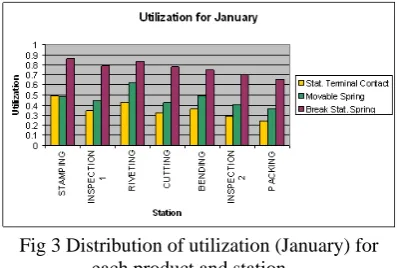
(6) International Journal of Integrated Engineering (Issue on Mechanical, Materials and Manufacturing Engineering). The average resource utilization at each station for product of Stationary Terminal Contact in January is presented in Table 4 and Fig. 3. Since all uj<1, all of the stations have sufficient capacity to achieve the production planned. Table 5 summarizes queuing network model for estimating of the average throughput time at each workstation. The total is 10.299 hours. This table also shows the throughput time multiple for the products. Note that the stamping, cutting and bending have the largest throughput times. Stamping station has the largest throughput time multiple.. Fig. 4 Average throughput time at each station,. TT j Table 5 shows the throughput time multiple for the each product. Note that the stamping has slightly large throughput time multiple although the utilization for the station is less than 1, which mean this station is considered to have enough capacity to fulfill the master production schedule for the existing products. However processing time for stations with slightly higher throughput time multiple Mj, as stamping station, should be considered because this indicates the stations need more accurately in respect to throughput time estimating.. Fig 3 Distribution of utilization (January) for each product and station Table 4: Resource utilization (January). Table 5: Throughput time estimate (January). Fig. 5 Average throughput time of jobs, TTi for each product. Possible improvements for these workstations are by changing the present workstation into parallel server (machine) or M/M/2 queuing system. Further analysis and complete materials on M/M/2 queue are available from Gross and Harris [3]. This method is believed to able to reduce the workin progress inventory stored in storage buffer. Another advantage of this solution is capable to improve the queuing stability. Another way of improvement is by obtaining the optimal productivity. This approach is accomplished by assigned work force at the workstation to job specialization. In addition, for better control, detailed working procedure at each sub station need to be created and implemented. Beside fully utilized the machine is available, another. Fig. 4 shows the throughput time at each workstation while Fig. 5 shows the throughput time of jobs. Based on these figures we can conclude that Break Stationary Spring has a higher throughput time compared to the others. This happens because of batch size quantity is big enough in respect to its desired throughput. These parameters should be examined in order to reduce the throughput time. 18.
(7) International Journal of Integrated Engineering (Issue on Mechanical, Materials and Manufacturing Engineering). advantage is production time can be shortened by learning curve effect due to repetition.. REFERENCES [1] D.G. Taylor, J.R. English, and R.J. Graves, “Designing new products: Compatibility with existing product facilities and anticipated product mix,” Integrated Manufacturing System, vol. 5, no. 4/5, 1994, pp.13-21. [2] S.Bermon, G. Feigin, and S. Hood, “Capacity analysis of complex manufacturing facilities,” Proceedings of the 34th Conference on Decision and Control, New Orleans, Lousiana, 1995, pp.1935-1940. [3] D. Gross and C.M. Harris, Fundamental of queuing theory, 3rd edition, Wiley InterScience, 1998, pp.1-10. [4] M.P. Groover, Automation, production system and computer integrated manufacturing, Wiley & Sons, 2001. [5] J.G. Shantikumar and J.A. Buzacott, “Open queuing network models of dynamic job shops,” International Journal of Production Research, vol. 19, 1981, pp.255-266. [6] J.R. Jackson, “Jobshop like queuing systems,” Management Science, vol. 10, 1963, pp.131-142. [7] H.T. Papadopolous, C. Heavey, and J. Browne, Queuing theory in manufacturing systems analysis and design, Chapman and Hall, London, 1993. [8] D.G. Rendall, “Stochastic process occurring in the theory of queues and their analysis by the method of imbedded Markov chain.,” Annual mathematic statistic, 1953, pp.338-354. [9] D.H. Dshalalow, Advances in queuing: Theory, methods, and open problem, CRC Press, 1995. [10] S.B. Gershwin, Manufacturing systems engineering, Prentice Hall, 1994.. 5. CONCLUSION The study has shown that queuing theory is able to be applied to analyze production system comprehensively. The capability of the theory to provide system design guidelines, capacity analysis and estimating throughput times make it more effective for process planner in planning their production schedule and future improvement. Apart from that performing this approach early in the product development process can reduce product development time. Estimating the capacity analysis and manufacturing cycle time early helps reduce the total product development time as well as time to market by avoiding redesigning later in the process. By using queuing theory approach, the product development team can evaluate each product and facilities implicated by comparing its manufacturing requirements to available capacity and estimating manufacturing cycle time. This study has developed decision support tools that perform queuing theory analysis in particular case study being conducted. This tool employs an approximate queuing network model that estimates the throughput and calculates the capacity requirement. This tool is capable to quickly evaluate changes of the manufacturing system. However, this study has also some extend of limitation. The result of this study has established based only on steady state data, while the actual production environment was mixture of both transient stage and steady state. Actual transient production system is far too complex and difficult to determine. Future works or studies are needed by adding simulation or computational effort so that the system is able to be modeled perfectly. Queuing theory and simulation are believed to work hand-in-glove to uncover and smooth out some of the rough spots in a productive.. 19.
(8)
Figure
Related documents
In the business context, innovation and the innovativeness of organisation determines the business growth. A firm that constantly creates and adapts innovation can gain their
This study is a systematic review and meta- analysis that was performed in clinical trial about the effect of vitamin D copmpared with placebo on CD4 count of
Radial endobronchial ultrasound in diagnosing peripheral lung lesions in a high tuberculosis setting
The aim of this study was to assess the diagnostic utility of radial EBUS with guide sheath in the diagnosis of peripheral lung lesions in Singapore, a high TB incidence
Therefore the aim of this observational study was to assess the utility of the MYMOP2 and W-BQ12 health outcomes measures for measuring clinical change asso- ciated with a course
This report describes a successful pregnancy and full- term delivery of an infant in a dialysis patient using mainly ANP and BNP, instead of X-ray examination, to determine DW..
The brief interviews with the parents of the 20 students asked them if and what their children had said at home about the school garden and if the experience of gardening
The National School of Government will be an important enabler to the implementation of human resource development/training policy in the Public Service through the provision
İlerleme hızı ilk deney grubundan daha yüksek olduğu için ve iş mili devir sayısının düşük olduğundan dolayı dalma anındaki pikler, birinci deney grubumuzda ki gibi
