Journal of Chemical and Pharmaceutical Research, 2012, 4(1):38-45
Research Article
CODEN(USA) : JCPRC5
ISSN : 0975-7384
Removal of Basic Green Dye from Aqueous Media by using
Eucalyptus globules Bark Carbon as an adsorbent-A comparative study
N. Kannan
1and R. Pagutharivalan
21
Centre for Research and Post-Graduate studies in Chemistry, Ayya Nadar Janaki Ammal
College (Autonomous), Sivakasi, Tamil Nadu, India
2
Department of Chemistry, H. H. The Rajah's College, Pudukkottai,Tamil Nadu, India
_____________________________________________________________________________________________
ABSTRACT
Removal of Malachite Green (MG) in aqueous solution on Eucalyptus Globules Bark Carbon (EGBC) has been studied. The effect of various experimental parameters has been investigated using a Batch Adsorption Technique (BAT) to obtain information on treating effluents from the dye industry. The extent of dye removal increased with decrease in the initial concentration of the dye and increased with increase in contact time, amount of adsorbent used and the initial pH of the dye solution. Adsorption data were modeled using the Freundlich and Langmuir adsorption isotherms and first order kinetic equations. The kinetics of adsorption was found to be first order with regard to intra-particle diffusion as the rate determining step. The adsorption capacity of dye has been compared with CAC. These results indicate that EGBC is one of the best adsorbent that can be used in wastewater treatment for the removal of colors and dyes.
Keywords: Adsorption of Malachite Green, Batch Adsorption technique, Eucalyptus Globules Bark Carbon,
adsorption isotherms, Kinetics of adsorption.
INTRODUCTION
Water pollution is a very persistent problem; the intensive disposal of different toxic substance without control constitutes a real danger. Wastewaters from the textile, cosmetics, printing, dyeing, food coloring, paper making, etc., are polluted by dyes. Most of the dyes are stable to biological degradation. Colored waters are often objectionable on aesthetic grounds for drinking and other agricultural purposes. Color affects the nature of water by inhibiting sunlight penetration, thus reducing photo synthetic action. Some dyes are carcinogenic and mutagenic [1,2].Therefore, there is a considerable need to treat such element prior to discharge. Most of the used dyes are stable to photo degradation, Bio-degradation and Oxidizing agent [3,4].Currently, several physical or chemical processes are used to treat dye-laden wastewaters. However, these processes are costly and cannot effectively be used to treat the wide range of dye wastewater. The adsorption process is one of the efficient methods to remove dyes from effluent [5,6].
carbon for color removal has been extensive [9] and effluent treatment systems using activated carbon have been successful. Some works of low cost, non-conventional adsorbents have been carried out which include, agricultural solid waste, Such as Coir pith [10], Banana pith [11],Coconut husk [12], Sawdust [13], Peat moss [14], Paddy straw [15], Nilgiri leaves[16] and industrial solid wastes such as fly ash , coal, Red mud ,Fe (III)/ Cr (III) hydroxide and Copper ion[17]. The objective of this present study is to explore the feasibility of using carbonized Eucalyptus globules bark carbon (EGBC) as an adsorbent for the removal of Malachite Green, which is most widely used in various textile-processing industries by varying parameters like Initial concentration, contact time, dose variation pH and particle size.
EXPERIMENTAL SECTION
Eucalyptus Globules Bark (EGB) were collected locally, washed, dried, cut into small pieces, carbonized (at 300°C)
and steam digested (at 900°C) acid treated and washed. The materials were dried at 120°C for 5 hr in an air oven and then sieved to discrete particle sizes.
Basic Green Dye (Malachite Green, (MG)) supplied by BDH (India) was used as an adsorbate. All the other chemicals used in this study were of reagent grade and obtained commercially. Double distilled water was employed for preparing all the solutions and reagents. Adsorption data of the replicates (with in ± 1%) were reported.
Adsorption Experiments:
Adsorption experiments were carried out literacy method [18],[19]. The various experimental conditions are given in table : 1. The values of percentage removal of dye and amount adsorbed (q in mg g-1) were calculated using the following relationships:
Percentage removal = 100 (Ci – Ce)/Ci (1)
Amount adsorbed (q) = (Ci – Ce)/m (2)
Where Ci and Ce are the initial and equilibrium (final) concentration of dye (in mgL-1), respectively and m is the
mass of adsorbent, in gL-1.
RESULTS AND DISCUSSION
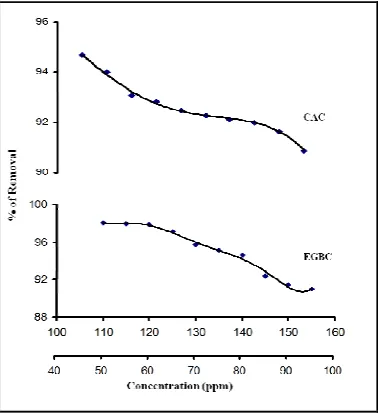
[image:2.595.203.392.497.704.2]The adsorption experiments were carried out at different experimental conditions (Table 1) and the results obtained are discussed below:
Effect of initial concentration:
The effect of initial concentration of dye on the extent of removal of MG (in terms of percentage removal) on EGBC is studied at 30 ± 1°C is given in figure 1 and the relevant data are given in table 1. The percentage removal decreased with the increase in initial concentration of MG. This indicates that there exists a reduction in immediate solute (dye) adsorption, owing to the lack of available active sites required for the high initial concentration of MG. Similar results have been reported in literature on the extent of removal of dyes. Although, the adsorption capacities of low cost carbon (as revealed by Qo values in table 2) is less, but still it could be considered as alternatives to CAC
for the removal of dyes [20].
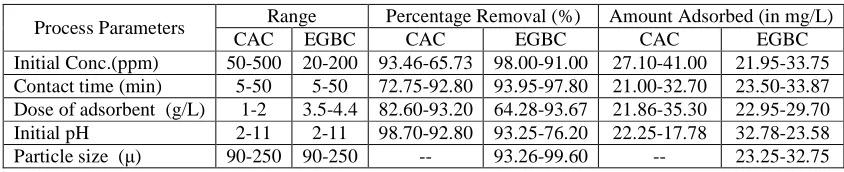
Table 1- Effect of process parameters on the extent of removal of MG by CAC and EGBC at 30 ±1°C
Process Parameters Range Percentage Removal (%) Amount Adsorbed (in mg/L)
CAC EGBC CAC EGBC CAC EGBC
Initial Conc.(ppm) 50-500 20-200 93.46-65.73 98.00-91.00 27.10-41.00 21.95-33.75
Contact time (min) 5-50 5-50 72.75-92.80 93.95-97.80 21.00-32.70 23.50-33.87
Dose of adsorbent (g/L) 1-2 3.5-4.4 82.60-93.20 64.28-93.67 21.86-35.30 22.95-29.70
Initial pH 2-11 2-11 98.70-92.80 93.25-76.20 22.25-17.78 32.78-23.58
Particle size (µ) 90-250 90-250 -- 93.26-99.60 -- 23.25-32.75
Adsorption Isotherms:
In order to determine the adsorption potential, the study of sorption isotherm is essential in selecting an adsorbent for the removal of dyes. [21].The adsorption data were analyzed with the help of Freundlich and Langmuir isotherms.
Freundlich isotherms: log q = log K + (1/n) log Ce (3)
Langmuir isotherms: (Ce/q) = (1/Qob) + (Ce/Qo) (4)
Where, k and 1/n are the measures of adsorption capacity and intensity of adsorption, respectively. q is the amount dye adsorbed per unit mass of adsorbent(in mgg-1) and Ce is the equilibrium concentration of dye(in mgL-1 or ppm);
Qo and b are Langmuir constants, which are the measures of monolayer adsorption capacity(in mgg-1) and surface
energy (in g L-1), respectively. The adsorption data were fitted to these isotherm equations by carrying out correlation analysis and the values of slope (1/n and 1/Qo) and intercept (log K and 1/Qob) were obtained. The
[image:3.595.86.508.227.313.2]adsorption isotherm parameter along with the correlation coefficients is presented in table 2. The observed linear relationships are statistically significant at 95% confidence as evidenced by the r-values (very close to unity), which indicate the applicability of these two adsorption isotherms and the monolayer coverage of adsorbate on adsorbent surface [22].
Table 2. Freundlich and Langmuir parameters of adsorption isotherms for the removal of CR by various adsorbents at 30 ±1°C.
Model Parameters CAC EGBC
Freundlich Isotherm
Slope (1/n) 0.412 0.396
Intercept (log K) 0.675 0.689
Correlation Coefficient (r) 0.996 0.974
Langmuir Isotherm
Slope (1/Q0) 0.042 0.032
Intercept (1/Q0b) 0.285 0.264
Correlation coefficient (r) 0.989 0.938
Qo (mg/g) 35.864 26.789
b (g/L) 2.998 2.0459
RL 0.049 0.034
RL = [1 / (1 + b Ci )] (5)
Where, Ci is the initial concentration of dye (in mg L-1 or in ppm) and b is the Langmuir constant
(in g L-1). The separation factor RL, indicates the shape of the isotherm and nature of the adsorption process as given
below;
RL values Nature of adsorption process
RL > 1 Unfavourable
RL = 1 Linear
0 < RL > 1 Favourable
RL = 0 Irreversible
In the Present study, the computed values of RL (Table 2) were found to be in the range 0-1 indicating that the
adsorption process was favorable for this low cost adsorbent.
Effect of contact time:
The effect of contact time on the amount of dye adsorbed (q, in mg g-1) was studied at the optimum initial concentration of dye (Table1). The amount of MG adsorbed by these carbons increased and reached a constant value with the increase in contact time [23].The decrease in the removal of dye adsorbed after reaching a constant value (in some cases) may be due to the desorption process. The increase in extent of removal of dye after a particular contact time is less and hence it is fixed as the optimum contact time. The adsorbate species normally forms a surface layer, which is only one molecule thick, that is a monolayer on the surface of the adsorbent.
Figure-2 Effect of contact time on the extent removal of MG onto CAC and EGBC.
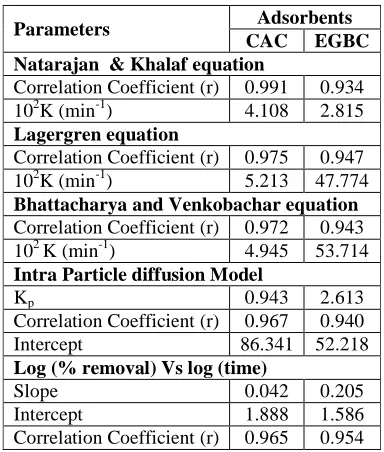
Kinetics of adsorption:
The kinetics of adsorption of MG by EGBC have been studied by applying various first order kinetic equations proposed by Natarajan and Khalaf as cited by [24], Lagergren as cited by [25] and Bhattacharya and Venkobachar[26].
Natarajan and Khalaf equation : log (Ci / Ct) = (k / 2.303) t (6) Lagergren’s equation : log (qe – qt) = log qe – [k/2.303] t (7) Bhattacharya & Venkobachar equation : log[1-U (T) ] = – [k/2.303] t (8)
Where Ci and Ct are the concentration of dye (in mg L-1or ppm), at time zero and at time t respectively; qe and qt are
(Ci – Ce), Ce is equilibrium dye concentration (in ppm) and k and kad are the first order adsorption rate constants (in
min-1). The values of Log (Ci / Ct), Log (qe / qt) and Log (1-U (T)) were correlated with time.
Intra-Particle iffusion model
The adsorbate (MG) species are most probably transported from the bulk of the solution to the solid phase through intra-particle diffusion/transport process, which is often rate limiting step in many adsorption processes, especially in a rapidly stirred batch reactor. The possibility of intra-particle diffusion was explored by using the following equation [27].
qt = kp t½ + C (9)
Where qt is the amount of dye adsorbed (in mg g-1) at time t; C is the intercept and kp is the intra- particle diffusion
rate constant (in mg g-1 min -½). The values of qt were found to be linearly correlated with values of t½, the kp values
[image:5.595.202.394.316.542.2]are calculated and given in table 3. The results indicate the presence of intra- particle diffusion process as rate determining step. The values of intercept (C) give an idea about the boundary layer thickness i.e., the larger the intercept, the greater is the boundary layer effect [28].
Table 3.Kinetics and dynamics of adsorption of MG by adsorption on CAC and EGBC at 30 ±1°C.
Parameters Adsorbents CAC EGBC Natarajan & Khalaf equation
Correlation Coefficient (r) 0.991 0.934
102K (min-1) 4.108 2.815
Lagergren equation
Correlation Coefficient (r) 0.975 0.947
102K (min-1) 5.213 47.774
Bhattacharya and Venkobachar equation
Correlation Coefficient (r) 0.972 0.943
102 K (min-1) 4.945 53.714
Intra Particle diffusion Model
Kp 0.943 2.613
Correlation Coefficient (r) 0.967 0.940
Intercept 86.341 52.218
Log (% removal) Vs log (time)
Slope 0.042 0.205
Intercept 1.888 1.586
Correlation Coefficient (r) 0.965 0.954
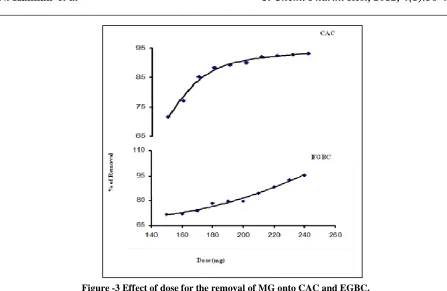
Effect of adsorbent dosage:
Figure. 3 represents the effect of dose of the adsorbent EGBC on the extent removal of MG and the relevant data are given in table 1. The relative extent of removal of MG (in terms of q) is found and 4gL-1 for EGBC, which fixed as the optimum dose of adsorbent. The amount of dye adsorbed was observed to vary exponentially in accordance with a fractional power term of the dose of adsorbent (dose)-n where n = fraction. The plots of log (dose) vs log (% removal) are found to be linear (r ≈ 1.0). This suggests that the adsorbed species / solute may either block the access to the internal pores or cause particles to aggregate and thereby resulting in decrease in the availability of active sites for adsorption [29].
Effect of initial pH:
Figure -3 Effect of dose for the removal of MG onto CAC and EGBC.
Table 4 - Effect of initial pH for removal of MG by CAC and EGBC at 30 ±1°C
S.No Initial pH
Percentage Removal (%) Amount Adsorbed
(in mg/L)
CAC EGBC CAC EGBC
1 2.0 65.89 68.00 24.55 22.90
2 3.0 73.89 73.00 26.35 25.95
3 4.0 75.40 76.33 28.23 28.95
4 5.0 78.25 80.66 31.25 32.02
5 6.0 83.58 84.66 33.56 34.71
6 7.0 87.76 86.00 36.89 36.97
7 8.0 89.56 89.66 38.56 37.25
8 9.0 92.26 92.00 41.23 39.56
9 10 94..36 93.83 42.89 41.98
10 11 97.28 96.00 46..35 43.24
Effect of particle size:
[image:6.595.171.428.408.563.2]Figure-4 Effect of particle size for the removal of MG on EGBC
CONCLUSION
The conclusions derived from the present investigation are the percentage of removal of MG increased with decrease in initial concentration of dye, particle size of EGBC and increases in contact time, dose of adsorbent and initial pH of the dye solution. Adsorption data obeyed Frendlich and Langmuir adsorption isotherms and first order kinetic equations. The intra-particle diffusion is one of the rate determining steps, and prepared EGBC could be employed as adsorbent for the removal of dye / color in general and Malachite Green (MG) in particular.
REFERENCES
[1] G.Mckay. J. Chem.Technol.1982, 32, 759-772.
[2] G.Mckay; M.S. Jamal and J.A. Aga. Water, Air, Soil Pollution.1985 24, 307-322.
[3] V.K Garg; M.Amita; R.Kumar and R. Gupta. Dyes and Pigment. 2004,63, 243-250.
[4] K.R Ramkrishna and T. Viraraghavan. Waste Management.1997, 17, (8): 483-488.
[5] M.Nageswara Rao; Y,Hanumantha Rao; Ch.Chakrapani;Ch.Suresh Babu;B.V.Rajeswara Reddy; P.Haritha and
Kaza Somasekhara Rao. J.Chem.Pharm.Res. 2011, 3(5):363-375.
[6] P.L.Nigam; M. Banat ; D.Singh and R. Muchant. Process Biochemistry.1996, 31, 442.
[7] J.Samusolomon and P.Martin Deva Prasath. J.Chem.Pharm.Res. 2011,3(5):478-490.
[8] P.K.Malik. Dyes and Pigments. 2003, 56, 239-249.
[9] V.J.P.Poots; G.Mckay and J.J. Healy. J. Peat. Water Res. 1976, 10,1061-1066.
[10]R.Yeh and A. Thomas. J. Chem. Biotechnol. 1997, 63, 55-59.
[11]C.Namasivayam, and K. Kadirvelu. Chemosphere. 1997, 34,377-399.
[12]C.Namasivayam; D.Prabha and M.Kumutha. Biores. Technol.1998, 66, 223-228.
[13]K.S.Low and C.K. Lee. Pertanika. 1990, 13, 221-228.
[14]H.M.Asfour; N.M. Nasser; O.A. Fadali and M.S. EL-Geundi. J.Chem. Technol. Biotechnol.1985, 35, 23-34.
[15]S.S.Nawar, and H.S. Doma. Sci. Tot. Environ. 1989,79, 271-279. [16]N.Deo and M. Ali. Indian J. Environ. Prot. 1993, 13, 496-508.
[17] U.V Lathe; S.K.Wankhede; V.T.Patil and P.R.Patil, J.Chem.Pharm.Res. 2011,3(2):670-675
[18]T.Prasad Rao and T.V. Ramakrishna, Analyst,1982,107-704.
[19] N. Kannan. Indian. J. Environ. Protect, 1991,11(7): 514-518.
[20]S.Arivoli; R.Prabkaran; M.Hema and C.Kamatchi, J.Chem. Pharm.Res, 2011, 3(5):532-543.
[21]Dutta, P.K. An overview of textile pollution and its remedy. Indian J. Environ. Pollut.2003,14,443-446. [22]G. Annadurai and M.R.V Krishnan. Indian J. Environ Protect, 1996, 16, 44.
[23]N. Kannan and M. Meenakshisundaram. Water, Air, Soil Poll, 2002,138, 289-305.
70
80
90
100
30
80
130
180
230
280
EGBC
Particle size
(
µ
)
%
o
f
R
em
o
v
a
[24]N. Kannan and S.MurugavelGlobal Nest Journal, 2008,10(3): 395 – 403.
[25]N.Kannan and A.Vanangamudi. Indian J Environ Protect, 1991,11 (4): 241-245.
[26]K.K. Pandy ; G.Prasad andV.N. Singh. Environ Technol Letts, 1986, 7: 547-554.
[27]A.K.Bhattacharya and C.Venkobachar. J Am Civ Engg 1984,110,110-116.
[28]G.Annadurai andM.R.V Krishnan. Indian J Chem Technol, 1997 4, 217-222.
[29]C. Pradeep Sekhar ; S. Kalidhasan; Vidya Rajesh and N. Rajesh. Chemosphere,2009,77, 842–847.
[30]M.K.Purkait. Journal of Hazardous materials, 2007, 145: 287-295.
[31]R.S.Juang;R.L Tseng ;C.Wu andS.H Lee. J chem. Technol Biotechnol,1997,70, 391-99.