2018 International Conference on Computer Science and Software Engineering (CSSE 2018) ISBN: 978-1-60595-555-1
Intrusion Detection of Data Platform Based
on Extreme Learning Machine in Civil
and Military Integration
Tang Liu, Wei Zhou, Jin Song Liu and Chi Lin
ABSTRACT
With the deepening development of military and civilian integration, the explosive growth of internal information is guaranteed and the advantages of big data in ensuring system efficiency are increasingly obvious. However, many hidden dangers are exposed. To solve the problem of ELM, which is overly dependent on the single hidden layer feedforward neural network (SLFN) with many hidden nodes, this paper proposes an SVM-based ELM (SVM-ELM) Intrusion detection algorithm. This algorithm reduces the number of hidden layer nodes significantly and uses SVM weight to optimize the weights and offsets of each node, which improves the decision-making level of nodes and significantly improves the decision performance of ELM. Verification using KDD99 dataset shows that the generalized performance of SLFN with only 5 nodes constructed by SVM-ELM has obvious advantages compared with the original ELM. Compared with other algorithms such as BP, the SVM-ELM algorithm can quickly complete the training and has a higher detection accuracy.
INTRODUCTION
Military and civilian integration is not only the integration of military industry and civilian industry, but also the integration of information flow, logistics, capital
_______ _____________________
LIU Tang, ZHOU Wei, LIU Jin Song, LIN Chi
flow and personnel flow. Since the previous military industry had less network information and less security, as the Internet system information flow. The amount of data explosion, the exponential growth of system data protection difficulty, the protection system needs a more stable protection system and more accurate intrusion detection methods.
DATA PROTECTION CHALLENGES AND DEMANDS BASED ON BIG DATA CIVIL-MILITARY INTEGRATED SECURITY SYSTEM
Based on big data, military and civilian integration ensures that the function of system information system is to maximize the value of data through the data flow, convergence, analysis and application so as to achieve the effect of accurate and effective protection. Therefore, security is one of the fundamental factors to ensure the efficiency of the system. The purpose of data protection is to ensure the orderly flow of data and to preserve the value of using the acquired data. Currently, the major issues facing big data security in the system include storage security for non-relational databases, security for data storage and transaction logs, endpoint validation / filtering, real-time data monitoring based on big data, scalable and combinable privacy protection of data mining and analysis, big data encryption and storage, fine-grained access control, fine-grained auditing, data traceability and other issues.
With the implementation of security monitoring based on big data, as the threats to network security are escalating, the development of intrusion detection technology is becoming more and more urgent. In recent years, scholars at home and abroad have done a lot of research on the application of feature extraction in intrusion detection. At present, common intrusion detection methods are support vector machine (SVM) [1], genetic algorithms and their improved algorithms, etc. These algorithms usually need to take a lot of time or the cost of human intervention. Some common attacks in training data, or avoiding the attacks, are used to reduce the attack on training data. [2] However, some useful information is often lost. The real-time intrusion detection method proposed and others have played a good role in feature extraction. [3] However, the cascading intrusion detection system [4-5] that integrates multiple classifiers improves the algorithm from the classifier, which integrates the advantages of multiple classifiers, but will result in a waste of time and cost, and it does not apply to all types of attacks.
intrusion detection, verifies the effect through experiments, and compares it with the original ELM, BP, SVM and other algorithms.
EXTREME LEARNING MACHINE
Extreme learning machine is a fast learning method of single hidden layer feedforward neural network [7]. The whole learning process is completed once, without iteration, which can achieve extremely fast learning speed. [8]For the N different samples (x yj, j) ,j=1, 2,…,N, the model of SLFN with
T 1 2, ,
j j j jn
x=[x ,x … x ] ∈ n T m
1 2 m
R ,yj=[yj,yj,…,yj ] ∈R , as the hidden layer node as Nand the excitation function as g (x) is
1 1
i i j i i j i j
i i
g x g w x b y
β β
= =
⋅
∑N ( ) =∑N ( + ) = (j=1, 2,…,N), (1)
1, 2, ,
i w wi i …win
w=[ ]Tis the input weight of the node i connected to the hidden
layer.bi is the offset of the i node in the hidden layer.βi β βi1 i2,…,βin
T
=[ , ] is the
output weight of the node i connected to the hidden layer .The excitation
function g (x) can be "Sigmoid", "RBF" or "Sine" and so on.[9]
The above matrix of N equations can be written as Hβ=Y,
1 1 1 1
2 1 2 1
1 1
N N
N N
N N N N N N
g w x b g w x b
g w x b g w x b
g w x b g w x b
× ⋅ ⋅ ⋅ ⋅ ⋅ ⋅ … … … … ( + ) ( + ) ( + ) ( + ) ( + ) ( + ) (2)
1 , 2, , ; 1 2, , ;
T T T T T T T T
N N m
N N m Y y y y
β=[β β … β ] × =[ , … ] ×
His the hidden layer output matrix, the H line i is the output of all the
hidden nodes associated with the input xi.
The ELM algorithm randomly sets the value of the input weight wi and the offset bi, and if the input sample set (x yj, j) ,j=1, 2,…,N is given, then the hidden
layer output matrix H is also fixed.
The purpose of the ELM algorithm is to find the learning parametersβˆ .
1 2 1 2 1 2
1 2 1 2 1 2
ˆ || ( , , , ; , , ..., ; , , ) ||
ˆ min || ( , , , ; , , ..., ; , , ) ||,
N
N N
N
N N
H w w w b b b x x x Y
H w w w b b b x x x Y
β β β … − = … − … … ,
, (3)
The solution obtained from equation (3) is the least-norm solutionβˆ=H Y+ , (4)
Moore-Penrose generalized inverse in which H+ is H.
1 2 1 2 1 2
It can be seen that the ELM solution has the advantages of fast speed and no-iteration.
ELM BASED ON SVM WEIGHTED OPTIMIZATION AND STREAMLINING NODES
ELM randomly set the hidden node weights wi and offset bi method can indeed save system learning time, but need to consume a large number of hidden nodes at the cost. In the condition range, as the number of hidden nodes increases, the learning quality of ELM also gradually increases. However, when the number of hidden nodes is small, the learning outcomes usually obtained will be poor. This situation shows that a sufficient number of nodes are needed to make up for the lack of judgment and learning ability of a single hidden node. If we improve the learning quality of a hidden node, ELM can get better results without using too many hidden nodes, so ELM can be streamlined.
The SVM-ELM streamlines and generalizes the ELM mainly from the following two aspects. First, clarify the hidden layer of responsibility for each node. Instead of tentatively setting the number of nodes required for a hidden layer like the original ELM, the number of nodes needed for a hidden layer is determined according to the classification purpose. Then we use SVM weight to optimize the weight wi and offset bi of each node. To ensure that each node has a better ability to complete the task of generalization.
For the k-type problem, the SVM-ELM classifies the multi-class classification tasks into k sub-class tasks according to the one-to-many principle. [10]The first sub-task distinguishes class i from the remaining k-1 classes. Each
node assumes a classification subtask. Therefore, the number of nodes in the hidden layer only needs to be set as the number of categories k, which is far less than the number of nodes required for other division schemes such as one-to-many and many-to-many.
In order for each node to make its classification generalization work better within its working range, it is necessary to perform corresponding optimization on the linear decision function of each node. The principle of structural risk minimization [11] has become a popular principle of linear function optimization, and SVM is a concrete realization of this principle. Its excellent generalized performance effect has been proved. [12] Therefore, the SVM-ELM performs an optimization operation on the linear decision function of the SLFN hidden layer node according to this principle.
Suppose there are many kinds of data in k categories, that is, the multi-class data set
1 ,
k i i i
s s s =
=∪ is the input vector set of categoryi, where the linear decision
function of node i is ( i) ( i) ,
i j i j i
f x =wiφ x +b in the formula:wi is the weight; bi is the
bias; i j i
x ∈s or i ; ( )
j i
input feature space to the high dimensional feature space;fi( )i is determined by a training set generated by a pair of multiple sample dividing strategies, that is, a training set with si as a positive class and s−si as a negative class. The weight
i
w and offset bi are then determined by solving the following SVM weighted
optimization problem. | | 2 1 1
min || || ;
2
s i
p i i j
j
L w C ξ =
= +
∑
(5)s.t. ( ( ) 1 ( 1, 2, , |s|), 1( ),
1( ), 0 ( 1, 2, , |s|),
i i i i i
j i j i j j j i
i i i
j j i j
y w x b j y x s
y x s s j
φ ξ ξ + ≥ − = = ∈ = − ∈ − ≥ = i )
In the above formula: Ci is the custom punishment parameter, which is used to adjust the balance between training error and separation distance; i
j
ξ is the
relaxation variable; i j
x is the input vector; i j
y is the category label of i j
x .
Its equivalent dual problem is
| | | | | |
1 1 1
1
min ( ) ( ) ;
2
s s s
i i i i i i i
D p q p q p q p
p q p
L y yα α φ x φ x α
= = =
=
∑ ∑
i −∑
s.t.
| |
1
0, 1( ),
1( ), 0 ( 1, 2, , |s|).
s
i i i i
p p p p i
p
i i i
p p i p i
y y x s
y x s s C j
α α = = = ∈ = − ∈ − ≤ ≤ = …
∑
(6) i pα corresponding to a positive Lagrange multiplier i p
x is called a support
vector, and a weight wi can be represented by a support vector set
1
( ),
i s
N i i i i s s s
s
w yα φ x =
=∑ (7)
i s
N in the above formula is the number of support vector i s
x .
The linear decision function of node i is
1
( ) ( ) ( ) .
i s
N i i i i i j s s s i
s
f x yα φ x φ x b =
=∑ i +
(8) Then the other k-1 nodes of the linear decision-making function of a similar optimization, you can get their own weight and bias.
Then get the hidden layer output matrix as
1 2 1 2 1 2 | | 1 2 | | | | ( , , , ; , ,..., ; , , ) [ , , ]T ,
k k k s s s k
H w w … w b b b x x, … x = g g, … g × (9) In the above formula:
1 ( 1 ( 1) 1 , ( k ( 1) k
g =g w iφ x +b) g w iφ x +b),
2 ( 1 ( 2) 1 , ( k ( 2) k
g =g wiφ x +b) g w iφ x +b),
| |s ( 1 ( | |s) 1 , ( k ( | |s) k
g =g wiφ x +b) g w iφ x +b).
Learning parameters
1 1 1 2 1
2 1 2 2 2
1 2
1 2
, , ,
m
m
T T T
k k
k k k m
β β β
β β β
β β β β
β β β
× = … … … … … T k m
Thus, a learning system similar to equation (2) can be established ,
k k
Hβ =Y (11) Its least-norm solution is the ELM solution
ˆ .
k H Yk
β +
= (12)
EXPERIMENT AND RESULT ANALYSIS
The data used in this experiment is data from an intrusion detection system assessment provided by the DARPA at the 1999 KDD contest. The data is all in the format of Tcpdump and Solaris BSM Audit Data, which is based on normal network data but incorporates a variety of intrusion data. Experimental process is divided into two steps: data pre-processing and data division. Data preprocessing includes the classification of the intrusion and the normalization of the data.
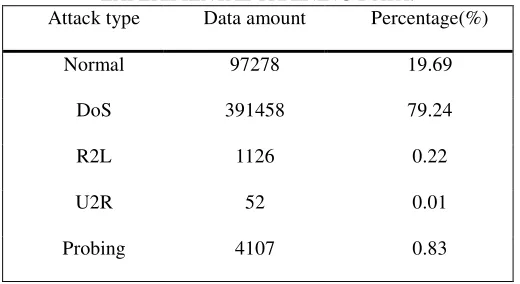
The dataset contains an identification attribute, which indicates the type of intrusion attack. There are 23 types of normal dataset, Normal is the normal network behavior, and the other 22 (Back, Smurf, Neptune, etc.) are intrusion. [13] Map it into five major types, Normal, DoS, R2L, U2R, and Probing. The distribution of different types of attacks in the training data set is shown in Table I.
The training dataset used (Kddcup10per) had a total of 494021 records, of which 97 272 were recorded as Normal, accounting for 19.6%, while 396743 were attack records, accounting for 80.4%. A total of 311029 records of the test data set.
There are 41 characteristic attributes in this dataset, of which 34 characteristic variables are numeric variables, 4 are binary variables and 3 are nominal variables (for attributes and their significance, refer [14]). During the experiment, we found that not all feature attributes are helpful for intrusion detection, and some feature attributes even reduce the resolution. According to the literature [15], attribute reduction is as follows:
The Normal reduction attribute set (26) is{1,3,5,6,7,8,9, 10,14,15,17,20,21,22,23,25,26,27,28,29,33,35,36,38,39,40};
The DoS reduction
attribute(18)is:{1,3,5,6,23,24,25,26,27,28,32,33,35,36,38,39,40,41}; The Probing reduction attribute set(7)is:{3,5,6,23,4,32,33};
The U2R reduction attribute set (8) is:{5,6,8,15,16,18,32,33};
The R2Lreduction attribute set (8) is:{3,5,6,21,22,24,32,33};
In addition, there are 34 numeric attributes in the raw data, but each attribute has a different range of values, so the data needs to be normalized and the numeric attribute normalized to the interval [-1, +1]. The formula that is used to stand the data is :
min( )
alue= ( )
max( ) min( )
i
i i
value f V lower upper lower
f f −
+ − ×
TABLE I. DISTRIBUTION OF DIFFERENT TYPES OF ATTACKS IN EXPERIMENTAL TRAINING DATA.
Attack type Data amount Percentage(%)
Normal 97278 19.69
DoS 391458 79.24
R2L 1126 0.22
U2R 52 0.01
Probing 4107 0.83
In the above formula, after normalization, upper is the upper bound, where +1 is the lower bound, and -1 is the lower bound, where max( )fi and min( )fi denote the maximum and minimum values of the property fi, respectively.
Data division is the original data is divided into training sample set and test sample set. A total of 2800 training data set of data is extracted from the original training data set at random. A total of 2400 training data set of two data, selected from the original training data set at random. There are 2000 data in the test dataset. Probing attack and non-Probing attack are randomly extracted from the original test dataset by a ratio of 2: 3 because Probing attack is relatively small in the original training dataset. There are 1800 data in training dataset 4. R2R attack and non-R2L attack are randomly selected from the original test data according to the ratio of 1: 4, because R2L attack is very small in the original training dataset. There are 1000 data in test dataset V. Since U2R attacks account for a very small proportion of the original training dataset, U2R attack and non-U2R attack are randomly selected from the original test dataset according to the ratio of 1: 9. The test sample set uses a total of 10,000 pieces of data and is randomly extracted from the original test sample set, including 5182 Normal data, 3869 DoS attacks, 276 R2L attacks, 71 U2R attacks and 602 Probing attacks. [16]
When SVM weighted optimization is used to solve the hidden layer node weight wi and bias bi, we choose the radial basis function RBF with better
performance through experiments, in the form of
2 2
|| ||
( , ) exp[ x y ]
K x y
δ
−
= −
, where δ = 5.
Because the detection data contains 5 categories, the number of hidden nodes in extreme learning machine based on SVM weighted optimization is fixed as category number 5. The number of hidden layer nodes required for the original ELM needs to be determined during debugging. Sigmoid, which has a good effect on ELM and SVM-ELM excitation functions, is selected.
lower false alarm rate. However, Table II does not clearly show the superiority of this algorithm. Therefore, Table III compares with BP neural network and SVM intrusion detection algorithm [17]. Meanwhile, Table IV compares with the original ELM, BP neural network and SVM intrusion detection algorithm in. [18]
[image:8.612.169.425.193.307.2]As can be seen from Table III, compared with other algorithms, SVM-ELM algorithm still has a higher detection accuracy, with obvious advantages.
TABLE II. SVM-ELM CLASSIFICATION TEST RESULTS. Attack
type
Check the correct rate(%)
False alarm rate
(%)
Normal 99.03 4.69
DoS 98.45 1.24
R2L 96.73 5.01
U2R 94.52 0.83
Probing 97.97 2.32
TABLE III. COMPARISON OF DETECTION ACCURACY. Attack
type
Detection method(%)
BP SVM SVM-ELM
DoS 95.47 96.11 98.45
R2L 93.02 95.33 96.73
U2R 48.00 64.00 94.52
Probing 91.71 96.57 97.97
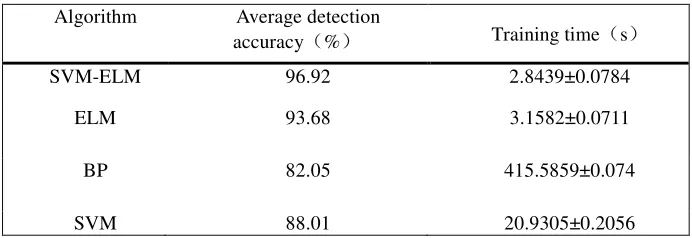
TABLE IV. AVERAGE DETECTION ACCURACY AND TRAINING TIME COMPARISON.
Algorithm Average detection
accuracy(%) Training time(s)
SVM-ELM 96.92 2.8439±0.0784
ELM 93.68 3.1582±0.0711
BP 82.05 415.5859±0.074
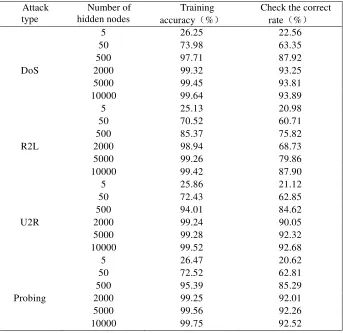
[image:8.612.124.470.507.626.2]TABLE V. ELM CLASSIFICATION PERFORMANCE EXPERIMENT RESULTS. Attack
type
Number of hidden nodes
Training accuracy(%)
Check the correct rate(%)
5 26.25 22.56
50 73.98 63.35
DoS
500 2000 5000
97.71 87.92
99.32 93.25
99.45 93.81
10000 99.64 93.89
5 25.13 20.98
50 70.52 60.71
R2L
500 2000 5000
85.37 75.82
98.94 68.73
99.26 79.86
10000 99.42 87.90
5 25.86 21.12
50 72.43 62.85
U2R
500 2000 5000
94.01 84.62
99.24 90.05
99.28 92.32
10000 99.52 92.68
5 26.47 20.62
50 72.52 62.81
Probing
500 2000 5000
95.39 85.29
99.25 92.01
99.56 92.26
10000 99.75 92.52
As can be seen from Table IV, the mean detection accuracy of SVM-ELM algorithm is as high as 97%, while the average detection accuracy of BP is as low as 82%, and the training time is more than 100 times of SVM-ELM training time. Although the average detection accuracy of SVM is high, its training time is ten times that of SVM-ELM. However, the average detection accuracy and training time of ELM are similar to those of SVM-ELM because the SVM-ELM algorithm is based on ELM, so there is not much difference between the accuracy of ELM and the mean detection accuracy of algorithm classification From the hidden nodes and other attributes, the superiority of SVM-ELM is very obvious.
For the original ELM, 5,50,500 hidden nodes were selected in turn for performance observation during commissioning. The experimental results of the original ELM are shown in Table V.
network size has a great relationship, if you want to achieve better learning results, you must have enough hidden nodes to support.
Comparison of Table II and Table V shows that SVM-ELM has higher detection accuracy than ELM in all types of attacks. In the DoS category, SVM-ELM has a 4.56% higher detection accuracy than ELM. In the R2L category, SVM-ELM has a 8.83% higher detection accuracy than ELM. In the U 2 L category, SVM-ELM was 1.84% higher than the ELM. In the Probing category, the SVM-ELM has a 5.45% higher detection accuracy than the ELM. ELM needs 2000, 10000, 5000 and 2000 nodes respectively when the detection accuracy of all types of attacks reaches this level of accuracy. However, SVM-ELM only needs 5 nodes, which makes the performance of learning machine surpass that of ELM. This shows that optimization of hidden layer node weights and offsets can effectively improve the generalization performance of ELM. Therefore, it is obvious that the necessity and effectiveness of ELM reduction are obvious.
CONCLUSION
In this paper, aiming at the problems of large amount of data, high security requirements and intrusion detection requirements in civil-military integration, this paper proposes a SVM-based weighted learning limit learning machine based on ELM. By weighted optimization of hidden layer node weights and offsets, The generalization of extreme learning machine performance, but also significantly reduce the number of nodes in hidden layer, improve the computing speed, but also saves the space for storage resources. The experimental results show that compared with other existing algorithms, such as BP, the SVM-ELM algorithm has a high detection accuracy and can quickly complete the training, with obvious superiority and stability. At the same time SVM-ELM can use more than 5 nodes to exceed the generalization performance of the original ELM with thousands of nodes. Therefore, based on the data-based civil-military integration equipment support system construction, it is recommended to implement this method of intrusion detection.
REFERENCES
1. Shi-Jinn Horng, Ming-Yang Su, Yuan- Hsin Chen, et al. A novel intrusion detection system based on hierarchical clustering and support vector machines[J]. Expert Systems with Applications, 2011, 38(1):306-313.
2. Cai Long-zheng, Yu Sheng-sheng, Zhou Jing-li,et al. Anomaly detection model with unlabeled training data[J]. Mini-Micro Systems, 2006, 27(10):1856- 1860.
4. Mrutyunjaya Pandaa, Ajith Abrahamb ,Manas Ranjan Patrac. A Hybrid intelligent approach for network intrusion detection [J]. Procedia Engineering, 2012, 30:1-9.
5. Huwaida Tagelsir Elshousha, Izzeldin Mohamed Osmanb. Alert correlation in collaborative intelligent intrusion detection systems[J]. Applied Soft Computing, 2011, 11(7):4349-4365. 6. Shen Feng-shan, Wang Li-ming, Zhang Jun-ying. Reduced extreme learning machine
employing SVM technique [J]. Journal of Huazhong University of Science and Technology: Natural Science Edition, 2014, 42 (6): 34-38.
7. Huang G B, Zhu Q Y, Siew C K. Extreme learning machine: theory and applications[J]. Neurocomputing, 2006, 70(1):489-501.
8. Kang Song-lin, Liu Le, Liu Chu-chu, et al. Intrusion detection based on multiple layer extreme learning machine[J]. Journal of Computer Applications, 2015, 35 (9): 2513-2518. 9. Deng Wan-yu, Zheng Qing-hua, Chen Lin, et al. Research on extreme learning of neural net
works [J]. Chinese Journal of Computers, 2010, 33 (2): 280-287.
10. Hsu C W, Lin C J. A comparison of methods for multi-class support vector machines[J]. IEEE Transactions on Neural Network, 2002, 13(2):415-425.
11. Burges C J C.A tutorrial on support vector machines[J]. Data Mining and Knowledge Discoery, 1998, 2(2):121-167.
12. Shen Feng-shan, Zhang Jun-ying. Statistical fuzzy weight function used in suppressing noises from FSVM[J]. Journal of Huazhong University of Science and Technology: Natural Science Edition, 2012, 40 (12): 34-38.
13. Qian Quan, Geng Huan-tong, Wang Xu-fa. SVM-based intrusion detection system [J]. Computer Engineering: 2006, 32 (9): 136-138.
14. KDD99.KDD99CupDataset [Z].http://kdd.ics.uci.edu/databases/kddcup99.html, 2011. 15. Zhang Yi-rong, XU Ming, Xiao Shun-ping, et al. An anomaly intrusion detection technique
of support vector machine based on rough set attribute reduction[J] .Computer Science, 2006, 33 (6): 64-67.
16. Huang Xiao-wen, Zhang Chi. Techniques for intrusion detection based on adaptive intuitionistic fuzzy reasoning [J] .journal of Computer Applications, 2010, 30 (5): 1198-1201. 17. Guo Shan-qing, Gao Cong, Yao Jian, et al. An intrusion detection model based on improved
random forests algorithm [J] .Journal of Software, 2005, 16 (8): 1490-1498.