2018 International Conference on Computer, Electronic Information and Communications (CEIC 2018) ISBN: 978-1-60595-557-5
Study on the Space-Time Characteristics of Domestic Terrorist Activities
Based on Social Network Analysis
Xing-xing CHEN
*, Zhao-yang LU
and Yao ZHAO
School of Science, Engineering University of CAPF, Xi’an 710086, P.R. China
*Corresponding author
Keywords: Social network analysis, Terrorist activities, Centrality, Space-time characteristics, Degree.
Abstract. This article focuses on the terrorist attacks, using social network analysis to study domestic terrorist activities. We have collected the text data of recent 30 years of domestic violence and terrorism in the World Terrorist Database legal district authoritative websites. The three elements like event, time and location are extracted for research. We used social network analysis software UCIET to build a multi-networks model of domestic terrorist activities, and adopt the meta-network decomposition method to decompose the multimode network into "time-location, time-incident, incident-location" 2-mode network, and converted it into a 1-mode network through rows and columns. Through the quantitative analysis of the centrality index of each subnetwork, and integrate of the two graphs and geographic information knowledge, we analyzed the characteristics of domestic terrorist activities from different perspectives. The result shows that the domestic terrorist activities clearly show the trend of spreading in large and medium-sized cities, which are vulnerable to the security of border areas, and the frequency of incidents on the timeline is wavy. These characteristics provide some practical significance for the estimate of terrorist activities and the evolution of the security situation.
Introduction
However, there are many researches on the qualitative research of terrorist incidents and the relationship between people in terrorist networks in the domestic. While the study on the space-time characteristics of the terrorist incidents is less. Therefore, this paper takes the domestic terrorist activities as the research background and extracts the space-time characteristics of the incident, time-location, incident-time and incident-location network were constructed by the three elements like incident, time and location respectively, transforms it into a 1-mode network to conduct research, And uses the social network analysis software UNICET to conduct a comprehensive and in-depth analysis of the terrorist activities[10-11].
The Construction of Terrorist Network and Its Related Centrality Index
Establishment of Basic Network Model
Social network is composed of a series of nodes set U and V and the set E of connected edges between nodes, the nodes can be on behalf of the time, incidents, figure and organizations, etc, The edge represents the interrelation between the properties of two connected node, If there is an association between two points, there is a edge[12]. Two types of attribute nodes and edges can form a single subnetwork, and multiple subnetworks can form multiple networks, while the terror network is the space-time characteristics constituted by the three elements like incident, time and location, in which any two elements can construct a class of 2-network, the three elements can generate three different types of 2-mode network. Time and location can constitute time-location infrastructure network, time and incident can constitute time-incident infrastructure networks, incident and location can constitute incident-location infrastructure networks.
The Construction of Transformation Network
When we need to mode and analysis the 2-mode network, groups of different attributes are treated as single-level objects for analysis, and it is important to pay attention to the reasonable explanation of the relationship between different attribute nodes. In order to analyze the space-time characteristics of terrorist activities more accurately and comprehensively, we can convert 2-mode to two 1-mode data or convert it to a 2-part 1-mode matrix, the former transformation is more commonly uesd. Mode selection of 2-mode network transformation is divided into row mode and column mode. The method of transformation is divided into the corresponding product method. This method multiplies each of the rows of factor A with the corresponding entries of factor B respectively, and then sum, the sum is equal to the total number of actors to participate the incident, the size of the sum reflects the importance of the relationship. The time-location base network can be transformed into time-time network or location -location base network by row mode and column mode respectively. If there are no incidents in the same location at different times, the result is 0*0=0; If there is only one time in the same place, the result is 0*1=0; Only when incidents occur in the same place at different points in time, the result is 1*1=1. The connection is generated in the transformed time-time base network.
[image:2.612.167.447.634.723.2]The three 2-mode networks in this paper can be converted into six 1-mode networks, as shown in table 1. By analyzing the 2-mode network and 1-mode network, we can reveal the space-time characteristics of terrorist activities more deeply.
Table 1. The type of 1-mode network transformed by 2-mode network. 2-mode network Transformed network
Centrality Analysis
"Centrality" is one of the research focuses of social network analysis. The centrality of the point measures the importance of the point in the network diagram, which is to measure the individual's rights in the whole network. We usually calculate the"absolute center" of all the points in single figure. In order to compare the centrality of points from different graphs, we need to calculate the "relative centrality" index, namely the absolute centrality index of "standardization". The index of the central degree will be different by different standards, it is generally divided into Degree, Closeness Degree and Betweenness Degree[10].
Degree: The degree center of point A refers to the number of other points connected to point A in the network diagram.
Closeness Degree: The proximity of point A refers to the sum of the shortcut distance between point A and all the other points in the network diagram (the number of lines contained in the shortcut).
Betweenness Degree: The Betweenness Degree of the point measures how much the point controls the interactions between others, The greater betweenness degree indicates that the point is at the core of the network and has greater rights to control other actors in the network more effectively.
Analysis of Space-Time Characteristics of Domestic Terrorist Activities
Data Collection and Processing
[image:3.612.142.468.442.727.2]The data comes from the Global Terrorism Database and the official websites of Internet authoritative media, we have collected 186 terrorist attacks from April 24, 1989, to February 14, 2017. First of all, we extracted the time and location of the terrorist incident, as shown in table 2.The incident is represented by the letter I plus the number, then expressed the time and location of the terrorist incidents and their interactions, in the form of network to constitute the time-space characteristic network of domestic terrorist incidents, as shown in figure 1.
Table 2. Summary of terrorist incidents.
Incident Time Location
I1 On April 24,1989 Ningbo city,zhejiang province I2 On June 26,1989 Shanghai Municipality
I3 On December 26,1989 Beijing
… … …
I174 On December 25,2016 Hanzhong city,Shannxi province I175 On December 28,2016 Xinjiang mo yu county I176 On February 14,2017 Xinjiang pi shan county
Transformation Network Analysis
Time-location Network Analysis
[image:4.612.137.473.164.342.2]Using UCINET to build time-location network map based on the time and location of terrorist incidents, as shown in figure 2. The time node is indicated by a red dot, and the location node is represented by a blue square. The weight of the connection between time and location indicates the number of violent and terrorist incidents that occurred at the location in the year.
Figure 2. Time-Location network diagram. 2-mode Network Analysis
[image:4.612.93.519.509.746.2]Table 3 and 4 show the partial results of the centrality analysis of time-location networks. The higher Degree indicates that the node has greater influence in the network and is more likely to be the core of the network. The time degree of the top five is 2012, 1996, 2008, 2015 and 1994 as showed table 3. The number of violent and terrorist incidents occurred in those years is numerous, and it is extensively affected and. More likely to occur in areas where violent and terrorist incidents are frequent. As shown in table 4, the location degree of the top five is Beijing, Urumqi, Yecheng county, Xi'an and Guangzhou, illustrates these areas prone to violent terrorist incident, and the time span is long, not just confined to within a year or two.
Table 3. Time degree analysis result. Table 4. Location degree analysis result. Degree Closeness Betweenness Average Degree Closeness Average
2014 0.257 0.477 0.263 0.332 Beijing 0.385 0.632 0.509
1996 0.23 0.484 0.233 0.316 Wulumuqishi 0.231 0.606 0.419 2008 0.189 0.443 0.174 0.269 Yechengxian 0.231 0.593 0.412
2015 0.162 0.437 0.138 0.246 Xi`an 0.192 0.614 0.403
1994 0.108 0.443 0.129 0.227 Guangzhou 0.192 0.61 0.401
2001 0.135 0.408 0.118 0.22 Kunming 0.192 0.601 0.397
2013 0.108 0.416 0.082 0.202 Hetian 0.192 0.577 0.385
1997 0.095 0.411 0.093 0.2 Wuhan 0.192 0.573 0.383
1995 0.081 0.419 0.043 0.181 Xinhexian 0.154 0.601 0.378
1992 0.068 0.431 0.025 0.175 Chengdu 0.192 0.555 0.374
1998 0.068 0.392 0.021 0.16 Kashi 0.154 0.581 0.368
1999 0.081 0.348 0.052 0.16 Shachexian 0.154 0.558 0.356
2000 0.054 0.383 0.029 0.155 Shanghai 0.154 0.548 0.351
1993 0.068 0.354 0.03 0.151 Shenzhen 0.154 0.538 0.346
2009 0.068 0.332 0.043 0.148 Pishanxian 0.154 0.521 0.338
2016 0.041 0.358 0.023 0.141 Hetianshi 0.154 0.5 0.327
2012 0.041 0.352 0.021 0.138 Kuchexian 0.115 0.538 0.327
1989 0.041 0.348 0.022 0.137 Yiningshi 0.115 0.528 0.322
Analysis of 1-mode Network Transformed from 2-mode Network
2-mode network generates two 1-mode networks by sharing incident elements. By sharing time elements between location and location, the location-location 1-mode network can be built, the blue square node represents the location, The node size represents the size of the location degree, and the connection between the location and the location represents the sharing time of the two locations, as shown in figure 3.
[image:5.612.196.417.233.542.2]The results are shown in table 5 for the degree analysis of the location-location network transformed from time-place network. It can be seen from the table that the top 5 are Urumqi, Beijing, Shache county, Hetian and Kashi. By comparison with the results in table 4, they can be found that the degree ranking of these sites is relatively high. It shows that the time span of the incidents in these locations is longer.
Table 5. Location-location network analysis result. Degree NrmDegree Share
Wulumuqishi 128 0.062 17.534
Beijing 112 15.342 0.054
Shachexian 93 12.74 0.045
Hetian 88 12.055 0.042
Yechengxian 84 11.507 0.04
Kashi 78 10.685 0.038
Guangzhou 74 10.137 0.036
Shanghai 72 9.863 0.035
Kunming 61 8.356 0.029
[image:5.612.197.415.236.539.2]Xi`an 60 8.219 0.029
Figure 3. Location-location network diagram.
Time-incident Network Analysis
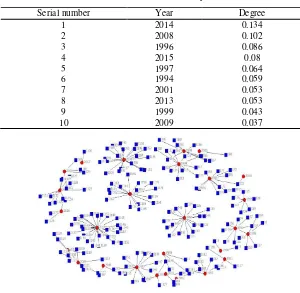
Table 6. Time-incident network analysis result.
Serial number Year Degree
1 2014 0.134
2 2008 0.102
3 1996 0.086
4 2015 0.08
5 1997 0.064
6 1994 0.059
7 2001 0.053
8 2013 0.053
9 1999 0.043
10 2009 0.037
Figure 4. Time-incident network diagram. 2-mode Network Analysis
The degree analysis results of time-incident network are shown in table 6. The table shows the top 10 years of the terrorist incidents number. ranking, combined with the table 3. The years of violent and terrorist incidents mainly focus on around 2000, 2008 and early 2020s (2013, 2014 and 2015). China held the Olympic Games in 2008, in order to get more attention, the terrorist group launched six terrorist activities. Before and after the Olympics, and the terrorist activities happened this year has a very wide range of areas, including west of Xinjiang, northeast Harbin, east of Jinhua, central and south of Kunming. Since 2013, violence and terrorism situation has changed, the expert points out, on June 26, 2013 the violence and terrorism incidents happened in Xinjiang turpan shanshan county broke the conventional, this incident is not happened in the incidentful south Xinjiang, but in east Xinjiang, which is closer to the mainland and there is a tendency to move inland. There are clear signs that the attacked terrorists will make terrorist activities again, and the terrorist operation in the mainland is extremely covert. However, on October 28 that year, Beijing's tiananmen jinshui bridge suffered serious terrorist incident, as well as the serious terrorist activities at the Kunming railway station on March 1, etc. Indicates the tendency of terrorist activities to spread to the mainland city with weak security[13-14].
Analysis of 1-mode Network Transformed from 2-mode Network
Table 7. The results of the degree analysis of the incident-incident network transformed from time-incident network. Degree NrmDegree Share
I133 24.000 12.903 0.012
I134 24.000 12.903 0.012
I135 24.000 12.903 0.012
I136 24.000 12.903 0.012
I137 24.000 12.903 0.012
……
I154 24.000 12.903 0.012
I155 24.000 12.903 0.012
I156 24.000 12.903 0.012
I107 18.000 9.677 0.009
By contrasting the raw data. The highest number of incidents occurred in 2014, Xinjiang accounted for 68%, the south Xinjiang accounted for 82.35%, and mainly concentrated in the southern Xinjiang's Akesu, Kashi and Hetian region.
By sharing incident elements between time and time, we can build time-time 1-mode network. But because few links between incidents, time and time sharing incidents is very limited, single mode of time network diagram is sparse, this analysis did not make much sense, so we don't explain it.
Location-incident Network Analysis
The UCINET software is used to construct the location and incident network diagram based on the location and incident of the terrorist incident, as shown in figure 5. The location node is represented by a blue square, and the incident node is represented by a red dot.
Figure 5. Incident-location network diagram. 2-mode Network Analysis
[image:7.612.151.463.396.552.2]is found that the activities of terrorist organizations mainly focus on Beijing, Urumqi, Akesu, Hetian and Yili.
Figure 6. Incident-location 2-part network diagram.
Analysis of 1-mode Network Transformed from 2-mode Network
[image:8.612.162.452.331.485.2]By sharing incident elements between location and location, the location-location 1-mode network can be constructed and the degree analysis is carried out. The results are shown in table 8.
Table 8. The results of the degree analysis of the location-location network transformed from incident-location network.
Degree NrmDegree Share
Hetianshi 9 12.329 0.132
Kuchexian 7 9.589 0.103
Aketaoxian 7 9.589 0.103
Kashishi 7 9.589 0.103
Shachexian 7 9.589 0.103
Yechengxian 7 9.589 0.103
Shayaxian 7 9.589 0.103
Wulumuqishi 4 5.479 0.059
Xinhexian 2 2.74 0.029
Yiningshi 2 2.74 0.029
Kashi 2 2.74 0.029
Table 8 lists the locations of the first 11 high centers degree. In terms of geography, the scale of the terrorist attacks in these locations is widespread and the damage is greater. In terms of the number of incidents of violence and terrorism, combined with figure 6, the first six digits in table 8 are the first few in the degree of figure 6. In figure 6, the degree of Beijing is relatively high, but in table 6, its degree is ranked low. It can be seen from this that, although there are more incidents of violence and terrorism in Beijing, the scope of the incident is not widespread. However, there are not only a number of incidents of violent and terrorist incidents in Xinjiang, Urumqi, Yecheng, Shache and Kashi, but also the scope of the incident is extremely wide. In terms of the time dimension of violence and terrorism, combined with table 4, the Urumqi, Yecheng and Hetian regions are all in the front in table 4 and table 8. It can be seen that these locations are extremely high in terms of the scope of incidents, the number of incidents and the time dimension of incidents, and become locations where violent and terrorist incidents can easily occur.
terrorist incidents, followed by Urumqi and Yili. Urumqi, Kashi and Yili and other areas prone to terrorist attacks are the economic and cultural center of Xinjiang terrorist organizations are extremely to create terrorist incidents in these areas. Terrorist activities in these areas are aimed at causing panic and a wider range of impacts to achieve the purpose of splitting the motherland.
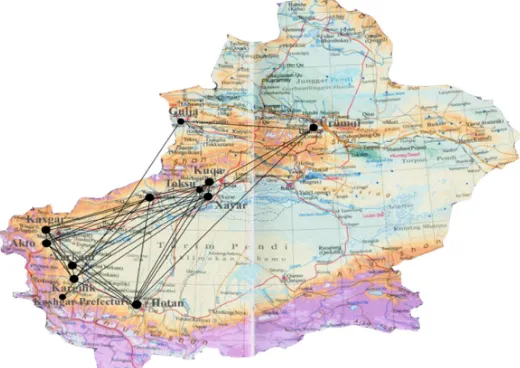
Figure 7. Network distribution map of local terrorist incident-location network transformed into location-location.
Conclusions
The successful application of social network analysis technology in anti-terrorism has aroused the high concern of many scholars. In addition, today's terrorist organizations make full use of information technology to allocate resources and plot violent terrorist incidents, The development of terrorist organizations has also changed from traditional hierarchicalorganization structure to more complex mixed structure, making it more difficult to deal with anti-terrorism operations. This paper has collected the most influential 186 violent and terrorist incidents in China from 1989 to 2017 from the world terrorism database(Global Terrorism Database) and other authoritative media, and extracted the elements of time and space from the incident of violence and terrorism incidents, and established a multi-mode network of "incident-time-place" of domestic violence and terrorism incidents, then extracted the "time-location, time-incident, incident-location" 2- mode network from the multimode network, and transform the 2-mode network into two 1-mode networks by column and row. Using Social Network Analysis software UCINET to conduct quantitative and qualitative analysis of the generated 2-mode network and its transformed 1-mode network. Compared with the analysis results of the single-mode network in the analysis of 2-mode network, the space-time characteristics of terrorist activities can be more fully explored. Finally, combining social network analysis with geographic information, the "location and location" network map was projected into Xinjiang region to generate the distribution of terrorist activities in Xinjiang. It gives us a more intuitive understanding of the geographical distribution of incidents.
From the time of the terrorist incident, the frequency of incidents is fluctuating in time. The most frequent occurrences were in the mid-2020s, this period is also a critical period for the spread of frontier minority areas to the mainland. The second is the 2008 Olympic year, which not only witnessed many incidents of violent and terrorist incidents, but also the extent of the incident was widespread. Finally, the end of the 20th century, the period is the "golden" period for terrorist attacks, From April 4, 1990, there was a major outbreak of terrorist incidents in Akto County, and a series of bombings in 1993 that had been involved in a wide range of activities, and in 1996, 1997 and 1998, all kinds of terrorist incidents occurred in Urumqi, Hetian and Kashi.
incidents focused primarily on the Urumqi, Shache and Yecheng, Hetian region, Xinhe county of Akesu area, Kuche of Akesu area, Yili, and Beijing, Xi'an and other locations in mainland. These areas are not only the hot spots of violence and terrorism, it is also an area with a wider impact range and larger span of terrorist incidents, more incidents span long areas of time, it has become a high-risk area for terrorist organizations to carry out terrorist attacks.
References
[1] Zhao R Y, Wang J. Research of International Social Network Analysis in Frontier Domains in Visualized Information, Documentation, Information & Knowledge, 2011(1):88-94.
[2] Krebs V E. Mapping Networks of Terrorist Cells[J]. Connections, 2001, 24(3): 43-52.
[3] Medina R M. Social Network Analysis: A case study of the Islamist terrorist network[J]. Security Journal, 2014, 27(1):97-121.
[4] Li B X, Li M J, Sun D Y, et al. A Brief Review of Applications of Social Networks Analysis Against Terrorism, Complex Systems and Complexity Science, 2012, 09(2):84-93.
[5] Mainas E D. The analysis of criminal and terrorist organizations as social network structures: a quasi-experimental study.[J]. International Journal of Police Science & Management, 2012, 14:264-282.
[6] Medina R M. Social Network Analysis: A case study of the Islamist terrorist network[J]. Security Journal, 2014, 27(1):97-121.
[7] Fang L, Fang H, Tian Y, et al. The alliance relationship analysis of international terrorist organizations with link prediction[J]. Physica A Statistical Mechanics & Its Applications, 2017, 482.
[8] David J. Caspi, Joshua D. Freilich, Steven M. Chermak. Worst of the bad: Violent white supremacist groups and lethality[J]. Dynamics of Asymmetric Conflict, 2012, 5(1):1-17.
[9] Lindelauf R.H.A, Hamers H.J.M, Husslage B.G.M. Cooperative game theoretic centrality analysis of terrorist networks: The cases of Jemaah Islamiyah and Al Qaeda[J]. Social Science Electronic Publishing, 2011, 229(1):230-238.
[10] Liu J. Lectures on Whole Network Approach: A Practical Guide to UCINET(2nd), Shanghai People’s Publishing House, Shanghai, 2014.
[11] Wu L. Research on Microblog users Based on Social Network Analysis—A Case Study of sina Microblog, Anhui University, Hefei, 2014.
[12] Aggarwal C C. An Introduction to Social Network Data Analytics[J]. Social Network Data Analytics, 2011:1-15.
[13] Yu L Q, Analysis: the new trend of violent terrorist incidents. [2014-5-22]. http://new.qq.com/cmsn/20140522/20140522045688.
[14] Qin T. Counter-Terrorism Situation in the Early 21st Century and China’s Counter-Terrorism Military Force Building, Chinese military science, 2017(1).