UMTRI-2010-26
SEPTEMBER 2010
E
VALUATION OF
2008
FLORIDA
C
RASH
D
ATA
R
EPORTED TO
MCMIS
C
RASH
F
ILE
P
AUL
E.
G
REEN
UMTRI-2010-26
Evaluation of 2008 Florida Crash Data
Reported to the MCMIS Crash File
Paul E. Green Anne Matteson
The University of Michigan Transportation Research Institute
Ann Arbor, MI 48109-2150 U.S.A.
iii
Technical Report Documentation Page
1. Report No.
UMTRI-2010-26
2. Government Accession No. 3. Recipient’s Catalog No.
4. Title and Subtitle
Evaluation of 2008 Florida Crash Data Reported to the MCMIS Crash File
5. Report Date
September 2010
6. Performing Organization Code
7. Author(s)
Green, Paul E., and Matteson, Anne
8. Performing Organization Report No.
UMTRI-2010-26
9. Performing Organization Name and Address
The University of Michigan Transportation Research Institute 2901 Baxter Road
Ann Arbor, Michigan 48109-2150 U.S.A.
10. Work Unit no. (TRAIS)
059778
11. Contract or Grant No.
DTMC75-06-H-00003
12. Sponsoring Agency Name and Address
U.S. Department of Transportation
Federal Motor Carrier Safety Administration 400 Seventh Street, SW
Washington, D.C. 20590
13. Type of Report and Period Covered
Special report
14. Sponsoring Agency Code
15. Supplementary Notes
16. Abstract
This report is part of a series evaluating the data reported to the Motor Carrier Management Information System (MCMIS) Crash File undertaken by the Center for National Truck and Bus Statistics at the University of Michigan Transportation Research Institute. Earlier studies have shown that reporting to the MCMIS Crash File was incomplete. This report examines the factors that are associated with reporting rates for the State of Florida.
MCMIS Crash File records were matched to the Florida Crash file to determine the nature and extent of underreporting. Overall, it appears that Florida is reporting 28.0 percent of crash involvements that should be reported to the MCMIS Crash file. There is some disagreement in vehicle type as determined by VIN decoding and the entry recorded on the police accident report. The reporting rate for truck tractors is 46.7 percent, while the reporting rates for single unit trucks are 6.0, 16.2, and 24.2 percent for trucks with gross vehicle weight ratings in pounds of 10,000-19,5000; 19,501-26,000; and greater than 26,000, respectively. The reporting rate for buses is 5.3 percent.
Fatal crashes are reported at about 86.0 percent, but injured/transported and towed/disabled crashes are reported at about 30.9 and 22.7 percent, respectively. The Highway Patrol has a reporting rate of 85.2 percent, while the reporting rate for police departments is 57.6 percent and for sheriff‘s offices is 60.6 percent.
Missing data rates are low for most variables. There are some inconsistencies between vehicle configuration as coded in the Florida Crash file and the MCMIS file.
17. Key Words
MCMIS, Florida Crash File, accident statistics, underreporting
18. Distribution Statement
Unlimited
19. Security Classification (of this report)
Unclassified
20. Security Classification (of this page)
Unclassified
21. No. of Pages
46
iv
SI* (MODERN METRIC) CONVERSION FACTORS
APPROXIMATE CONVERSIONS TO SI UNITS
Symbol When You Know Multiply By To Find Symbol
LENGTH
in inches 25.4 millimeters mm ft feet 0.305 meters m yd yards 0.914 meters m mi miles 1.61 kilometers km
AREA
in2 square inches 645.2 square millimeters mm2 ft2 square feet 0.093 square meters m2 yd2 square yard 0.836 square meters m2 ac acres 0.405 hectares ha mi2 square miles 2.59 square kilometers km2
VOLUME
fl oz fluid ounces 29.57 milliliters mL gal gallons 3.785 liters L ft3 cubic feet 0.028 cubic meters m3
yd3 cubic yards 0.765 cubic meters m3 NOTE: volumes greater than 1000 L shall be shown in m3
MASS
oz ounces 28.35 grams g lb pounds 0.454 kilograms kg T short tons (2000 lb) 0.907 megagrams (or "metric ton") Mg (or "t")
TEMPERATURE (exact degrees)
o
F Fahrenheit 5 (F-32)/9 Celsius oC or (F-32)/1.8
ILLUMINATION
fc foot-candles 10.76 lux lx fl foot-Lamberts 3.426 candela/m2 cd/m2
FORCE and PRESSURE or STRESS
lbf poundforce 4.45 newtons N lbf/in2 poundforce per square inch 6.89 kilopascals kPa
APPROXIMATE CONVERSIONS FROM SI UNITS
Symbol When You Know Multiply By To Find Symbol
LENGTH
mm millimeters 0.039 inches in m meters 3.28 feet ft m meters 1.09 yards yd km kilometers 0.621 miles mi
AREA
mm2 square millimeters 0.0016 square inches in2
m2 square meters 10.764 square feet ft2 m2 square meters 1.195 square yards yd2
ha hectares 2.47 acres ac km2 square kilometers 0.386 square miles mi2
VOLUME
mL milliliters 0.034 fluid ounces fl oz L liters 0.264 gallons gal m3 cubic meters 35.314 cubic feet ft3
m3 cubic meters 1.307 cubic yards yd3
MASS
g grams 0.035 ounces oz
kg kilograms 2.202 pounds lb Mg (or "t") megagrams (or "metric ton") 1.103 short tons (2000 lb) T
TEMPERATURE (exact degrees)
oC Celsius 1.8C+32 Fahrenheit oF
ILLUMINATION
lx lux 0.0929 foot-candles fc cd/m2 candela/m2 0.2919 foot-Lamberts fl
FORCE and PRESSURE or STRESS
N newtons 0.225 poundforce lbf kPa kilopascals 0.145 poundforce per square inch lbf/in2
v
Table of Contents
1. Introduction ... 1
2. Data Preparation... 2
2.1 MCMIS Crash Data File ... 2
2.2 Florida Police Accident Report File ... 2
3. Matching Process ... 3
4. Identifying Reportable Cases ... 5
4.1 Qualifying Vehicles ... 7
4.2 Crash Severity ... 9
5. Factors Associated with Reporting ... 11
5.1 Overreporting ... 12
5.2 Case Processing ... 12
5.1 Reporting Criteria ... 14
5.2 Reporting Agency and Area... 16
5.3 Fire Occurrence ... 18
6. Data Quality of Reported Cases ... 18
7. Summary and Discussion ... 21
8. References ... 25
Appendix A: Florida Traffic Crash Report (rev. 01/2002) ... 30
vi
List of Tables
Table 1 Steps in MCMIS/Florida PAR File Match, 2008 ... 5
Table 2 Vehicle and Crash Severity Threshold for MCMIS Crash File ... 7
Table 3 Relevant Body Type Codes Derived from Florida PAR file, 2008 ... 8
Table 4 Vehicles Meeting MCMIS Vehicle Criteria Florida PAR File, 2008... 8
Table 5 Crashes Qualifying for Submission to MCMIS According to the Injured and Transported Criteria, Florida PAR file, 2008 ... 10
Table 6 Distribution of Damage Severity, Florida PAR 2008 ... 10
Table 7 Reportable Records in the Florida Crash File, 2008 ... 11
Table 8 Distribution of Non-reportable Vehicles in MCMIS Crash File, 2008 ... 12
Table 9 Reporting Rate by Accident Month in Florida Crash File, 2008 ... 13
Table 10 Reporting Rate by Vehicle Type, Florida 2008 ... 14
Table 11 Reporting Rate by Detailed Vehicle Body Style, Florida 2008 ... 15
Table 12 Reporting Rate by Crash Severity, Florida 2008 ... 16
Table 13 Reporting Rate by Detailed Injury Severity, Florida 2008 ... 16
Table 14 Reporting Rate by County, Florida 2008 ... 17
Table 15 Reporting Rate by Reporting Agency, Florida 2008 ... 17
Table 16 Reporting of Crash Involvements with Fire Occurrence, Florida 2008 ... 18
Table 17 Missing Data Rates for Selected MCMIS Crash File Variables, Florida 2008 ... 18
Table 18 Comparison of Vehicle Configuration in MCMIS File with VIN Derived Vehicle Type in Florida Crash File ... 19
vii
List of Figures
Figure 1 Case Flow in MCMIS/Florida Crash File Match ... 5
Figure 2 Median Latency (in Days, Minus 90) in Reporting to the MCMIS Crash File, Florida Reported Cases, 2008... 13
Evaluation of 2008 Florida Crash Data
Reported to the MCMIS Crash File
1. Introduction
The Motor Carrier Management Information System (MCMIS) Crash file has been developed by the Federal Motor Carrier Safety Administration (FMCSA) to serve as a census file of trucks and buses involved in traffic crashes meeting a specified crash severity threshold. FMCSA maintains the MCMIS file to support its mission to reduce crashes, injuries, and fatalities involving large trucks and buses. Accurate and complete crash data are essential to assess the magnitude and characteristics of motor carrier crashes and to design effective safety measures to prevent such crashes. The usefulness of the MCMIS Crash file depends upon individual states transmitting a standard set of data items on all trucks and buses involved in traffic crashes that meet the crash file severity threshold.
The present report is part of a series of reports that evaluate the completeness and accuracy of the data in the MCMIS Crash file. Previous reports showed underreporting due in large part to problems in interpreting and applying the reporting criteria within the states‘ respective crash reporting systems. The problems often were more severe in large jurisdictions and police
departments. Each state also had issues specific to the nature of its own system. [See references 1 to 38.] The states are responsible for identifying and reporting qualifying crash involvements. Accordingly, improved completeness and accuracy ultimately depends upon the efficiency and effectiveness of individual state systems.
This is the second evaluation of Florida Crash data reported to the MCMIS Crash file. The first report was an evaluation of 2003 data.[5] In that report, the estimated reporting rate was 24.0 percent. In this report, we focus on MCMIS Crash file reporting by Florida in 2008. Between 2003 and 2007, Florida has reported from 4,100 to 6,280 involvements annually to the MCMIS Crash file. Florida is the 4th largest state by population and in most years ranks about 3rd among the states in terms of the number of annual truck and bus fatal involvements. In recent years the number of fatal truck and bus involvements in Florida has ranged from 401 in 2003, 425 in 2004, 462 in 2005, 401 in 2006, to 345 in 2007.[39,40]
Police accident report (PAR) data recorded in Florida‘s statewide files as ofJanuary, 2010 were used in this analysis. The 2008 PAR file contains the crash records for 693,832 vehicles.
The usual method for state evaluations consists of the following steps, which we attempted to pursue here:
1. The complete police accident report file (PAR file hereafter) from Florida was obtained for the most recent year for which we had MCMIS Crash file data, which was 2008. An algorithm was developed, using the data coded in the Florida file, to identify all cases that qualified for reporting to the MCMIS Crash file.
3. Cases that should have been reported, but were not, were compared with those that were reported to identify the sources of underreporting.
4. Cases that did not qualify but which were reported were examined to identify the extent and nature of overreporting.
2. Data Preparation
The Florida PAR file and MCMIS Crash file each required processing before the Florida records in the MCMIS Crash file could be matched to the Florida PAR file. In the case of the MCMIS Crash file, the major tasks were to extract records reported from Florida and to eliminate
duplicate records. The Florida PAR file was reformatted to create a comprehensive vehicle-level file from accident, vehicle, and person data.
The following sections describe the methods used to prepare each file and some of the problems uncovered.
2.1 MCMIS Crash Data File
The 2008 MCMIS Crash file as of June 9, 2009, was used to identify records submitted from Florida. For calendar year 2008 there were 3,860 cases reported to the file from Florida. An analysis file was constructed using all variables in the MCMIS file. This analysis file was
examined for duplicate records (more than one record submitted for the same vehicle in the same crash; i.e., the report number and sequence number were identical). One such duplicate pair was found. Further examination revealed that vehicle configuration, license plate number and VIN were different among the two records. It appears that these are two different vehicles in the same crash that were mistakenly assigned the same sequence number. Therefore, these were not considered duplicate cases.
In addition, records were reviewed to find cases with identical values on accident number, accident date/time, county, city, street, VIN, and driver license number, even though their
vehicle sequence numbers were different. The purpose is to find and eliminate cases where more than one record was submitted for the same vehicle and driver within a given accident. This can happen as records are corrected. No such duplicates were found. The resulting MCMIS file contains 3,860 unique records.
2.2 Florida Police Accident Report File
The Florida PAR data for 2008 obtained from the state was dated January, 2010. The data were stored as nine text files, representing Crash, Vehicle, and Person records. The combined files contained records for 363,205 traffic crashes involving 693,832 vehicles. Data for the PAR file are coded from the Florida Traffic Crash Report, Long form (revision 1/02) completed by police officers and shown in Appendix A.
The PAR file was first examined for duplicate records (involvements where more than one record was submitted for the same vehicle in the same crash). Inspection of case numbers verified that they were recorded in a consistent format, so there was no reason to suspect
77-Florida Reporting to the MCMIS Crash file Page 3
37139, for example). A search for records with identical case numbers and vehicle numbers found five instances of duplicates. In two of the pairs, VIN, vehicle model year, and make were different, so these cases were not considered duplicates. The other three pairs were designated duplicates, as the vehicle-specific variables were identical.
Just as in the preparation of the MCMIS Crash file, cases also were examined to determine if there were any records that contained identical case number, time, place, and vehicle/driver variables, regardless of vehicle number. Two crash records would not be expected to be identical on all variables. Records were examined for duplicate occurrences based on the fields for case number, accident date/time, crash county, city, road, vehicle identification number, and driver date of birth. Based on the above algorithm, 74 duplicate records were found. Upon closer examination, one pair differed on vehicle make, model year, and license plate number. Thus, these two cases were not considered duplicates. In the other pairs, these variables were identical, as well as driver birth date. There were some differences in other variables. However, since the major vehicle and driver variables indicated the same vehicle, we considered these as duplicate records. A total of 37 duplicate cases were removed from the file. The resulting PAR file has 693,795 cases.
3. Matching Process
The next step involved matching records from the Florida PAR file to corresponding records from the MCMIS file. There were 3,860 Florida records from the MCMIS file available for matching, and 693,795 records from the Florida PAR file. All records from the Florida PAR data file were used in the match, even those that did not meet the requirements for reporting to the MCMIS Crash file. This allowed the identification of cases reported to the MCMIS Crash file that did not meet the reporting criteria.
Matching records in the two files is accomplished by using combinations of variables common to the two files that have a high probability of uniquely identifying accidents and specific vehicles within the accidents.
In the Florida data Report Number uniquely identified a crash, and was stored as an 8-digit character field. In the MCMIS Crash file Report Number is stored as a 12-character
alphanumeric value. The report number in the MCMIS Crash file is constructed as follows: The first two columns contain the state abbreviation (FL, in this case), followed by ten digits, where the last two digits represent the crash year (08). Since the PAR Report Number corresponded to the first 8 numeric digits of the MCMIS Report Number, these variables could be used in the match.
Variables in the MCMIS file that distinguish one vehicle from another within the same crash include vehicle license plate number, driver license number, vehicle identification number(VIN), driver date of birth, and driver name. Only vehicle license number, VIN, and driver date of birth were present in the PAR file. Vehicle license number was unrecorded in 9.2% of PAR cases, and in 0.7% of MCMIS cases. VIN was unrecorded 8.7% of the time in the PAR file, but in only 0.2% of MCMIS cases. Driver date of birth was unrecorded in 15.4% of PAR cases and in 2.4% of MCMIS cases.
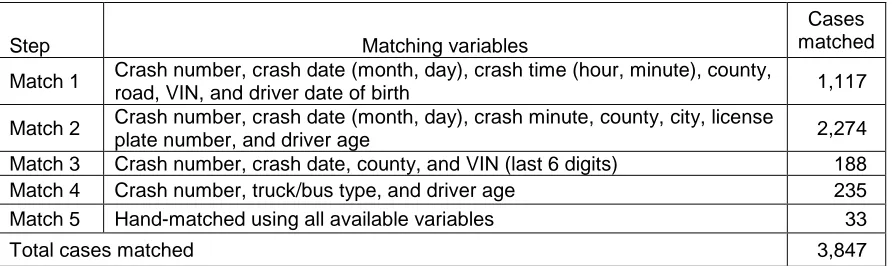
The match was performed in five steps, using the available variables. At each step, records in either file with duplicate values on all the match variables for the particular step were excluded, along with records with missing values for the match variables. The first match included the variables crash number, crash date (month, day), crash time (hour, minute), county, road, vehicle identification number (VIN), and driver date of birth. The second match step dropped hour, since it frequently did not match MCMIS hour, even after conversion to military time. Variables used in the second match included crash number, crash date, crash minute, county, city, license plate number, and driver age. After some experimentation, Match 3 consisted of crash number, crash date, county and the last six digits of the VIN. The variables used in the final attempt at a
computer-based match were crash number, driver age, and a computed variable specifying if the vehicle was a truck, bus, or other vehicle type. The latter variable was created for matching purposes in the PAR and MCMIS datasets with code levels of Truck, Bus, and Other. Matches in the fourth step were also verified by checking that PAR license plate and VIN matched MCMIS license plate and VIN for each pair. If not, then carrier name had to match. For the twelve cases that did not match on these variables, all vehicles in each crash were examined, and a decision was made if the vehicles matched. All were determined to be valid matches. At this point there were still 46 unmatched cases.
The fifth match was a result of two hand matches. The first consisted of crash date, and county. Of all records found, cases were narrowed to those occurring on the same road and in the same city. Then vehicles were examined for like characteristics. Using this method, ten additional records were matched. The second attempt searched for each MCMIS crash number in the PAR file, and vehicles were inspected for a matching case. An additional 23 cases were matched in this manner. In total, these hand-match attempts yielded an additional 33 matches.
Florida Reporting to the MCMIS Crash file Page 5
Table 1 Steps in MCMIS/Florida PAR File Match, 2008
Step Matching variables
Cases matched
Match 1 Crash number, crash date (month, day), crash time (hour, minute), county,
road, VIN, and driver date of birth 1,117
Match 2 Crash number, crash date (month, day), crash minute, county, city, license
plate number, and driver age 2,274
Match 3 Crash number, crash date, county, and VIN (last 6 digits) 188
Match 4 Crash number, truck/bus type, and driver age 235
Match 5 Hand-matched using all available variables 33
Total cases matched 3,847
The matches made were verified using other variables common to the MCMIS and PAR file as a final check to ensure each match was valid. The above procedure resulted in 3,847 matches, representing 99.7 percent of the 3,860 records reported to MCMIS.
Figure 1 Case Flow in MCMIS/Florida Crash File Match
Of the 3,847 matched cases, 3,209 apparently met the MCMIS reporting criteria (reportable), as well as that could be determined using the data supplied, and 638 did not meet the MCMIS reporting criteria (not reportable). The method of identifying cases reportable to the MCMIS Crash file is discussed in the next section.
4. Identifying Reportable Cases
The next step in the evaluation of crash reporting is to identify records in the Florida data that qualify for reporting to the MCMIS Crash file. Records are selected as reportable using the information available in the computerized crash files supplied by the State of Florida. Records that are reportable to the MCMIS Crash file meet criteria specified by the FMCSA. The reporting criteria cover the type of vehicle and the severity of the crash. These criteria are discussed in more detail below, but the point here is that records transmitted to the MCMIS Crash file must be selected from among all the records in the state‘s crash data.
Florida PAR file 693,832 cases
Florida MCMIS file 3,860 reported cases
3,847 matched 13 MCMIS records not
matched 689,948 not matched
Minus 0 duplicates
3,860 unique records Minus 37 duplicates
[image:15.612.112.520.310.480.2]The method developed to identify reportable records is intended to be separate from any prior selection by the state being evaluated. This approach provides an independent method of evaluating the completeness of reporting. Accordingly, we use the information recorded by the officers on the crash report for all crashes.
Some states place some of the data elements intended for the MCMIS Crash file in a special section, with instructions to the reporting officer to complete that information only for vehicles and crashes that meet the MCMIS selection criteria. However, Florida includes these variables on the main crash form. Instructions for completing the Name of Motor Carrier variable, for example, are:
This space must be completed for any self-propelled vehicle – with or without a trailer – being used in commerce to transport cargo, passengers, or any vehicle displaying a hazardous material placard including a van (vehicle type code 02), a light truck with six tires on the ground (vehicle type code 03), a medium truck (vehicle type code 04), a heavy truck (vehicle type code 05), a truck-tractor (vehicle type code 06), a bus designed to transport 9 to 15 passengers (vehicle type code 08), and a bus designed to transport over 15 passengers (vehicle type code 09). [41]
This essentially captures the vehicle criteria for the MCMIS file.
Note: In the Glossary (Appendix A) of the Florida 2008 instruction manual,Commercial Motor Vehicle is defined as: Any self-propelled or towed vehicle used on the public highways in commerce to transport passengers or cargo, if such vehicle:
(a) Has a gross vehicle weight rating of 10,000 pounds or more;
(b) Is designed to transport more than 15 passengers, including the driver; or
(c) Is used in the transportation of materials found to be hazardous for the purposes of the Hazardous Materials Transportation Act, as amended (49 U.S.C. ss. 1801 et seq.).
If the present evaluation of state reporting were limited only to records where those CMV-related data elements had been filled out, it would obviously miss cases that had been missed by the state selection process. Accordingly, the method of identifying reportable cases used in this report attempts to be independent, and relies on variables that describe vehicles and crash
severity to determine if they meet the MCMIS Crash file reporting criteria. This approach should provide the best opportunity to identify any cases that might have been overlooked.
The MCMIS criteria for a reportable crash involving a qualifying vehicle are shown in Table 2. Reportable records must meet both the vehicle type and crash severity criteria. The method used for vehicle criteria and crash severity are each discussed in turn. Identifying qualifying vehicles using the Florida PAR data was accomplished using several variables in combination as
Florida Reporting to the MCMIS Crash file Page 7
Table 2 Vehicle and Crash Severity Threshold for MCMIS Crash File
Vehicle
Truck with GVWR over 10,000 or GCWR over 10,000, or
Bus with seating for at least nine, including the driver, or
Vehicle displaying a hazardous materials placard.
Accident
Fatality, or
Injury transported to a medical facility for immediate medical attention, or
Vehicle towed due to disabling damage.
4.1 Qualifying Vehicles
The first step is to identify vehicles in the Florida Crash file that meet the MCMIS vehicle criteria shown in the upper portion of Table 2. Seven variables were used in combination to identify qualifying vehicles. All variables are recorded on Page 1 of the Florida Traffic Crash Report Form shown in Appendix A. A hierarchy of variables was defined since some are more useful than others when identifying certain medium/heavy trucks and buses. The seven variables and their level of importance in order are shown in the list below.
1. Vehicle Identification Number (VIN)
2. Vehicle Type
3. Vehicle Use
4. Trailer Type
5. Carrier Name
6. DOT/ICC MCC Identification Number
7. Hazmat Placard
The VIN is the primary variable used to identify whether a vehicle is a qualifying truck or bus because it is the most objective source of vehicle type information. David Hetzel of the National Institute for Safety Research (NISR) kindly decoded the VINs for all vehicles in the Florida Crash file. VIN information is recorded except for approximately 9 percent of the 693,795 vehicles in the data file. In addition to the VIN, the Florida PAR data includes vehicle type and vehicle use variables that are coded from the Florida Traffic Crash Report Form.[See the bottom of Page 1 of the Florida Traffic Crash Report in Appendix A for the codes] To a lesser extent, trailer type, carrier name, and DOT/ICC MCC number were used to aid in the identification of vehicles used for commercial use. The hazmat placard variable was used to identify vehicles displaying a hazardous materials placard that were not already identified as qualifying trucks or buses.
MCMIS qualifying vehicles, the interested reader can see Appendix B. In total, 32,789 vehicles were identified as qualifying trucks, buses, or vehicles displaying a hazardous materials placard.
Table 3 Relevant Body Type Codes Derived from Florida PAR file, 2008
Vehicle Type Count Percent
Single Unit Truck 10,000-19,500 lbs 4,091 12.5
Single Unit Truck 19,501-26,000 lbs 2,721 8.3
Single Unit Truck > 26,000 lbs 5,636 17.2
Medium/Heavy Pickup > 10,000 lbs 143 0.4
Step Van 165 0.5
Walk-In Van 17 0.1
Tractor with or without Trailers 13,358 40.7
Cross Country/ Intercity Bus 244 0.7
Other Bus 1,324 4.0
School Bus 2,692 8.2
Transit/Commuter Bus 1,793 5.5
Large Van 271 0.8
Light Pickup with Trailer/ Commercial Use 227 0.7
Non-Truck or Bus with Hazmat Placard 107 0.3
[image:18.612.161.453.136.393.2]Total 32,789 100.0
Table 4 shows the distribution of qualifying vehicles by trucks, buses, and other vehicles
displaying a hazardous materials placard. Medium or heavy trucks accounted for 81.2 percent of the vehicles, while 18.5 percent were buses. Another 0.3 percent were light vehicles with hazmat placards. Qualifying vehicles account for 32,789/693,795 = 4.7 percent of the vehicles in the 2008 Florida PAR file.
Table 4 Vehicles Meeting MCMIS Vehicle Criteria Florida PAR File, 2008
Vehicle Type Count Percent
Trucks 26,629 81.2
Buses 6,053 18.5
Non-trucks with Hazmat Placard 107 0.3
Total 32,789 100.0
[image:18.612.184.428.521.606.2]Florida Reporting to the MCMIS Crash file Page 9
different methods have almost no effect on the resulting reporting rate of reportable involvements by Florida to the MCMIS Crash file, as shown in Appendix C.
4.2 Crash Severity
Having identified vehicles that qualify for reporting to the MCMIS Crash file, the next step is to identify crashes that meet the MCMIS criteria. With respect to crash severity, qualifying crashes include those involving a fatality, an injured person transported for immediate medical attention, or a vehicle towed from the scene due to disabling damage. Florida classifies injury using the common KABCN scale, where injuries are classified as Fatal (K), Incapacitating (A), Non-incapacitating, but evident (B), Possible (C), and No injury. The Florida Crash file includes information about the most severe injury in the crash. A maximum injury in the crash variable was created from the Florida PAR Person file and this variable coincides exactly with the variable already recorded in the Florida data file.
Determining whether an injured person was transported for immediate medical attention is also recorded in the Florida Crash file. There is an Injured Taken To variable in the Crash file indicating whether an injured person was transported to a care facility. It appears this variable is derived according to whether an entry is made in the ―Injured Taken To‖ (facility name) variable on the Florida Crash Report form (Appendix A). A crash was thus determined to meet the
MCMIS injury severity criteria if crash severity was Fatal, or if crash severity was A, B, or C injury, and Injured Taken To was ‗yes‘.
Table 5 shows a cross-tabulation of maximum injury in the crash by whether an injured person was transported to a care facility. In order to qualify as a MCMIS reportable crash, the crash had to meet the strict MCMIS criteria. That is, the crash had to involve a fatality, or an injury
Table 5 Crashes Qualifying for Submission to MCMIS According to the Injured and Transported Criteria, Florida PAR file, 2008
Transported
Maximum Injury in
Crash No Yes Total
MCMIS Qualifying
Fatal 93 236 329 329
Incapacitating 73 1,103 1,176 1,103
Non-incapacitating 691 1,977 2,668 1,977
Possible injury 2,040 1,759 3,799 1,759
No injury 21,273 2,524 23,797 0
Unknown 983 37 1,020 0
Total 25,153 7,636 32,789 5,168
The last MCMIS criterion specifies ―vehicles towed due to disabling damage.‖ On the Florida Traffic Crash Report form (Appendix A), there is space for the investigating officer to record the extent of damage of each vehicle in the accident. According to the manual describing the
instructions for completing the form, there are three categories for assessing damage severity to a vehicle: [41]
1. Disabling damage – vehicle must be towed from the scene of the traffic crash because it is inoperable or is drivable but must be towed from the scene of the traffic crash to prevent additional damage. This does not include a drivable vehicle that is towed from the scene of the traffic crash for any reason.
2. Functional damage – vehicle is operable and is driven away from the scene of the traffic crash in its usual operating manner.
3. No damage – no visible signs of damage.
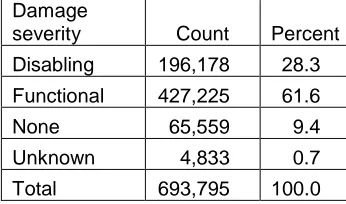
The disabling damage definition matches closely with the MCMIS criterion. Table 6 shows the distribution of damage severity as it is recorded at the vehicle level in the Florida PAR file for all 693,795 vehicles. Approximately 28 percent of all vehicles in the crash file are coded with disabling damage. Other MCMIS evaluations tend to support an estimate of 30 percent for states that record information on the towed and disabled variables.[20,22,27,28] An analysis of the towed variable in the 2009 General Estimates System (GES) database shows that approximately 26 percent of vehicles are towed due to damage.[42]
Table 6 Distribution of Damage Severity, Florida PAR 2008
Damage
severity Count Percent
Disabling 196,178 28.3
Functional 427,225 61.6
None 65,559 9.4
Unknown 4,833 0.7
[image:20.612.218.391.594.696.2]Florida Reporting to the MCMIS Crash file Page 11
Using the definition of disabling damage, a towed and disabled flag variable was created at the crash level to be used for estimating the number of qualifying vehicles satisfying this criterion. As a note, the Florida PAR file contains a crash_damage_severity variable that is coded at the crash level with the same three categories as the damage severity variable. In the 2003 MCMIS evaluation of Florida, however, it was discovered that this variable records the least damaged vehicle in the crash, rather than the most damaged vehicle.[5] Inspection of the 2008 data suggests that the crash_damage_severity variable still records the least damaged vehicle in the crash.
Table 7 shows the numbers of qualifying vehicles that meet the threshold for a MCMIS reportable crash according to the MCMIS criteria. In total, it is estimated that 11,456 vehicles were reportable to the MCMIS Crash file. Of these, 329 were involved in fatal crashes and 4,839, or about 42.2 percent, were involved in crashes where at least one person was injured and
[image:21.612.180.433.321.403.2]transported for medical treatment. Based on the damage severity variable described above, it is estimated that 6,288 or about 54.9 percent of reportable vehicles were involved in crashes where at least one vehicle was towed due to disabling damage.
Table 7 Reportable Records in the Florida Crash File, 2008
Crash type Count Percent
Fatal 329 2.9
Injury transported for treatment 4,839 42.2
Vehicle towed due to damage 6,288 54.9
Total 11,456 100.0
5. Factors Associated with Reporting
The procedure described in the previous section identified 11,456 vehicles involved in crashes as reportable to the MCMIS Crash file. The match process described in Section 3 determined that 3,860 unique cases were reported to the MCMIS Crash file, of which 3,847 could be matched to the Florida PAR data (Figure 1). Of the 3,847 cases that could be matched, 3,209 were
5.1 Overreporting
MCMIS evaluations tend to focus on underreporting because sources of underreporting tend to be more prevalent than overreporting. However, almost all states overreport cases to some degree. Overreporting results when cases are submitted to the MCMIS Crash file that do not meet the criteria for a reportable crash. Since 3,847 MCMIS cases could be matched to the Florida PAR data, and 3,209 were determined to meet the reporting criteria, the difference, or 638 cases, were not reportable, and should not have been reported.
Table 8 shows a two-way classification of vehicle type and crash severity, and provides some explanation as to why these vehicles should not have been reported to the MCMIS Crash file. The majority of vehicles, 411, were qualifying vehicles, but were not involved in a crash serious enough to meet the crash severity threshold. There were also 188 vehicles in crashes in which the crash met the severity test, but the vehicle was not a qualifying truck, bus, or displaying a
[image:22.612.91.522.331.473.2]hazardous material placard. Finally, 39 vehicles were reported that meet neither the crash severity criteria nor the vehicle criteria since they are not trucks, buses, or hazmat placarded vehicles.
Table 8 Distribution of Non-reportable Vehicles in MCMIS Crash File, 2008
Vehicle type
Crash severity
Total Fatal
Transported
injury Towed/disabled
Other crash severity
Truck 0 0 0 387 387
Bus 0 0 0 23 23
Non-truck with
hazmat placard 0 0 0 1 1
Other vehicle not
transporting hazmat 20 86 82 39 227
Total 20 86 82 450 638
5.2 Case Processing
Delays in transmitting cases may partially account for the incompleteness of the MCMIS Crash file. The time lag in extracting and submitting reports to the file might explain some portion of the unreported cases. All reportable crash involvements for a calendar year are required to be transmitted to the MCMIS Crash file within 90 days of the date of the crash. The 2008 MCMIS Crash file as of June 9, 2009 was used to identify records submitted from Florida, so all 2008 cases should have been reported by that date.
Florida Reporting to the MCMIS Crash file Page 13
Table 9 Reporting Rate by Accident Month in Florida Crash File, 2008
Crash month
Reportable cases
Reporting rate
Unreported cases
% of total unreported
cases
January 1,038 33.2 693 8.4
February 1,101 38.6 676 8.2
March 1,158 35.1 752 9.1
April 1,060 29.9 743 9.0
May 1,007 26.8 737 8.9
June 870 19.1 704 8.5
July 921 10.9 821 10.0
August 863 26.5 634 7.7
September 835 25.0 626 7.6
October 903 32.8 607 7.4
November 834 29.0 592 7.2
December 866 23.6 662 8.0
[image:23.612.127.478.454.657.2]Total 11,456 28.0 8,247 100.0
Figure 2 shows the median latency in case submission by month, where latency is the number of days between crash date and the date the case was uploaded to the MCMIS Crash file, minus the 90-day grace period. Therefore, a positive number for a month gives the median number of days cases were submitted after the 90-day grace period. Negative numbers give the median number of days that cases were submitted within the 90-day grace period for a month. Figure 2 shows that among the 3,209 cases reported, Florida tended to report well within the grace period. As shown by the horizontal line, over the entire twelve months, cases were submitted approximately 48 days prior to the end of the grace period. Even in January, which represents the worst month, cases were submitted about 19 days prior to the end of the grace period.
Figure 2 Median Latency (in Days, Minus 90) in Reporting to the MCMIS Crash File,
Florida Reported Cases, 2008
Figure 3 is an empirical cumulative distribution plot that shows the percentage of cases
days shows that more than 90 percent of the cases were uploaded to the MCMIS Crash file within the 90-day grace period. The median time between crash occurrence and record upload was 42 days. Two-thirds were submitted within 53 days, and 99 percent were submitted within 240 days.
Figure 3 Cumulative Percentage of Cases Submitted to MCMIS Crash file by Number of Days After the Crash
5.1 Reporting Criteria
In this subsection, reporting is investigated according to variables in the Florida PAR file related to the reporting criteria for a MCMIS-reportable crash, as outlined in Table 2. Previous studies have consistently shown that trucks are more likely to be reported than buses and that fatal crashes are more likely to be reported than injury involvements. Since the criteria revolve around attributes associated with the vehicle type and crash severity, calculating reporting rates for these two variables is a logical starting point for assessing where improvements can be gained.
[image:24.612.112.502.617.711.2]Table 10 shows reporting rates by vehicle type. The reporting rate for trucks is close to the overall rate since trucks represent the majority of reportable cases. In total, there were 1,616 buses that were reportable to MCMIS, but only 5.3 percent of these buses were reported. Less than 100 buses were reported to the MCMIS Crash file. Finally, only 6 of the 62 reportable non-trucks with a hazmat placard were reported resulting in a reporting rate of less than 10 percent.
Table 10 Reporting Rate by Vehicle Type, Florida 2008
Vehicle type
Reportable cases
Reporting rate
Unreported cases
% of total unreported
cases
Truck 9,778 31.9 6,660 80.8
Bus 1,616 5.3 1,531 18.6
Non-truck with hazmat placard 62 9.7 56 0.7
Florida Reporting to the MCMIS Crash file Page 15
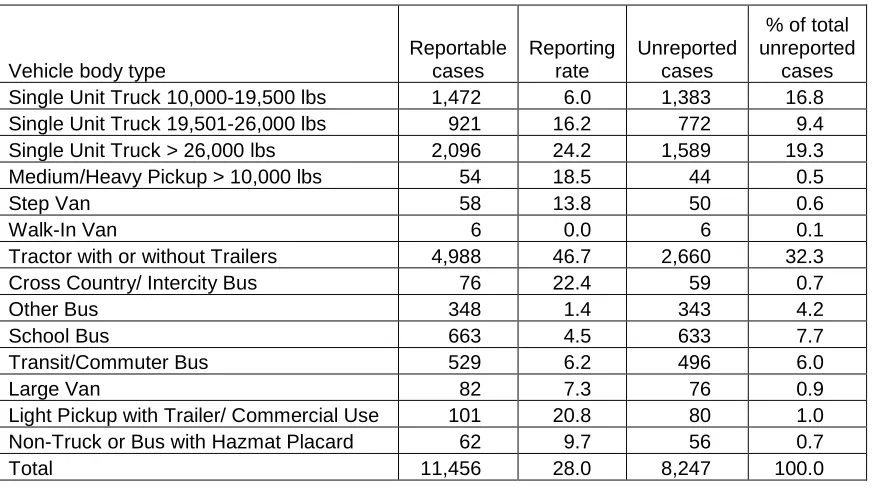
Results from previous MCMIS evaluations suggest that certain trucks such as tractor semitrailers are more likely to be reported than single unit trucks. Table 11 shows reporting rates according to detailed vehicle body type. The body types were derived largely from VIN decoding as
described in Section 4.1. The largest reporting rate is 46.7 for tractors with or without trailers and this vehicle type also accounts for 32.3 percent of the unreported cases. For single unit trucks, the reporting rate increases with GVWR, but the reporting rate for those with GVWR between 10,000 lbs and 19,500 lbs is 6.0 percent, while the reporting rate for those with GVWR greater than 26,000 lbs is 24.2 percent. The total percentage of unreported cases for single unit trucks is 45.5 percent. In general, buses have low reporting rates. The rate for school buses is 4.5 percent, the rate for transit/commuter buses is 6.2 percent, and the rate for other buses is 1.4 percent. The cross country/intercity bus has a rate of 22.4 percent, which is substantially higher than the other three bus types. Overall, buses account for 18.6 percent of the total unreported cases. The
[image:25.612.90.526.292.536.2]remaining body types, such as the light pickup with a trailer that includes supporting data that the truck was used for commercial use, account for a small fraction of the unreported cases.
Table 11 Reporting Rate by Detailed Vehicle Body Style, Florida 2008
Vehicle body type
Reportable cases Reporting rate Unreported cases
% of total unreported
cases
Single Unit Truck 10,000-19,500 lbs 1,472 6.0 1,383 16.8
Single Unit Truck 19,501-26,000 lbs 921 16.2 772 9.4
Single Unit Truck > 26,000 lbs 2,096 24.2 1,589 19.3
Medium/Heavy Pickup > 10,000 lbs 54 18.5 44 0.5
Step Van 58 13.8 50 0.6
Walk-In Van 6 0.0 6 0.1
Tractor with or without Trailers 4,988 46.7 2,660 32.3
Cross Country/ Intercity Bus 76 22.4 59 0.7
Other Bus 348 1.4 343 4.2
School Bus 663 4.5 633 7.7
Transit/Commuter Bus 529 6.2 496 6.0
Large Van 82 7.3 76 0.9
Light Pickup with Trailer/ Commercial Use 101 20.8 80 1.0
Non-Truck or Bus with Hazmat Placard 62 9.7 56 0.7
Total 11,456 28.0 8,247 100.0
Table 12 Reporting Rate by Crash Severity, Florida 2008 Crash severity Reportable cases Reporting rate Unreported cases
% of total unreported
cases
Fatal 329 86.0 46 0.6
Injured/Transported 4,839 30.9 3,342 40.5
Towed/Disabled 6,288 22.7 4,859 58.9
Total 11,456 28.0 8,247 100.0
[image:26.612.140.473.312.451.2]Table 13 shows reporting rates to the MCMIS Crash file by maximum injury severity in the crash. The fatal involvement results are identical to those shown in Table 12. Note the declining trend in reporting rates as injury severity decreases; however, there is a large drop from the fatal category to the other categories. In addition, the percentage of total unreported cases increases as injury severity decreases. Crashes involving no injury account for 44.1 percent of the unreported cases.
Table 13 Reporting Rate by Detailed Injury Severity, Florida 2008
Crash severity Reportable cases Reporting rate Unreported cases
% of total unreported
cases
Fatal 329 86.0 46 0.6
Incapacitating 1,154 34.5 756 9.2
Non-incapacitating 2,416 31.3 1,659 20.1
Possible 2,722 26.9 1,989 24.1
None evident 4,673 22.1 3,641 44.1
Unknown 162 3.7 156 1.9
Total 11,456 28.0 8,247 100.0
5.2 Reporting Agency and Area
Beyond the application of the reporting criteria, there can be differences related to where the crash occurs or the type of agency that covered the crash. More densely populated areas with a large number of traffic accidents may not report as completely as areas with a lower work load. The level and frequency of training or the intensity of supervision can also vary. If there are such differences, they may serve as a guide to focus resources in areas and at levels that will produce the greatest improvement. The next set of tables examines areas of the state to see if there are inconsistencies in reporting patterns.
In the 67 counties of Florida, the number of reportable cases ranges from 3 to 1,539. Therefore, numbers of reportable cases vary considerably based on population density, traffic density, and other geographic characteristics. Table 14 shows the top twenty counties in Florida, ordered in descending order by the number of reportable cases. The combined reporting rates for the top twenty counties and the remaining forty-seven counties are also shown. The top twenty counties have a combined reporting rate of 25.3 percent, smaller than the combined reporting rate of 39.2 percent for the remaining counties. The top twenty counties account for 83.6 percent of
Florida Reporting to the MCMIS Crash file Page 17
[image:27.612.145.468.122.478.2]percent and accounts for 16.4 percent of unreported cases. Broward County has a reporting rate of 19.8 percent and accounts for 10.8 percent of unreported cases.
Table 14 Reporting Rate by County, Florida 2008
County Reportable cases Reporting rate Unreported cases
% of total unreported
cases
Miami-Dade 1,539 12.2 1,352 16.4
Broward 1,108 19.8 889 10.8
Hillsborough 912 28.6 651 7.9
Orange 803 23.4 615 7.5
Duval 774 36.4 492 6.0
Palm Beach 721 26.2 532 6.5
Polk 505 44.8 279 3.4
Pinellas 396 10.1 356 4.3
Pasco 264 27.3 192 2.3
Lee 259 30.9 179 2.2
Volusia 256 30.5 178 2.2
Brevard 242 33.9 160 1.9
Marion 236 30.5 164 2.0
Alachua 211 36.0 135 1.6
Lake 189 38.6 116 1.4
Osceola 182 21.4 143 1.7
Sarasota 170 21.2 134 1.6
Manatee 162 25.9 120 1.5
Escambia 154 24.0 117 1.4
Leon 150 38.7 92 1.1
Top 20 counties 9,233 25.3 6,896 83.6
Other counties 2,223 39.2 1,351 16.4
Total 11,456 28.0 8,247 100.0
It is also possible that reporting rates are related to the level of reporting agency. Here, agency type may be taken as an indicator of the focus and training of the department. Table 15 shows reporting rates by the various agencies in Florida. Most cases are handled by the Highway Patrol and the reporting rate is 33.7 percent. Reporting rates by the remaining agencies, namely county sheriff offices and city police departments are lower at 24.7 percent and 18.0 percent,
respectively.
Table 15 Reporting Rate by Reporting Agency, Florida 2008
Reporting agency Reportable cases Reporting rate Unreported cases
% of total unreported
cases
Highway patrol 6,417 33.7 4,255 51.6
County sheriff 2,103 24.7 1,584 19.2
City police 2,916 18.0 2,392 29.0
Other 20 20.0 16 0.2
[image:27.612.144.474.606.718.2]5.3 Fire Occurrence
[image:28.612.136.475.211.288.2]In the Florida PAR data there are four harmful event variables recorded at the vehicle level and coded in order as first/subsequent events. If fire occurs it can be recorded as one of the harmful events. With respect to the occurrence of fire in reportable crash involvements, there were 46 vehicles in which fire was coded for at least one of the harmful events. Of these, 43 were in trucks and 3 were in buses. About half of the trucks were reported and none of the buses were reported.
Table 16 Reporting of Crash Involvements with Fire Occurrence, Florida 2008
Vehicle type Reportable cases Reporting rate Unreported cases
% of total unreported
cases
Truck 43 51.2 21 87.5
Bus 3 0.0 3 12.5
Total 46 100.0 24 100.0
6. Data Quality of Reported Cases
In this section, we consider the quality of data reported to the MCMIS crash file. Two aspects of data quality are examined. The first is the amount of missing data. Missing data rates affect the usefulness of a data file because records with missing data cannot contribute to an analysis. The second aspect of data quality considered here is the consistency of coding between records as they appear in the Florida Crash file and in the MCMIS Crash file. Inconsistencies may indicate problems in translating information recorded on the crash report to the values in the MCMIS Crash file. All 3,847 matched cases reported to the MCMIS crash file from Florida for 2008 are used, since the purpose of the analysis is to examine the quality of the data as reported.
[image:28.612.127.486.567.725.2]Table 17 shows missing data rates for selected, important variables in the MCMIS Crash file. Missing data rates are generally low, with a handful of exceptions. On most fundamental, structural variables, such as date, time, number of fatalities and number of injuries, missing data rates are either zero or extremely low. Body type is missing for 16.4 percent of the cases. Three of the four event variables are missing large percentages of data, though this is not necessarily an indication of a problem, since most crashes consist of a single impact.
Table 17 Missing Data Rates for Selected MCMIS Crash File Variables, Florida 2008
Variable
Percent
unrecorded Variable
Percent unrecorded
Report number 0.0 Fatal injuries 0.0
Accident year 0.0 Non-fatal injuries 0.0
Accident month 0.0 Interstate 0.0
Accident day 0.0 Light 0.0
Accident hour 0.3 Event one 1.1
Accident minute 0.3 Event two 88.1
County 0.0 Event three 96.9
Body type 16.4 Event four 99.2
Configuration 0.1 Number of vehicles 0.0
GVWR class 2.3 Road access 2.6
Florida Reporting to the MCMIS Crash file Page 19
Variable
Percent
unrecorded Variable
Percent unrecorded
Carrier state 0.0 Road trafficway 2.7
Citation issued 1.3 Towaway 0.0
Driver date of birth 2.0 Truck or bus 0.0
Driver license number 2.8 Vehicle license number 1.9
Driver license state 1.9 Vehicle license state 0.7
Driver license class 3.7 VIN 0.2
Driver license valid 1.3 Weather 0.0
* Based on cases where the carrier is coded interstate.
Hazardous materials variable
Percent unrecorded
Hazardous materials placard 0.9
Percentages of hazmat placarded vehicles only:
Hazardous cargo release 1.4
Hazardous materials class (1-digit) 7.1
Hazardous materials class (4-digit) 8.6
Hazardous materials name 91.4
The second section of the table shows missing data rates for the hazardous materials (hazmat) variables. Hazmat Placard was unrecorded in only 0.9 % of cases. However, rates for the variables describing the hazardous material (where present) were higher. The percentages only pertain to the 70 cases in which it was coded that the vehicle displayed a hazmat placard. The hazardous materials name variable is missing for 91.4 percent of the 70 cases.
We also compared the values of variables in the MCMIS Crash file with the values of
[image:29.612.128.486.69.306.2]comparable variables in the Florida Crash file. The purpose of this comparison is to identify any errors in translating variables from the values in the state crash file to the values required for Safetynet. Florida has adopted in many instances the same code levels for certain variables as are used in the MCMIS Crash file.
Table 18 shows the coding of vehicle configuration in the MCMIS Crash file and the variable in the Florida PAR file used to identify qualifying trucks and buses. The variable in the PAR file is largely based on results from a VIN decoding program as described in Section 4.1. Obvious inconsistencies in Table 18 are shaded. The largest inconsistency is for 372 vehicles which are coded as SUTs with 3+ axles in the MCMIS file, but are coded as truck tractors in the PAR file. An additional 36 vehicles are coded as SUTs with 2 axles and 6 tires in the MCMIS file, but are coded as truck tractors in the PAR file. In the opposite direction, a total of 81 vehicles are coded as tractors with or without trailers in the MCMIS file, but are coded as SUTs in the PAR file.
Table 18 Comparison of Vehicle Configuration
in MCMIS File with VIN Derived Vehicle Type in Florida Crash File
Vehicle configuration
Cases %
MCMIS Crash file Florida Crash File
Light trk (only if HM placard)
Tractor with or without trailers 1 0.0
GVWR<10,000 lbs or Unknown 2 0.1
Other bus 4 0.1
School bus 2 0.1
Transit/commuter bus 3 0.1
Bus (seats>15, incl dr)
Med/hvy pickup >10K lbs 1 0.0
Cross country/intercity bus 21 0.5
Other bus 4 0.1
School bus 34 0.9
Transit/commuter bus 38 1.0
SUT, 2-axle, 6-tire
SUT 10,000-19,500 lbs 96 2.5
SUT 19,500-26,000 lbs 111 2.9
SUT >26,000 lbs 124 3.2
Med/hvy pickup >10K lbs 9 0.2
Step van 10 0.3
Tractor with or without trailers 36 0.9
School bus 1 0.0
Large van 7 0.2
Light pickup/trailer/commercial 26 0.7
GVWR<10,000 lbs or Unknown 110 2.9
SUT, 3+ axles
SUT 10,000-19,500 lbs 9 0.2
SUT 19,500-26,000 lbs 46 1.2
SUT >26,000 lbs 355 9.2
Med/hvy pickup >10K lbs 3 0.1
Walkin van 1 0.0
Tractor with or without trailers 372 9.7
Large van 1 0.0
GVWR<10,000 lbs or Unknown 42 1.1
Truck trailer SUT >26,000 lbs 1 0.0
Truck tractor (bobtail)
SUT 19,500-26,000 lbs 3 0.1
SUT >26,000 lbs 41 1.1
Tractor with or without trailers 527 13.7
GVWR<10,000 lbs or Unknown 21 0.5
Tractor/semitrailer
SUT 10,000-19,500 lbs 1 0.0
SUT >26,000 lbs 28 0.7
Tractor with or without trailers 1,419 36.9
Cross country/intercity bus 1 0.0
GVWR<10,000 lbs or Unknown 38 1.0
Tractor/double
SUT 19,500-26,000 lbs 1 0.0
SUT >26,000 lbs 7 0.2
Tractor with or without trailers 236 6.1
GVWR<10,000 lbs or Unknown 6 0.2
Unk heavy truck>10,000
SUT 10,000-19,500 lbs 1 0.0
SUT 19,500-26,000 lbs 2 0.1
SUT >26,000 lbs 16 0.4
Tractor with or without trailers 11 0.3
GVWR<10,000 lbs or Unknown 14 0.4
Unknown GVWR<10,000 lbs or Unknown 1 0.0
Florida Reporting to the MCMIS Crash file Page 21
[image:31.612.171.443.162.364.2]Number of fatalities in the crash is recorded in both the MCMIS file and the Florida PAR file. Table 19 shows a comparison between the two files. In relation to the total 3,847 matched vehicles, there were few inconsistencies in the number of fatalities variables. Less than 1 percent of the data disagree.
Table 19 Comparison of Number of Fatalities in the Crash
in MCMIS and Florida Crash Files, 2008
Number of fatals in crash
Cases %
MCMIS Crash file Florida Crash file
0 0 3,535 91.9
0 1 23 0.6
1 0 9 0.2
1 1 244 6.3
1 2 1 0.0
2 1 1 0.0
2 2 21 0.5
3 3 1 0.0
4 4 11 0.3
6 6 1 0.0
Total 3,847 100.0
7. Summary and Discussion
This report is an evaluation of reporting to the MCMIS Crash file by the state of Florida in 2008. Records were matched between the Florida PAR file and the MCMIS Crash file using variables common to both files with low percentages of missing data. After 37 duplicate records were removed from the PAR file, 693,795 unique records were available for matching with 3,860 unique records in the MCMIS Crash file. No duplicate records were found in the MCMIS Crash file. In total, 3,847, or 99.7 percent of the MCMIS records were matched (Figure 1).
The next step in the evaluation process focused on identifying reportable cases using the Florida PAR file based on the MCMIS vehicle and crash severity criteria. Overall, 32,789 vehicles were identified as qualifying trucks, buses, or vehicles displaying a hazardous materials placard (Table 4). The method used to identify qualifying vehicles was based on a combination of seven
type as recorded on the PAR is used alone, or the method based on seven variables described in this study is used.
After identifying qualifying vehicles, it is necessary to determine which of these vehicles meet the crash severity criteria for reporting to MCMIS. Florida classifies injury using the common KABCN scale, where injuries are classified as Fatal (K), Incapacitating (A), Non-incapacitating, but evident (B), Possible (C), and No injury. The Florida Crash file includes information about the most severe injury in the crash. A maximum injury in the crash variable was created from the Florida PAR Person file and this variable coincides exactly with the variable already recorded in the Florida data file. Determining whether an injured person was transported for immediate medical attention is also recorded in the Florida Crash file. There is an Injured Taken To variable in the Crash file indicating whether an injured person was transported to a care facility. A crash was thus determined to meet the MCMIS injury severity criteria if crash severity was Fatal, or if crash severity was A, B, or C injury, and Injured Taken To was ‗yes‘. This is likely a
conservative estimate in the sense that the recorded data must explicitly indicate that a vehicle satisfies the crash severity criterion.
The last MCMIS criterion specifies ―vehicles towed due to disabling damage.‖ The definition of the disabling damage variable coded in the Florida PAR data matches the MCMIS criterion very closely and is stated below.
Disabling damage – vehicle must be towed from the scene of the traffic crash because it is inoperable or is drivable but must be towed from the scene of the traffic crash to prevent additional damage. This does not include a drivable vehicle that is towed from the scene of the traffic crash for any reason.
Any qualifying vehicle involved in a crash satisfying the above definition was considered towed and disabled. The frequency distribution of this variable is consistent with the towed variable in the 2009 General Estimates System, [42] and with towed and disabled variables derived in other MCMIS evaluations. [20,22,27,28] In the Florida Crash file, this variable is coded at the vehicle level so a variable was created at the crash level and used for analysis. The Florida data also has a crash_damage_severity variable recorded at the crash level, but it appears to represent the least damaged vehicle in the crash instead of the most damaged vehicle. The 2004 MCMIS evaluation of 2003 Florida data also references this variable and describes it as representing the least
damaged variable in the crash. [5]
In total, it is estimated that 11,456 vehicles were reportable to the MCMIS Crash file. Of these, 329 were involved in fatal crashes and 4,839, or about 42.2 percent, were involved in crashes where at least one person was injured and transported for medical treatment. Based on the damage severity variable, it is estimated that 6,288 or about 54.9 percent of reportable vehicles were involved in crashes where at least one vehicle was towed due to disabling damage.
Florida Reporting to the MCMIS Crash file Page 23
Specific variables were examined to identify sources of underreporting. Reporting rates were calculated and presented in four groups. The four groups are case processing, reporting criteria, reporting agency and area, and fire/explosion. Case processing considers timing issues, reporting criteria deals with vehicle and crash severity issues, agency and area are related to the reporting agency and the county of the crash, and fire/explosion considers fire or explosions in reportable vehicles.
With respect to timing issues related to reporting, reporting rates were fairly consistent over the twelve months, with the exception of June and July in which rates were 19.1 and 10.9 percent, respectively. On a monthly basis, Florida appears to upload cases well within the 90-day grace period. Overall, approximately 91 percent of cases are uploaded within the 90-day grace period (Figure 3).
Overall, the reporting rate for trucks is 31.9 percent which is close to the overall rate since trucks represent the majority of reportable vehicles. A closer inspection of trucks by vehicle body style shows that the rate for tractors with or without trailers is 46.7 percent. Tractors with or without trailers account for 32.3 percent of unreported cases. For single unit trucks (SUTs) the rates increase with GVWR. For SUTs the rates are 6.0 percent, 16.2 percent, and 24.2 percent for GVWR categories 10,000-19,500; 19,501-26,000; and greater than 26,000, respectively. SUTs account for 45.5 percent of the unreported cases. Overall, the reporting rate for buses is 5.3 percent. By bus type, the rates are 6.2 percent for transit/commuter bus, 4.5 percent for school bus, and 1.4 percent for other buses. Cross country / Intercity buses have a rate of 22.4 percent, but account for only 0.7 percent of unreported cases. The reporting rate for light pickups with trailers that are used for commercial use is 20.8, but this vehicle type only accounts for 1 percent of the total of unreported cases.
With respect to crash severity, the reporting rate for fatal crashes is 86.0 percent. The rate declines to 30.9 percent for injured and transported crashes, and 22.7 percent for towed and disabled crashes. Based on the KABCN scale, rates also decline as severity declines. For A-injuries and B-A-injuries the reporting rates are 34.5 percent and 31.3 percent, respectively, while the rate for C-injuries is 26.9 percent.
Previous MCMIS evaluations suggest that reporting rates in larger jurisdictions tend to be lower than those in smaller ones and this is the case in Florida. In terms of the number of reportable cases, the reporting rate for the top twenty counties is 25.3 percent, compared to the higher rate of 39.2 percent for the remaining forty-seven counties. The top twenty counties account for 83.6 percent of the unreported cases. Miami Dade has the largest number of reportable cases, but has a reporting rate of 12.2 percent and accounts for 16.4 percent of all unreported cases. Broward County has the second largest number of reportable cases and has a reporting rate of 19.8 percent.
Based on reporting agency, the Florida PAR file identifies the highway patrol, sheriff‘s offices, and police departments. The highway patrol has the highest rate at 33.7 percent, and accounts for 51.6 percent of total unreported cases. The reporting rate for sheriff‘s offices is 24.7 percent, while the rate for police departments is 18.0 percent.
Florida Reporting to the MCMIS Crash file Page 25
8. References
1 Blower, D., and Matteson, A., Evaluation of the Motor Carrier Management Information System Crash File, Phase One. University of Michigan Transportation Research Institute, Ann Arbor, Michigan. March 2003. Sponsor: Federal Motor Carrier Safety
Administration, U.S. D.O.T.
2 Blower, D., and Matteson, A., Patterns of MCMIS Crash File Underreporting in Ohio. University of Michigan Transportation Research Institute, Ann Arbor, Michigan. August 2003. Sponsor: Federal Motor Carrier Safety Administration, U.S. D.O.T.
3 Blower, D., and Matteson, A., Evaluation of Missouri Crash Data Reported to MCMIS Crash File. University of Michigan Transportation Research Institute, Ann Arbor, Michigan. January 2004. Sponsor: Federal Motor Carrier Safety Administration, U.S. D.O.T.
4 Blower, D., and Matteson, A., Evaluation of Michigan Crash Data Reported to MCMIS Crash File. University of Michigan Transportation Research Institute, Ann Arbor, Michigan. September 2004. Sponsor: Federal Motor Carrier Safety Administration, U.S. D.O.T.
5 Blower, D., and Matteson, A., Evaluation of Florida Crash Data Reported to MCMIS Crash File. University of Michigan Transportation Research Institute, Ann Arbor, Michigan. December 2004. Sponsor: Federal Motor Carrier Safety Administration, U.S. D.O.T.
6 Matteson, A., and Blower, D., Evaluation of California Crash Data Reported to MCMIS Crash File. University of Michigan Transportation Research Institute, Ann Arbor, Michigan. February 2005. Sponsor: Federal Motor Carrier Safety Administration, U.S. D.O.T.
7 Green, P.E., and Blower, D., Evaluation of New Jersey Crash Data Reported to MCMIS Crash File. University of Michigan Transportation Research Institute, Ann Arbor, Michigan. February 2005. Sponsor: Federal Motor Carrier Safety Administration, U.S. D.O.T.
8 Green, P.E., and Blower, D., Evaluation of New Mexico Crash Data Reported to MCMIS Crash File. University of Michigan Transportation Research Institute, Ann Arbor,
Michigan. July 2005. Sponsor: Federal Motor Carrier Safety Administration, U.S. D.O.T.
9 Matteson, A., and Blower, D., Evaluation of North Carolina Crash Data Reported to MCMIS Crash File. University of Michigan Transportation Research Institute, Ann Arbor, Michigan. May 2005. Sponsor: Federal Motor Carrier Safety Administration, U.S. D.O.T.
10 Matteson, A., and Blower, D., Evaluation of Illinois Crash Data Reported to MCMIS Crash File. University of Michigan Transportation Research Institute, Ann Arbor,
11 Blower, D., and Matteson, A., Evaluation of Washington Crash Data Reported to MCMIS Crash File. University of Michigan Transportation Research Institute, Ann Arbor,
Michigan. June 2006. Sponsor: Federal Motor Carrier Safety Administration, U.S. D.O.T.
12 Blower, D., and Matteson, A., Evaluation of Iowa Crash Data Reported to MCMIS Crash File. University of Michigan Transportation Research Institute, Ann Arbor, Michigan. August 2006. Sponsor: Federal Motor Carrier Safety Administration, U.S. D.O.T.
13 Blower, D., and Matteson, A., Evaluation of 2005 Missouri Crash Data Reported to MCMIS Crash File. University of Michigan Transportation Research Institute, Ann Arbor, Michigan. September 2006. Sponsor: Federal Motor Carrier Safety
Administration, U.S. D.O.T.
14 Green, P.E., and Matteson, A., Evaluation of Maryland Crash Data Reported to MCMIS Crash File. University of Michigan Transportation Research Institute, Ann Arbor,
Michigan. July 2006. Sponsor: Federal Motor Carrier Safety Administration, U.S. D.O.T.
15 Green, P.E., and Matteson, A., Evaluation of 2005 Ohio Crash Data Reported to MCMIS Crash File. University of Michigan Transportation Research Institute, Ann Arbor,
Michigan. December 2006. Sponsor: Federal Motor Carrier Safety Administration, U.S. D.O.T.
16 Blower, D., and Matteson, A., Evaluation of 2005 Louisiana Crash Data Reported to MCMIS Crash File. University of Michigan Transportation Research Institute, Ann Arbor, Michigan. December 2006. Sponsor: Federal Motor Carrier Safety Administration, U.S. D.O.T.
17 Blower, D., and Matteson, A., Evaluation of 2005 Nebraska Crash Data Reported to MCMIS Crash File. University of Michigan Transportation Research Institute, Ann Arbor, Michigan. February 2007. Sponsor: Federal Motor Carrier Safety Administration, U.S. D.O.T.
18 Blower, D., and Matteson, A., Evaluation of 2005 South Dakota Crash Data Reported to MCMIS Crash File. University of Michigan Transportation Research Institute, Ann Arbor, Michigan. March 2007. Sponsor: Federal Motor Carrier Safety Administration, U.S. D.O.T.
19 Blower, D., and Matteson, A., Evaluation of 2004 Tennessee Crash Data Reported to MCMIS Crash File. University of Michigan Transportation Research Institute, Ann Arbor, Michigan. May 2007. Sponsor: Federal Motor Carrier Safety Administration, U.S. D.O.T.
Florida Reporting to the MCMIS Crash file Page 27
21 Blower, D., and Matteson, A., Evaluation of 2005 Pennsylvania Crash Data Reported to MCMIS Crash File. University of Michigan Transportation Research Institute, Ann Arbor, Michigan. Sept 2007. Sponsor: Federal Motor Carrier Safety Administration, U.S. D.O.T.
22 Green, P.E., and Matteson, A., Evaluation of 2005 Indiana Crash Data Reported to MCMIS Crash File. University of Michigan Transportation Research Institute, Ann Arbor, Michigan. Sept 2007. Sponsor: Federal Motor Carrier Safety Administration, U.S. D.O.T.
23 Blower, D., and Matteson, A., Evaluation of 2005 Connecticut Crash Data Reported to MCMIS Crash File. University of Michigan Transportation Research Institute, Ann Arbor, Michigan. Sept 2007. Sponsor: Federal Motor Carrier Safety Administration, U.S. D.O.T.
24 Green, P.E., and Matteson, A., Evaluation of 2005 Alabama Crash Data Reported to MCMIS Crash File. University of Michigan Transportation Research Institute, Ann Arbor, Michigan. Sept 2007. Sponsor: Federal Motor Carrier Safety Administration, U.S. D.O.T.
25 Green, P.E., and Matteson, A., Evaluation of 2006 Georgia Crash Data Reported to MCMIS Crash File. University of Michigan Transportation Research Institute, Ann
Arbor, Michigan. November 2007. Sponsor: Federal Motor Carrier Safety Administration, U.S. D.O.T.
26 Blower, D., and Matteson, A., Evaluation of 2006 Kentucky Crash Data Reported to MCMIS Crash File. University of Michigan Transportation Research Institute, Ann Arbor, Michigan. December 2007. Sponsor: Federal Motor Carrier Safety Administration, U.S. D.O.T.
27 Green, P.E., and Matteson, A., Evaluation of 2006 Idaho Crash Data Reported to MCMIS Crash File. University of Michigan Transportation Research Institute, Ann Arbor,
Michigan. December 2007. Sponsor: Federal Motor Carrier Safety Administration, U.S. D.O.T.
28 Green, P.E., and Matteson, A., Evaluation of 2006 Wisconsin Crash Data Reported to MCMIS Crash File. University of Michigan Transportation Research Institute, Ann Arbor, Michigan. March 2008. Sponsor: Federal Motor Carrier Safety Administration, U.S. D.O.T.
29 Matteson, A., and Blower, D., Evaluation of 2006 Maine Crash Data Reported to MCMIS Crash File. University of Michigan Transportation Research Institute, Ann Arbor,
Michigan. June 2008. Sponsor: Federal Motor Carrier Safety Administration, U.S. D.O.T.