2008
Vol. 25 No. 4
Pages 101 - 136
UPDATE
Science, Policy & Emerging Issues
School of Natural
Resources and
Environment
THE UNIVERSITY
OF MICHIGAN
Contents
Endangered Species
UPDATE
Science, Policy & Emerging Issues
2008 Vol. 25 No. 4
Megan Banka ... Editor David Faulkner...Associate Editor Devan Rouse ...Associate Editor Johannes Foufopoulos ... Faculty Advisor Bobbi Low ... Faculty Advisor
Advisory Board
Richard Block
Santa Barbara Zoological Gardens
Susan Haig, PhD
Forest and Rangeland Ecosystem Science Center, USGS
Oregon State University
Patrick O’Brien, PhD
ChevronTexaco Energy Research Company
Jack Ward Thomas, PhD
University of Montana
Subscription Information: The Endangered Species UPDATE is published four times per year by the School of Natural Resources and Environment at The University of Michigan. Annual rates are: $78 institution, $33 indi-vidual, $25 student/senior, and $20 electronic. Add $5 for postage outside the US, and send check or money order (payable to The University of Michigan, Endangered Spe-cies UPDATE) to:
Endangered Species UPDATE School of Natural Resources and Environment
The University of Michigan 440 Church Street Ann Arbor, MI 48109-1041 (734) 763-3243; fax (734) 936-2195
E-mail: [email protected]
http://www.umich.edu/~esupdate
Cover: A swimming skate. Photo courtesy of the U.S. Fish and Wildlife Service.
The views expressed in the Endangered Species UPDATE
may not necessarily reflect those of the U.S. Fish & Wild -life Service or The University of Michigan.
The Endangered Species UPDATE was made possible in part by Chevron Corporation and the U.S. Fish and Wildlife Service Division of Endangered Species.
Protecting Climate Refugia Areas: The case of the Gaviota coast in southern California ...103
Michael Vincent McGinnis
Population and Politics of a Plover ...104
Fritz L. Knopf Victoria J. Dreitz
Spatial analysis of incidental mortality as a threat for Franciscana dolphins (Pontoporia blainville) ....115
Marcelo H. Cassini
Observations on the reproductive seasonality of Atlantoraja platana (Günther, 1880), an intensively fished skate endemic
to the Southwestern Atlantic Ocean ...122 Maria Cristina Oddone
Gonzalo Velasco
Focus on Nature: Bee Creek Cave Harvestman (Texella reddel-li)...130 Rochelle Mason
Call for Submissions...131
Instructions to Authors...132
Type
Title
Michael Vincent
McGinnis
Senior Lecturer, Insitute of Policy Studies, Senior Lec-turer, School of Government, Victoria University of Wel-lington, P.O. Box 600, Level 5, West Wing Railway Building, Bunny Street, Wellington, New Zealand, 6011
Abstract
The designation of “climate refuge areas” should be an important part of a more integrated, ecosystem-based approach to protect endangered species. Identifying “climate refugia” areas should be a priority as resource managers begin to develop adaptive policies. This article describes policy innovation in California that includes important strategic elements and goals that can
support the identification and protection of climate refugia for special status species, and offers a case study of the Gaviota coast in southern California.
The essay concludes with general recommendations for planning and policy
development to support better protection of endangered species, and empha
-sizes the importance of better local land-use planning.
The Importance of Climate Refugia
This article describes recent policy innovation in California to develop an ecosystem-based approach to endangered species protection, with particular emphasis on the importance of identifying and protecting climate refugia in areas that are known as hot spots for threatened biodiversity. Climate refugia is a term that has emerged in the conservation biology literature that refers to an area that is inhabited by plants and animals during a period of continental climatic change (as a glaciation), and remains as an important area from which a new dispersion and speciation may take place after
cli-matic disturbance (Klausmeyer and Shaw 2009). Scientists have begun to
describe the cumulative impacts of the multiple-use of resources, and show that these impacts will likely exacerbate an ecosystem’s ability to adapt to climate disturbance (Worm et al. 2006; Halpern et al. 2009). Large-scale cli-mate disturbance will interact with and accelerate the existing anthropogenic pressures to endangered species. Indeed, scientists show that there are
syn-ergies among extinction drivers under global climate change that reflect the
cumulative impacts of the multiple-use of resources and climate disturbance (Brook et al. 2008). Policy innovation is needed to begin to foster large-scale,
ecosystem-based adaptive conservation strategies to better protect endan -gered species in an era of climate change.
Scholarly literature has expressed concern over the lack of region- or
ecosystem-specific adaptation policy that can enable ecological resilience of
threatened biodiversity with respect to climate disturbance. Current strat-egies include prescriptions at the state and federal government levels that
habitat reserves that support
connectiv-ity or migration corridors, habitat buffer
zones, ecological core areas, the control of non-native invasive species, and col-laboration across administrative,
eco-nomic and political jurisdictions (Yaffee
et al. 1996). Local land use planning and policy can play a fundamental role in the protection of sensitive habitat areas and ecosystems (Brody 2004).
This article describes recent policy in-novation in California that focuses on the need to develop adaptive policy at the re-gional and local levels to protect climate refugia throughout the state. Resource managers increasingly recognize that adaptive policy must occur at regional levels with local land use decisions and management actions that can protect en-dangered species dependent on climate refugia. Protecting endangered species and their habitats on private and public
lands will become increasingly difficult
as plants, animals and insects adjust their ranges in response to climate change.
More importantly, conservation effort is
needed to protect endangered species in parts of their habitat range that are rela-tively stable “climate refugia” – areas that function as important source areas from which species can expand given
climate disturbance. This article offers
a number of preliminary strategies that should be developed at regional levels to begin to protect endangered species and climate refugia areas. Among the most recent recommendations in the
sci-entific literature is the need to identify
and protect climate refugia across a rap-idly changing landscape and seascape (Barnosky 2007). Evidence is accumu-lating that emphasizes the importance of managing climate refugia that have historically supported ecological resil-ience during periods of dramatic climate disturbance, such as long term changes in environmental conditions.
Case Study: California’s
Mediterra-nean-type Ecosystem
Mediterranean-type ecosystems (MTEs) have a rich natural history that includes long periods of ecosystem and climate-related disturbance events, such as changes in oceanographic and climate
regimes (Klausmeyer and Shaw 2009).
MTEs are far from homeostatic or stable systems (Blondel and Aronson 1999). The MTEs of the world are unique biomes that share a common natural history – species of these areas have had to adapt to major climate events such as
flooding, earthquakes, fire, and changes
in the available of water and food. Run-del et al. (1998) note that MTEs are not steady-state ecosystems. For example, the Los Angeles River in southern
Cali-fornia can increase its flow 3,000 fold in a
24-hour period (Davis 1998). California
has experienced significant long-term
droughts or extreme hydrological shifts: 892-1112 (220 years) and 1209-1350 (141 years). The longest drought of the 20th Century lasted 6 years during 1987-1992. Species adapt to these changing envi-ronmental conditions often by relying on climate refugia areas.
and gas, agricultural activity, fishing,
and the development of irrigation sys-tems across southern California. These uses, including the associated multiple impacts have synergistic and cumula-tive impacts on ecosystems, and can ex-acerbate the ability of native species to adapt to climate disturbance (Halpern et al. 2008). The native plants unique to California are very vulnerable to global climate change such that two-thirds of
these “endemics” could suffer more
than an 80 percent reduction in geo-graphic range by the end of the century (Loarie et al. 2008). Loarie et al. (2008)
point to the need for identification and better protection of existing climate
refugia given the evidence of ecosystem disturbance across California’s MTE.
Adaptive Biodiversity Policy
Inno-vation in California
California may be on the verge of estab-lishing a new era of conservation
poli-cymaking that may influence how we
can protect endangered species in the context of climate disturbance. In light of recent evidence of climate distur-bance, policy innovation, local initiative and leadership will be needed if endan-gered species are to adapt to the dramat-ic changes in habitats. California poldramat-icy requires that the public and private sec-tors participate in reducing California’s greenhouse gas (GHG) emissions. In addition, the existing California policy framework includes Assembly Bill (AB) 32, Senate Bill (SB) 375, SB 97, as well
as a host of additional topic-specific
bills, that require counties and cities to reduce GHG. State law requires that counties and cities develop Climate Ac-tion Strategies. In December 2008, the California Air Resources Board released the state’s Climate Change Scoping Plan, which describes a range of strate-gies that are necessary for the state to reduce its GHG emissions to 1990 levels by 2020. A move beyond a focus or em-phasis in reducing GHG is required if
endangered species are to be protected. In response to the California Governor’s Executive Order S-13-2008, the 2009 California Climate Adapta-tion Strategy Discussion Draft [hereaf-ter, Discussion Draft] (2009) outlines a wide range of strategic elements that include goals and objectives for pro-tecting biodiversity and special status species in light of increasing pressures from climate change. While California is encouraging local governments to develop plans that support these
adap-tive strategies, there has been little if
any formal policy developed by local governments that supports the protec-tion of climate refugia for endangered species beyond the regulatory require-ments set forth by the state and federal governments, such as the Endangered Species Act, that require critical habitat designation. However, one county in
California may represent the first step
toward protecting climate refugia that will likely be needed for endangered species.
Protecting Climate Refugia: the
case of the Gaviota coast in south
California
One consequence of climate disturbance in California will be a shift of biodiver-sity to the north (Loarie et al. 2008). Sci-entists from the US Geological Survey developed the Coastal Vulnerability Index (CVI) to assess the physical vul-nerability of the California coast. They found that from San Luis Obispo to the Mexico border, communities along this coastline have “high” or “very high” vulnerability to climate change. One
area identified as climate refugia is the
as-sociated with the transverse Santa Ynez Range. Map 1 depicts the GC and areas of high conservation value (Conception Coast Project 2004).
In 2004, the National Park Ser-vice (NPS) completed a feasibility study that included an evaluation of the GC as California’s second national sea-shore (the only national seasea-shore is the Point Reyes National Seashore north of San Francisco). According to the NPS (2004), the GC includes two of the most biologically diverse ecoregions in the world, and some of the highest concen-trations globally of important, rare spe-cies in the nation. Of the approximately 1,400 plant and animal species estimat-ed to exist within GC, there are 24 festimat-ed- fed-erally- or state-listed threatened or en-dangered plant and animal species and another 60 considered rare or of special concern. The NPS concluded that the quality and scope of GC’s natural and cultural resources qualify it for inclu-sion in the National Park system. But because of the preponderance of private land in the area, the NPS found that it would not be feasible to add Gaviota to the National Park system at that time.
In March 2009, Santa Barbara Coun-ty initiated the long-term development of a Climate Action Strategy (CAS) that would include or consider biodiver-sity concerns. In addition, the County Board of Supervisors voted to support a Gaviota Coast Rural Regional Plan-ning (RRP) process, which may lead to the development of new policies in the County’s General Plan and Local Coastal Plan (LCP) that can protect en-dangered species. The County’s CAS and RRP processes are unusual insofar as they include biodiversity protection
measures, and the local effort may rep
-resent the first local effort in California
with regards to climate change and en-dangered species protection.
While climate-related policy devel-opment will necessarily include broad
spatial scales, decision makers increas-ingly recognize that implementation must occur at the local level with local land use decisions. With respect to the
planning process for identification and
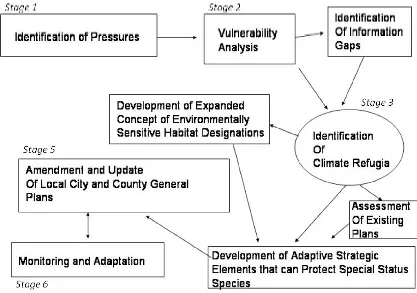
protection of climate refugia, Figure 1 depicts the ideal planning process to begin to address endangered species is-sues at the county level.
The following planning stages are recommended to begin to identify and protect climate refugia at the local lev-el.
Stage 1 - Identification of Pressures.
Climate change will have direct and in-direct pressures and impacts on areas designated as critical habitat and envi-ronmental sensitive habitat areas (ES-HAs). Existing protected areas, such as ecological reserves, wildlife areas, undesignated lands, mitigation sites, and easements will likely be impacted by climate change. A more comprehen-sive, ecosystem-based and cumulative
assessment, that includes the identifica -tion of multiple pressures or stressors on endangered species and their habi-tat, should be included in local land use planning.
Stage 2 - A comprehensive vulner-ability analysis should be conducted to establish the type and extent of poten-tial climate changes (such as sea level rise, storm surges, and changing ocean conditions) and how these changes will impact natural habitats and endan-gered species. Smaller communities are particularly vulnerable as they lack
many important resources for effective
adaptation (California Resources Agen-cy 2009). A vulnerability analysis must include detailed mapping that contains
“measures of physical risk,” identifica -tion of threatened habitats, among oth-er factors. Coupled with an inventory, this analysis can determine the most successful places that exist for ensuring migration of sensitive habitat, such as coastal wetlands, and species.
Map 1:
The vulnerability analysis should be used as one foundation to develop adaptation strategies (both overarching
and specific) to protect endangered spe -cies. As much as possible, each adap-tive strategy should be accompanied by case studies that elucidate that strat-egy and guidance on how it should be implemented. For example, changes in
creek, wetland, and coastal bluff buffer
areas and other adaptive strategies that are needed to protect sensitive habitat areas should be incorporated in local plans. In addition, the vulnerability analysis should carefully depict and de-scribe information gaps.
To assist in the regional vulner-ability analysis, regional interagency and working groups representing gov-ernment and non-govgov-ernmental organi-zations, e.g. state parks, and the private sector may be needed to discuss and recommend adoption of policies to
pro-tect biodiversity. Such a working group
could also include the use of a Scientific
Advisory Panel to assist in the develop-ment of guiding principles to protect biodiversity.
Stage 3 - Identification of Climate
Refugia. A number of guiding princi-ples should be emphasized to identify climate refugia including the following goals:
o Maintain healthy, connected, genetically diverse populations
o Improve resiliency of existing habitats in order to maintain existing or new assemblages of species
o Reduce non-climate stressors on ecosystems (i.e. invasive species)
o Protect coastal wetlands and ac-commodate sea level rise
o Consider climate change models as well as historical data when making projections
o Employ monitoring and
adap-Figure 1:
[image:7.612.61.478.401.694.2]tive management
o Adopt adaptation approaches that reduce risks to species and habitats and provide time for species evolution and development.
With respect to the identifica -tion of climate refugia, the precau-tion- precaution-ary principle must be employed to
buf-fer against scientific uncertainty. There are synergistic effects and positive feed -back loops of human-induced climate change, other anthropogenic impacts, and natural disturbances, all of which make decisions about policy solutions
difficult.
The identification of climate
refugia should include priority man-agement goals to preserve core habitat and migration corridors. Since cli-mate disturbance will continue to cause plant communities and species’ ranges to shift, adaptive corridors of continu-ous habitat must be preserved to enable future shifts in ranges and resiliency in ecosystems. Routes containing viable native habitats for plant pollination vectors (wind and insect) and which connect existing and predicted future habitat areas can be mapped and
pro-tected. The identification of climate
refugia should also include policy de-velopment that emphasizes a careful review and assessment of existing land use plans and policies, such as Local Coastal Plans, and other elements such as biological thresholds and environ-mental sensitive habitat areas.
Stages 4, 5 and 6 - Development of Adaptive Strategic Elements. City and county plans should be amended to include special conservation measures that can support the ecological resil-ience of endangered species and cli-mate refugia. Amendment and revision of city and county general plans should support an integrated, ecosystem-based approach that includes resources that support long-term monitoring of cli-mate refugia areas, and land use ele-ments should be revised as new
infor-mation becomes available.
Conclusion
The long-term impacts of climate change on special status species are likely to be dramatic. In the context of climate change, the goal of protecting special status species is exacerbated by the cumulative or synergistic impacts of the multiple-use of resources and the expected pressures from large-scale cli-mate disturbance. This article reviewed recent policy development in California
and offered a number of recommenda -tions for cities and counties to begin to develop biodiversity conservation
measures that can better protect endan -gered species and climate refugia. Pol-icy innovation that moves beyond the emphasis of reducing greenhouse gases and supports the ecological resilience and adaptation of species that are es-sential to the maintenance of goods and services provided by a healthy, produc-tive ecosystem is needed today.
Acknowledgment
This article is based on the report by McGinnis et al (2009) entitled “Developing Adaptive Policy to Climate Disturbance in Santa Barbara County”. The author would like to thank University of California at Santa Barbara Associated Students Coastal Fund for grants that supported the writing of this article. The opinions or recommendations described in this article are those of the author, and may not represent those of the University of California or UCSB’s Associated Students Coastal Fund.
Literature Cited
Barnosky, A.D. 2008. Climate change, refugia, and biodiversity: where do we go from here? An editorial comment. Climate Change 86: 29-32.
Blondel, J. and J. Aronson. 1999. Biology and Wildlife of the Mediterranean Region. Oxford University Press, Oxford.
Brody, S.D. 2004. Implementing the Principles of Ecosystem Management Through Local Land
Use Planning. Population & Environment 24,
6: 1573-1578.
California Resources Agency. August 4, 2009. California Climate Adaptation Strategy
Dis-cussion Draft. http://www.climatechange.
ca.gov/adaptation/
Books, New York.
Halpern, B.S. et al. 2009. Mapping cumulative human impacts to California Current.
Conser-vation Letters. 1-11. http://www.nceas.ucsb.
edu/GlobalMarine/impacts
Halpern, B.S., K.L. McLeod, A.A. Rosenberg, and
L.B. Crowder. 2008. Understanding cumula-tive and interaccumula-tive impacts as a basis for eco-system-based management and ocean zoning. Ocean and Coastal Management 51:203-211.
Klausmeyer, K.R. and M.R. Shaw. 2009. Climate
Change, Habitat Loss, Protected Areas and the Climate Adaptation Potential of Species in Mediterranean Ecosystems Worldwide. PLoS ONE 4(7): e6392. doi:10.1371/journal. pone.0006392
Little, S.J., R.G. Harcourt, and A.P. Clevenger.
2002. Do wildlife passages act as prey-traps? Biological Conservation 107, 2: 135-145.
Loarie, S.R., B.E. Carter, K. Hayhoe, S. McMahon,
R. Moe. 2008. Climate Change and the Future of California’s Endemic Flora. PLoS ONE 3(6): e2502. doi:10.1371/journal.pone.0002502 McGinnis, M.V., W. Su, A. Willsey, and J. Tiegs.
2009. Developing Adaptive Policy to Climate Disturbance in Santa Barbara County. Ocean and Coastal Policy Center White Paper. Uni-versity of California Santa Barbara. Marine Science Institute. September.
Miller, C.I., N.L. Stephenson, and S.L. Stephens. 2007. Climate change and forests of the future: managing in the face of uncertainty. Ecological Applications 17: 2145-2151.
National Park Service. 2004. Final Gaviota Coast
Feasibility Study. March 9. http://www.nps.
gov/pwro/gaviota/
Noss, R.F., E.T. LaRoe III, and J.M. Scott. 1995.
Endangered Ecosystems of the United States: A preliminary assessment of loss and degra-dation. Biological Report 28. U.S. Department of the Interior. Washington, D.C.
Rundel, P.W., G. Montenegro, and F.M. Jaksic, eds. 1998. Landscape Disturbance and Bio-diversity in Mediterranean-type Ecosystems. Springer, Berlin.
Worm, B. et al. 2006. Impacts of Biodiversity Loss on Ocean Ecosystem Services. Science 314: 787-790.
Yaffee, S.L., A.F. Phillips, I.C. Frentz, P. Hardy,
Type
Title
Fritz L. Knopf
1,3Victoria J. Dreitz
21Senior Scientist, Retired, US Department of Interior, 713 Boulder Circle, Fort Collins, CO 80524
2Avian Researcher, Colorado Division of Wildlife, 317 West Prospect, Fort Collins, CO 80526
The Mountain Plover (Charadrius montanus) is a species that inhabits cold, xeric-shrub landscapes of the western United States where it breeds in
low-density, scattered populations primarily in Colorado, New Mexico, and Wyo -ming. To the east of this landscape, the plover is found most predictably on prairie-dog (Cynomys spp.) towns within western prairies from northern Montana into Nuevo Leon and San Luis Potosi. These landscapes also his-torically supported large herds of bison (Bison bison). With near eradication of bison and decreased prairie-dog presence on the landscape, the eastern breeding range of this plover became fragmented and generally of poorer quality. Thus, in contrast to westerly xeric landscapes, the current popula-tion of plovers in prairie landscapes is now restricted to fragments within
the Oklahoma panhandle, north through the southwestern corner of Kansas,
most of eastern Colorado, the southwestern corner of Nebraska, and eastern
Wyoming and Montana (Knopf and Wunder 2006).
First collected by John Kirk Townsend along the Sweetwater River of Wy -oming in 1834 and subsequently named the Rocky Mountain Plover by John
James Audubon, this species of relatively nondescript plumage received little conservation attention for 150 years. It was never described as historically abundant, and only scattered references to the species appeared in the litera -ture--much like comments are lacking about any non-charismatic species on the western frontier of America in the 1800s. Despite occasional collections
of a few birds or clutches of eggs, one specific comment about plover occur -ring in high densities was that of an early bison hunter from the early 1870s
who had killed about 200 in an hour near Dodge City, Kansas (Sandoz 1954). Those likely were from flocks of migrating birds that then flew directly south
to winter in South Texas. Today, we believe that most migrants move more to the south along the Front Range of Colorado then swing west across south-ern New Mexico and Arizona to California and then north into the Central Valley of California. Historical records of migrating plovers are almost
non-existent within the Great Basin (Knopf and Wunder 2006).
Forty years ago, Graul and Webster (1976) estimated a continental pop-ulation of 214,200–319,220 breeding Mountain Plovers, with 20,820 in the
“stronghold” of Weld Co., CO. Conservation concern for the species was first
expressed when the U.S. Fish and Wildlife Service (FWS) raised questions about population declines from historic levels (Leachman and Osmundson 1990). Unpublished guesses as to the contemporary population of plovers at that time oscillated around 6,000-10,000 birds, much reduced from the
torical estimation of Graul and Webster.
This difference reflected a severe de -cline in the population of Weld County, Colorado, used to extrapolate the earlier continental projection. In 1999 the FWS
officially proposed listing the species
as “Threatened,” with evidence of de-creasing population size being statisti-cally supported by >3% annual decline across 30 years of Breeding Bird Survey data (USFWS 1999).
Beginning in the late 1990s, many studies inventoried plover populations in major breeding areas across the spe-cies range. Wunder and others (2003) estimated a population of 2,300 birds in the previously undescribed high-el-evation population of South Park, Colo-rado. Summarizing recent inventories across eastern Colorado, FWS conclud-ed that there were an additional 7,000
birds in eastern Colorado. Personal communications from researchers and FWS personnel projected an additional 2,000-5,000 plovers in Wyoming and 1,500 in Montana. Thus, plover breed-ing populations in these three critical
states totaled ~12,800-15,800 birds, with
additional small populations known
to occur in Kansas, Nebraska, New
Mexico, Oklahoma, and Utah. Since all populations seemed to be stable, FWS subsequently decided to withdraw the proposed listing of the plover as a threatened species under The Endan-gered Species Act (ESA) in September of 2003 (USFWS 2003).
Additional studies following the decision to withdraw the plover
list-ing proposal confirmed, and slightly
expanded, the continental population estimate. Plumb and others (2005)
Mountain plover with full clutch. Photo credit:
conducted a statewide survey within historical plover locales in Wyoming to estimate a minimum of 3,300 breed-ing birds. This number was within the range of estimates used in the FWS deci-sion. However, the authors emphasized the “minimum” nature of the estimate and it still may be well short of a true statewide population due to the inad-equate representation of private lands in both the historical database and con-temporary sampling protocol.
Tipton and others (2009) conducted a systematic statewide survey of
east-ern Colorado. That study defined the
Colorado population on the eastern plains to be 8,577 birds, slightly larger than the previous FWS projection of 7,000. Childers and Dinsmore (2008) subsequently estimated 1,028 birds in Northeastern Montana, supportive of
the earlier FWS figure of 1500
state-wide. The Wyoming and Colorado studies together, lead to a revised
conti-nental estimate of breeding plovers to-taling a minimum of 15,700 birds. The true continental population is certainly larger by an unknown quantity given (1) documented small populations in contiguous states (Ellison-Manning and White 2001, Bly et al., 2008, McConnell
et al., 2009), (2) a potentially significant
population in New Mexico and (3) an
unknown population in Mexico (Knopf
and Wunder 2006).
On 16 November 2006, Forest Guardians and the Biological Conser-vation Alliance challenged the with-drawal of the proposal to list the plover as Threatened (Forest Guardians, et al.
v Ken Salazar et al., Case No. 3:06-cv-02560-MMA-BLM). The plaintiffs and the Federal defendants filed a settle -ment agree-ment on August 8, 2009, agreeing to reconsider the FWS 9 Sep-tember 2003, decision to withdraw the proposed listing of the mountain plover (68 Federal Register 53083) and to
sub-Mountain plover on the shrubsteppe in Carbon County, Wyoming. Photo
mit to the Federal Register a notice re-opening the proposal to list the Moun-tain Plover and providing for public comment by July 31, 2010. Thus, the decision to withdraw the proposed list-ing of the species in 2003 was ‘vacated’, and the plover is once again proposed as a threatened species under the ESA.
The agreement calls for a final listing
decision by 1 May 2011.
The listing process for the Mountain Plover was rather unique for the FWS. Whereas most species come to be listed following an initial petition to FWS fol-lowed by an FWS review, the impetus for increased conservation concern for this plover came from research within government research. The initial
iden-tification of plover declines came from
basic science (to 1999) within (vs. exter-nal to) the Department of Interior. FWS biologists within Ecological Services pursued the review and ultimately posed the species for listing. The pro-cess is a rather unique example of how government science and operations were intended to work within the De-partment of Interior. Also, whereas the
scientific record for most species listed
under ESA is often limited by a lack of historical and contemporary data, the science available to the proposal deci-sion for Mountain Plover in 2003 was some of the best available to date for any species.
If FWS decides to list this plover as threatened, any plan to promote its re-covery will be politically challenging. The plover is neither a montane spe-cies (as named) nor a spespe-cies of shores and wetlands like other members of the Charadriidae. Rather, again, it is an upland associate of xeric landscapes to the west of the Colorado Front Range that also occurs where disturbances al-ter prairie landscapes to the east of the Front Range. Prairie-dogs created both historical and contemporary habitats
for plovers (Dreitz et al., 2005). Contem
-porary sites that also attract breeding
plovers in prairie landscapes include surfaces impacted by activities such as military maneuvers, pipeline construc-tion, petroleum development, and ag-ricultural conversion of prairies. The
most attractive of these sites are those agricultural fields that have either been
recently tilled or are crop-idle at the time plovers arrive on the breeding grounds.
Plovers nest on those fields, and subse -quent tillage has been suspected to de-stroy nests and eggs. Recent research, however, shows that nest/egg destruc-tion by tillage practices appears to be a compensatory rather than an additive constraint on reproduction; the propor-tion of nests lost to tillage on relatively predator-free croplands is comparable to that proportion lost to predators in
contiguous, native landscapes (Dreitz and Knopf 2007).
In winter months plovers were his-torically found in the coastal uplands and interior valleys of California. Those habitats have been almost universally converted to urban/suburban and ag-ricultural landscapes, respectively. Whereas the preferred habitats on those xeric plains near the ocean and the in-tensely grazed sites of the San Joaquin and Sacramento valleys only occur in isolated patches on the modern land-scape, plovers are now found in large
numbers mostly on agricultural fields (Knopf and Rupert 1995). Favored fields include those that have been re -cently tilled, or re-cently harvested and followed by either burning or grazing
by domestic sheep to clean the field before replanting (Wunder and Knopf
2003).
Critics of listing the plover (includ-ing agricultural and rural development organizations among others) note that
the behavioral flexibility documented
for the species argues strongly against Mountain Plovers being limited by habitat. The high rate of nesting
suc-cess documented range-wide (Knopf
and high survival rate of breeding
(Din-smore et al. 2003) and wintering (Knopf
and Rupert 1995) birds further argue that the contemporary population (al-beit historically depressed) is viable. Alternatively, proponents argue that the current plover population (1) is drasti-cally reduced from the Graul and Web-ster 1976 projection, (2) has experienced widespread loss of native habitats, and (3) is dependent upon another species of conservation concern (prairie-dogs).
Regardless of the direction of the decision, the forthcoming process will certainly stimulate much political dia-logue. If listed, however, FWS will have to develop a plan for working with ag-ricultural producers to manage crop-ping practices, which goes well beyond contemporary ESA vs. private-lands
conflicts. The timing of agricultural
practices is weather-driven, and inter-jecting ESA considerations into daily management decisions at the level of lo-cal farms would have a major economic impact on the agricultural community. Ironically, that political and administra-tive theater will focus on a semi-desert species that historically and currently occurs secondarily in altered shortgrass prairie landscapes.
Literature Cited
Bly, B. L., L. Snyder, and T. VerCauteren. 2008. Migration chronology, nesting ecology, and breeding distribution of Mountain Plover (Charadrius montanus) in Nebraska. Nebraska Bird Review 76:120-128.
Childers, T.M. and S.J. Dinsmore. 2008. Den-sity and abundance of Mountain Plovers in Northeastern Montana. Wilson Bulletin 120:700-707.
Dinsmore, S.J., G.C. White, and F.L. Knopf. 2002.
Advanced techniques for modeling avian nest survival. Ecology 83:3476-3488.
Dinsmore, S.J., G.C. White, and F.L. Knopf. 2003.
Annual survival and population estimates of Mountain Plovers in Southern Phillips Coun-ty, Montana. Ecol. Applications 13:1013-1026.
Dreitz, V.D., M.B. Wunder, and F.L. Knopf. 2005.
Movements and home ranges of Mountain Plovers raising broods in three Colorado land-scapes. Wilson Bulletin 117:128-132.
Dreitz, V. J. and F. L. Knopf. 2007. Mountain
Plovers and the politics of research on private lands. BioScience 57:681-687.
Ellison-Manning, A.E. and C.M. White. 2001. Breeding biology of Mountain Plovers ( Char-adrius montanus) in the Uinta Basin. Western North American Naturalist 61:223-228. Graul, W.D., L.E. Webster. 1976. Breeding status
of the Mountain Plover. Condor 78: 265–267.
Knopf, F.L. and J.R. Rupert. 1995. Habits and
habitats of Mountain Plovers in California. Condor 97: 743–751.
Knopf, F.L. and M.B. Wunder. 2006. Mountain
Plover (Charadrius montanus). The Birds of North America Online. (A. Poole, Ed.) Ithaca:
Cornell Laboratory of Ornithology: http://bna.
birds.cornell.edu/BNA/account/Mountain Plover/.
Leachman, B. and B. Osmundson. 1990. Status of the Mountain Plover: A literature review. U.S. Fish and Wildlife Service. Golden, Colo-rado.
McConnell, S., T.J. O’Connell, D.M. Leslie, Jr., and J.S. Shackford. 2009. Mountain Plovers in Oklahoma: distribution, abundance, and habi-tat use. Journal of Field Ornithology 80:27-34.
Plumb, R.E., F.L. Knopf, and S.H. Anderson.
2005. Minimum population size of Mountain Plovers breeding in Wyoming. Wilson Bulle-tin 117:15-22.
Sandoz, M. 1954. The buffalo hunters. Hasting
House, New York.
Tipton, H.C, P.F. Doherty, Jr., and V.J. Dreitz.
2009. Abundance and density of Mountain Plover (Charadrius montanus) and Burrowing Owl (Athene cunicularia) in Eastern Colorado. Auk 126:493-499.
U. S. Fish and Wildlife Service. 1999. Endangered and threatened wildlife and plants: proposed threatened status for the Mountain Plover. Federal Register: 64(30):7587-7601.
U. S. Fish and Wildlife Service. 2003. Endan-gered and threatened wildlife and plants: withdrawal of the proposed rule to list the Mountain Plover as threatened. Federal Reg-ister 68(174):53083-53101.
Wunder, M.B. and F.L. Knopf. 2003. Impe -rial Valley agriculture is critical to wintering Mountain Plovers. Journal of Field Ornithol-ogy 74:74-80
Wunder, M.B., F.L. Knopf, and C.A. Pague.
Marcelo Hernán
Cassini
GEMA group, DCB and CONICET, Universidad Nacional de Luján, Rutas 5 y 7 (6700), Luján, Provincia de Buenos Aires, Argentina
Fisheries bycatch is considered one of the main threats for most large marine vertebrates, such as seabirds, marine mammals, turtles and sharks (review, among others, by Shaughnessy et al. 2003, Read et al. 2006, Zydelis et al. 2009). Incidental entanglement is a direct human threat with a straightforward ef-fect on species mortality. Three problems arise when results from bycatch research are translated into wildlife managment actions. First, predictions of population trends are normally weak because large-scale estimates of
de-mographic parameters are difficult to generate (e.g., Moore and Read 2008). Second, bycatch impact is rarely compared to other threats, such as depletion
of prey base, ecosystem changes, habitat degradation or disease. The effects
of these stressors are not always as conspicuous as bycatch, and may be more
difficult to evaluate (Taylor et al. 2007). Third, fisheries can offer short-term benefits to some marine vertebrates that overshadow the long-term costs of
this threat.
An emerging method since the development of GIS and spatial statis-tics is the comparison between distributions of species and threats that are formalized in habitat suitability models or ecological-niche models. These models relate presence-absence or abundance observations based on random
or stratified field sampling with stressors and other environmental variables
(Guisan and Thuilier 2005, Sims et al. 2008).
Franciscana dolphins (Pontoporia blainvillei) are small cetaceans restrict-ed to shallow waters of the South Atlantic Ocean, from southeastern Brazil (18º25’S) to northern Patagonia (42º10’S) (Crespo et al. 1998). It has been
clas-sified as ‘vulnerable’ by the IUCN (Reeves et al 2008). There is no current
abundance estimate for the species as a whole.
Incidental entanglement or bycatch of Franciscana dolphins was reported
repeatedly: Di Beneditto et al. (2001), Kinas (2002), Dans et al. (2003), Freitas
Netto and Barbosa (2003), Secchi (2003), Bordino and Albareda (2005), Cap-pozzo et al. (in press). IUCN defines incidental mortality in gillnet fisher -ies as the main threats to this spec-ies (Reeves et al. 2008). Secchi et al. (2001)
first estimated bycatch in the overall Franciscana population via population
abundances based on aerial surveys. They calculated that removal by gillnets ranged between 1.1% and 3.5% per year. The Scientific Committee of the In -ternational Whaling Commission has noted that incidental mortality of 1%
is sufficient for concern about the conservation future of coastal dolphins.
However the various assumptions and parameters of these estimations are
difficult to test. For example, Secchi et al. (2001) counted an average of 4.25
Spatial analysis of incidental
individuals per flight and extrapolated
an overall abundance of 42,000 Francis-cana dolphins (Reeves et al. 2008). It is expected that slight changes in param-eters assumptions could produce
sig-nificant changes to these results.
I used a spatial approach to ana-lyze the role of incidental mortality as a threat to Franciscana dolphins. I
com-pared information from different ar
-eas of their distribution with different levels of fishery activity. I followed the
main assumption of most habitat mod-els, i.e., that distribution of population abundance is positively related to habi-tat qualities (Guisan and Thullier 2005). If incidental entanglement is a main mortality factor, then areas with higher incidental mortality should have lower population densities.
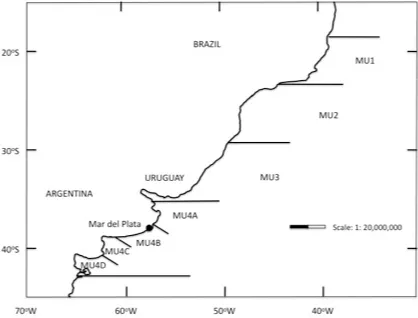
Based on the genetic structure of the species, Secchi et al. (2003) proposed four management units (MU) (Fig. 1). MU1= coastal waters of Espírito Santo
and Rio de Janeiro states, Brazil; MU2=
waters off Sao Pablo, Paraná and Santa
Catarina states, Brazil; MU3= waters
off Rio Grande Sul State (Brazil) and Uruguay; MU4= waters off Argentina.
Two studies have estimated abundance via aerial surveys for MU3 (Secchi et al.
2001) and MU4 (Crespo et al. 2009). In
MU3, 8 flights of equal length (185.4 km
except one of 129.8 km) with a single-engine aircraft were conducted at the end of summer 1996 and distributed equally between morning and
after-noon. In MU4, 17 flights were conducted
of variable lengths, ranging from 185.2 km to 564.9 km, with a double-engine aircraft in summer 2003 and autumn 2004. On the 13th and 18th of February,
two flights were conducted on the same day, thus afternoon flights were not
considered in the analyses to minimize
pseudo-replicate effects and dolphin
behavioral response to aircraft noise of
[image:16.612.137.555.411.729.2]the first daily flight. Relative abundance
Figure 1:
of Pontoporia in each MU is expressed as number of dolphins per km surveyed. I avoided the use of absolute estima-tions of abundance to minimize er-rors in parameter estimations of equa-tions. Because there are several reports from MU4 , I divided it in four sectors: MU4A, MU4B, MU4C (corresponding to northern, central and southern coasts of Buenos Aires Province, respectively), and MU4D, corresponding to northern coast of Patagonia (Fig. 1).
Di Beneditto (2003) provided sys -tematic data on annual incidental mor-tality rate from MU2 , Secchi et al. (2001) from MU3, and Bordino and Albareda
(2004) and Cappozzo et al. (2007) from MU4. Bycatch is expressed in ‘captures
per unit of effort’ (CPUE units), which
consisted of the number of dolphins killed in nets, divided by the km of
fishery nets of the total float, and the number of fishing days per year. At
MU1, there were no comparable
mea-surements of bycatch effect, but Netto
and Barbosa (2003) counted 13 records of Franciscana dolphins stranded along the Espirito Santo coast presenting wounds that may suggest interactions
with fisheries between 1994 and 2001.
MU1 and MU2 have similar
[image:17.612.73.374.87.499.2]character-istics with regard to fishery activity (Di
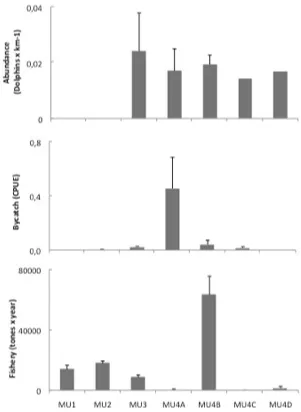
Figure 2:
Population abun-dances, bycatches
and artisan fishery
activity in the sixth areas of the distribu-tion range of Fran-ciscana dolphins. Captures per unit of
effort (CPUE) = 100 x
Beneditto and Netto 2008), therefore by -catch incidence at MU1 was estimated
using the same fishing effort calculated by Di Beneditto (2003). This value of
CPUE was included only for illustrative purpose, although it is well established that bycatch is comparatively very
low at MU1 (review by Di Beneditto and Netto 2008). Information on fish
-ing activity was obtained from official
websites of governmental agencies of Brazil and Argentina (date: 09/09/09)
who are responsible for fishery activity
regulation: Instituto Brasileiro do Meio Ambiente e dos Recursos Naturais
Ren-ováveis and Secretaría de Agricultura,
Ganadería, Pesca y Alimentación de la Argentina.
Data on abundance, bycatch
inci-dence and fishing activity are summa -rized in Figure 2. There were no
statisti-cal differences in the relative abundance
between MU3, MU4A, MU4B and MU4C
(Kruskal-Wallis ANOVA by ranks, H2 = 1.94, P = 0.38, n = 22 with data on MU4C and D together in a category).
Howev-er, there were significant differences in
bycatch incidence, mainly due to a sub-stantially high value observed in MU4A (H = 14.0, P = 0.007, n = 17) and in fish -ery activity, due to a substantially high value observed in MU4B (H = 40.7, P < 0.0001, n = 7 yrs x 7 areas). Cappozzo et al. (2007) provided information both on
Franciscana mortality and fishing effort
between 2002 and 2003 from 16 locali-ties of MU4A, B and C: San Clemente del Tuyu, Las Toninas, Santa Teresita, Mar del Tuyú, La Lucila del Mar, San Bernardo, Mar de Ajó, Villa Gesell, Mar del Plata, Quequén - Necochea, Cla-romecó, Monte Hermoso, Villa del Mar, Puerto Rosales - Ingeniero White. The
correlation of mortality and fishing ef -fort among these localities was not
sig-nificant (Spearman rank correlation, rs = 0.23, P = 0.41, n = 16).
In summary, there was no clear
positive relationship between fishery
activity and Franciscana mortality,
sug-gesting that catchability depends on several co-varying factors, such as me-teorological and economic conditions,
individual behavior of fishermen and
social and foraging behavior of the spe-cies (Crespo et al. 2009 ). For example, if dolphins tend to be more aggregated
and at the same time overlap with fish -ing areas, a clumped distribution pat-tern could be associated with predation
for sciaenid fish in nursery areas (Cre -spo et al. 2009 ).
Geographical differences on by
-catch mortality did not appear to influ -ence population abundance, given that the number of dolphins/km surveyed
between the areas did not differ. This
unexpected result could be caused by
various mechanisms: (1) different ini -tial population abundances between areas, (2) meta-population dynamics
that dilute geographical differences, (3) compensation of the detrimental effects by benefits of the use of nets, and/or (4)
overestimation of the impact of bycatch mortality on population growth rate. I
will briefly analyze each hypothesis.
1) There is no information of his-torical abundances of Franciscana’s dolphins, so it is not possible to test
directly the first mechanism. An indi -rect approach is to project a
popula-tion growth model into the past. Kinas
(2002) developed such model, with the equation:
N(t-1) = Nt/er(1-h
t) (1)
Kinas (2002) used, for MU3, a
growth rate of r = -0.053, and a fraction of the population dying in year t as a result of entanglement ht = 0.047. Secchi
et al. (2001) estimated total population size in MU3 as Nt = 42,078 dolphins in approximately 64.000 km2. At MU4A,
estimations are: Nt= 8,279 dolphins in approximately 22.000 km2 (Crespo et al.
to these estimations, present abundance proportion of MU3: MU4A is almost 5:1. Assuming the same value of r, con-stant impact of entanglements and lack of density-dependency, it is possible to apply equation (1) to predict popula-tion densities at MU3 and MU4A in the past. Applying this equation suggests that abundances in MU3 and MU4A could have been equalized 30 years be-fore. At that time, population density in MU4A should have been almost triple that in MU3. There are no obvious
rea-sons to expect such spatial differences
in population densities between Brazil
and Argentina when stranding effect
is eliminated or substantially reduced from calculations.
2) Another possibility is that those populations exposed to a high bycatch incidence retain high levels of popula-tion density due to immigrapopula-tion pro-cesses, as in a typical source-sink system (Pulliam 1988). However, recent studies using tracking devices on Franciscana dolphins showed that animals did not
tend to disperse significantly from the
target location, which suggests a clear
resident pattern for the studied animals
(Bordino and Wells 2005, Bordino et al.
2008). A new series of genetic studies
that identified several genetic stocks
along the relatively small geographic
range of this species confirms low lev -els of interaction between populations (Secchi et al. 2003, Mendez et al. 2008). These results do not support the source-sink model.
3) Another possible mechanism is that Franciscanas receive some kind of
benefit from artisan fishing that com-pensates the cost of entanglement. The
main potential benefit is facilitation of
food patch detection. Foraging theory
has investigated the effect of food dis -tribution on foraging behavior and its population consequences (Sutherland 1996). Fish schools are typically charac-terized as rich food patches with an un-predictable distribution. Marine
verte-brates develop foraging strategies that are designed to maximize food-search-ing strategies. Fishery gillnets facilitate
finding prey locationand bycatch can occur when predators are attracted to these overabundant and fixed patches
of food. This phenomenon is evident for seabirds for which gillnets do not normally represent a risk of passive en-tanglement, however, they may drown
when they actively attempt to snatch baited hooks deployed by longline fish -ing vessels (Gales 1997).
Díaz López (2006) described how
gillnet fishing appeared to benefit the Mediterranean bottlenose dolphin ( Tur-siops truncatus) in Sardinia, Italy. These dolphins were frequently observed feeding near the location of nets, sug-gesting dolphins try to exploit a concen-trated food source at gillnets. Interviews
of fishermen in Argentina revealed that
they frequently observe Franciscana dolphins near the boats when they in-stall gillnets (Negri, unpubl. data). It appears that, like Tursiops sp., Francis-cana dolphins also approach gillnet areas, although there is no evidence
that they increase foraging efficiency by doing so. If the benefit in terms of
survival and breeding success provided by this alternative source of food equals the cost due to incidental mortality, no
apparent effect will be measured in the
short term until the population collaps-es.
4) The final consideration is that the effect of incidental mortality rates have
been overestimated due to biases in es-timations of abundance. Equations for calculating population abundance and overall impact of entanglement require the use of several parameters. Poten-tial error terms of these parameters are
difficult to calculate. Field data are re -stricted to a small fraction of the coast-line representing only approximately 0.7% of the possible range in the MU3 subpopulation (Reeve et al. 2008). Thus,
-controlled and large error terms that re-duce reliability of conclusions. Reeve et al. (2008) stated that estimates of Fran-ciscana abundance and, consequently, of density or entanglement, need to be treated cautiously.
This paper provides the first ap -plication of a spatial approach to the analysis of anthropogenic threats to Franciscana dolphin survival. Bycatch does not produce the expected spatial
pattern in population abundance if in -cidental entanglement is a main threat to this species. Franciscana dolphins are threatened by several human im-pacts, other than bycatch, mainly: (1) water pollution, (2) human depletion of dolphin food, and (3) marine debris swallowed by the dolphins. Conserva-tion agencies do not have resources to solve all these problems at once, thus
criteria to define priorities is essential.
It is urgently required that research on Franciscana dolphins provides clues to evaluate the precise impact of inciden-tal bycatch on their conservation.
Acknowledgements
M. F. Negri kindly provided information on Franciscana dolphins. M. H. C is researcher of the the Argentinean Research Council (CONICET). GEMA group is supported by the Department of Basic Sciences from the University of Lujan and CONICET.
LITERATURE CITED
Bordino, P. and D. Albareda. 2004. Incidental mortality of Franciscana dolphin Pontoporia blainvillei in coastal gillnet fisheries in north -ern Buenos Aires, Argentina. Technical Paper SC/56/SM11 presented at the International Whaling Commission Meeting. Sorrento, Ita-ly.
Bordino, P. and R. S. Wells. 2005. Radiotracking of Franciscana Dolphins (Pontoporia blainvillei) in Bahia Samborombon, Buenos Aires, Argen-tina. 16th Biennial Conference on the Biology of Marine Mammals. San Diego, California. Bordino, P., R. S. Wells and M. A. Stamper. 2008.
Satellite tracking of Franciscana dolphins ( Pon-toporia blainvillei) in Argentina. Preliminary information on ranging, diving and social pat-terns. 130 Reunion de Trabajo de Especialistas en
Mamıferos Acuaticos de America del Sur. Monte-video, Uruguay.
Cappozzo, H. L., M. F. Negri, J. E. Pérez, F. Monzón, D. Albareda and J. F. Corcuera. 2007. Incidental mortality of Franciscana dolphin (Pontoporia blainville) in Argentina. Latino American Journal of Aquatic Mammals 6: in press, ISSN 1676-7497.
Crespo, E. A., G. Harris and R. González. 1998.
Group size and distributional range of the franciscana, Pontoporia blainvillei. Marine Mammal Science 14(4): 845-849.
Crespo, E. A., S. N. Pedraza, F. M. Grandi, L.
S. Dans and G. Garaffo. 2009. Abundance
estimation of Franciscana dolphins, Ponto-poria blainvillei, in Buenos Aires province, Argentina, from aerial surveys. Marine Mammal Science on line, DOI, 10.1111/j.1748-7692.2009.00313.x.
Dans, S., M. K. Alonso, S. N. Pedraza and E. A.
Crespo. 2003. Incidental catch of dolphins in
trawling fisheries off Patagonia, Argentina,
Can populations persist? Ecological Applica-tions 13: 754-762.
Di Beneditto, A. P. M. 2003. Interaction between gillnet fisheries and small cetaceans in north -ern Rio de Janeiro, Brazil: 2001–2002. Latin American Journal of Aquatic Mammals 2: 79-86.
Di Beneditto, A. P., R. Ramos and N. R. W. Lima.
2001. Sightings of Pontoporia blainvillei
(Ger-vais & D’Orbigny, 1844) and Sotalia fluviatilis
(Gervais, 1853) (Cetacea) in South-eastern Bra-zil. Brazilian Archives of Biology and Technol-ogy 44: 291-296.
Díaz Lopez, B. 2006. Interactions between
Medi-terranean bottlenose dolphins (Tursiops trunca-tus) and gillnets off Sardinia, Italy. ICES Jour -nal of Marine Science 63: 946-951.
Freitas Netto, R. F. and L. A. Barbosa. 2003. Ce
-taceans and fishery interactions along the
Espírito Santo State, Southeastern Brazil dur-ing 1994-2001. The Latin American Journal of Aquatic Mammals 2: 57-60. Gales, R. 1997. Al-batross populations: status and threats. Pages 20-45 in G. Robertson and R. Gales, eds.
Alba-tross biology and conservation. Surrey Beatty
and Sons, Chipping Norton.
Guisan, A. and W. Thuiller. 2005. Predicting
spe-cies distribution: offering more than simple habitat models. Ecology Letters 8: 993-1009. Kinas, P. G. 2002. The impact of incidental kills
by gillnets on the franciscana dolphin ( Ponto-poria blainvillei) in southern Brazil. Journal of Marine Science 70: 409-421.
Moore, J. E. and A. J. Read. 2008. A Bayesian uncertainty analysis of cetacean demography and bycatch mortality using age-at-death data. Ecological Applications 18: 1914-1931.
Netto, R. F. and L. A. Barbosa. 2003. Cetaceans and fishery interactions along the Espírito San -to State, southeastern Brazil during 1994–2001. Latin American Journal of Aquatic Mammals 2: 57-60.
Pulliam, H. R. 1988. Sources, sinks, and popu-lation regupopu-lation. American Naturalist 132: 652-661.
Read, A. J., P. Drinker and S. Northridge. 2006. Bycatch of marine mammals in the US and
global fisheries. Conservation Biology 20:
163-169.
Reeves, R. R., M. L. Dalebout, T. A. Jefferson, L. Karczmarski, K. Laidre, G. O’Corry-Crowe,
L. Rojas-Bracho, E. R. Secchi, E. Slooten, B. D.
Smith, J. Y. Wang, A. N. Zerbini and K. Zhou.
2008. Pontoporia blainvillei. In: IUCN 2009. IUCN Red List of Threatened Species. Version 2009.1. <www.iucnredlist.org>. Downloaded on 18 September 2009.
Secchi E. R., D. Danilewicz and P. H. Ott. 2003.
Applying the phylogeographic concept to identify Franciscana dolphin stocks: implica-tions to meet management objectives. Journal of Cetacean Research and Management 5: 61-68.
Secchi, E. R., P. H. Ott, E. A. Crespo, P. G. Kinas,
S. N. Pedraza and P. Bordino. 2001. Abundance estimation of Franciscana dolphin, Pontoporia blainvillei, stock from aerial surveys. Journal
of Cetacean Research and Management 3: 95-100.
Secchi, E. R., J. Y. Wang, B. Murray, C. C. Roccha-Campos and B. N. White. 1998. Populational
differences between Franciscanas, Pontoporia blainvillei, from two geographical locations as indicated by sequences of mtDNA control re-gion. Canadian Journal of Zoology 76: 1-6.
Shaughnessy, P. D., R. J. Kirkwood, M. Caw
-thorn, C. Kemper and D. Pemberton. 2003. Pinnipeds, cetaceans and fisheries in Austra -lia: a review of operational interactions. Pp. 135-156, in N. J. Gales, M. A. Hindell and R.
Kirkwood, R, eds. Marine mammals: fisheries,
tourism and management issues. CSIRO Pub-lishing, Washington, D.C.
Sims, M., T. Cox and R. Lewison. 2008.
Identify-ing spatial patterns in fisheries bycatch: usIdentify-ing
models to improve the stability of bycatch
esti-mates and aid fisheries management. Ecologi -cal Applications 18: 649-661.
Sutherland, W. J. 1996. From individual behav-iour to population ecology. Oxford University Press, Oxford.Taylor, B. L., M. Martinez, T.
Gerrodette, J. Barlow and Y. N. Hrovat. 2007.
Lessons from monitoring trends in abundance of marine mammals. Marine Mammal Science 23: 157-175.
Zydelis, R., J. Zydelis, H. Österblom, M. Ve-temaa, B. Schirmeister, A. Stipniece, M. Dagys, M. van Erden and S. Garthe. 2009. Bycatch
in gillnet fisheries – An overlooked threat to
Observations on the reproductive
seasonality of
Atlantoraja platana
(Günther, 1880), an intensively fished
skate endemic to the
Southwestern Atlantic Ocean
Abstract
Specimens of the La Plata skate (
Atlantoraja platana
) were collected
monthly from commercial fishing landings at Guarujá, São Paulo State,
Brazil, from March of 2005 to April of 2006. One hundred males
rang-ing from 13.1 to 70.0 cm and 88 females rangrang-ing from 12.5 to 76.0 cm
of total length were collected and their gonads analysed to determine
maturity stages. Gonadosomatic and hepatosomatic indexes did not
significantly vary among seasons between the sexes. Ovulation and
egg-laying were continuous throughout the year. These observations
suggest an annual cycle with eventual -though not well delimited-
peaks in the reproductive activity. This pattern has been reported for
skates of the same genus and for other species.
Atlantoraja platana
is
intensely exploited, though as a non-target species, and retained for
exportation over the South and Southeast Brazilian coast. For these
reasons the species is already considered ‘vulnerable’ by the IUCN
Red list of Threatened Species. Present data may be the base for future
studies in order to protect the populations of
A. platana
from local dis-
from local
dis-appearance.
Introduction
Genus Atlantoraja Menni, 1972, is endemic to the Southwestern Atlantic Ocean (McEachran and Aschliman 2004). The La Plata skate’s (Atlantoraja platana) (Günther 1880) distribution ranges from São Paulo’s littoral area to Argenti -na, and is common in Rio Grande do Sul State in Southern Brazil (Figueiredo 1977). In Southern Brazil, it is found at depths of 40-100 m (Vooren 1997), though Marçal (2003) recorded its occurrence at up to 231 m deep. In the Southeastern Brazilian continental shelf, A. platana is commonly caught in the range of 20-120 m deep (Oddone and Amorim 2007).
The assessment of chondrichthyan populations requires a quantitative approach to the study of reproduction (Walker 2005). Oddone and Amorim (2007) reported the size at maturity of male and female A. platana in South-eastern Brazil. Data on the reproduction of A. platana were also provided by Marçal (2003), Oddone et al. (2008) and Oddone and Vooren (2008). How-ever, so far, the trend in the seasonality of the reproduction of this species is
unknown. But Vooren and Klippel (2005) demonstrated that intensive fisher
-Maria Cristina
Oddone
1,2Gonzalo Velasco
1 1Instituto de Oceanografia, Universidade Federal do Rio Grande, Caixa Postal 474, CEP 96201-900, Rio Grande-RS, Brazil.ies in the South-western Atlantic have led to overexploitation of several spe-cies of demersal elasmobranchs, such as the congeneric Atlantoraja castelnaui and
A. cyclophora, already ‘endangered’ and ‘vulnerable’ species according to the IUCN Red list of Threatened Species. (Hozbor et al. 2004, Massa et al. 2006 ).
Over the past thirty years, catches of rajoids (skates) have increased in the
western Atlantic, mainly as a by-catch of
bony-fish target fisheries, yet, sustaina -ble catch rates are completely unknown (Frisk et al. 2002). This situation is also valid for the Brazilian continental shelf,
where bottom trawling fisheries affect
populations of A. Platana, which is in-cidentally captured. Thus, the knowl-edge of all the events compounding the reproduction of a species needs to be
known in order to make decisions on stock management of chondrichthyan
fishes.
The conservation status of A. pla-tana is considered ‘vulnerable’ by the IUCN Red list of Threatened Species
(San Martin et al. 2007). This is a matter
of concern for a commercially exploited species because when life history char-acteristics are coupled with the selective
removal of large individuals (as is the case for this species) of a given
popu-lation subjected to intense fishery pres -sure, such a population may become highly susceptible to overexploitation and even disappearance, as has been the case for several rajoids (Brander 1981; Hoenig and Gruber 1990). Speci-mens of Atlantoraja spp. are commonly
[image:23.612.59.486.258.576.2]landed and sold in Santos and Guarujá
Figure 1:
Map of the study area, southeast Brazil, south-western Atlantic Ocean. Symbols represent the
(São Paulo state, Brazil), especially the larg -est individuals (Oddone, unpublished data). In the present paper, we aim to analyze the trend of the reproductive variables for A. platana on an annual basis for this speciesin southeastern Brazil , which is critical infor-mation for developing a successful conser-vation program.
Materials and Methods
Specimens of Atlantoraja platana were
col-lected monthly from commercial fishing landings at Guarujá, São Paulo State, Brazil,
from March of 2005 to April of 2006 by eight
fishing vessels regularly bringing (once or
twice a month) samples of this species. The study area was situated between latitudes 23°37’S and 27°40’S, at depths between 10 and 120 m (Fig. 1).
Specimens were measured to the near-est millimetre below in total length (TL) and
weighted as gutted (MG) mass (g). Gonad and liver weight (g) were recorded for both sexes. Electric scales used had 1 and 5 g pre-cision. For weighting material of less than
1.0 g, a precision scale was used. Classifica -tion of the specimens by maturity stage was
done according to criteria defined by Odd -one et al. (2007) for Rioraja agassizi (Müller and Henle, 1841). The presence of sperm in the males’ seminal vesicle was noted.
To compare the reproductive activity in males and females among seasons, the gona-dosomatic and hepatosomatic indexes were calculated as: GSI=(gonad weight/MG)*100 and HSI=(liver weight/MG)*100, respective-ly. To use parametric/non-parametric tests, normality and homoscedasticity of the vari-ables were tested by Lilliefors’ and Levene’s tests, respectively. Parametric comparisons were performed using a Student t-test. Comparisons among monthly HSI and GSI
were performed using Kruskal-Wallis’
H-test (Sokal and Rohlf 1995). Variables range was expressed along with the mean value and the standard deviation, as ‘range (mean
±SD)’. Significance level considered in all
[image:24.612.137.533.432.722.2]cases was 0.05.
Figure 2:
Results
In all, 100 males ranging from 13.1 to 70.0 cm of total length (TL) were collect-ed for analysis. Regarding the females, a total of 88 specimens ranging from 12.5 to 76.0 cm TL were recorded.
The HSI peaked in summer for the females, while it was lowest for
the males. However, it did not signifi -cantly vary among seasons in males (H(3,10)=6.67, p=0.0830) nor females (H(3,10)=1.34, p=0.7184) (Fig. 7a). Just the
opposite pattern was observed for the
GSI, which showed a trend to be low-est in summer for the females, when was highest for the males. This
varia-tion of the GSI was neither significant
for males (H(3,10)=3.37, p=0.3515) nor for females (H(3,9)=2.84; p=0.4162, Fig. 7b).
Egg-bearing females were observed in spring (n=2), summer (n=2) and win-ter (n=1). Males with sperm in the semi-nal vesicle were caught in spring (n=2) and summer (n=3).
Discussion
We are aware that much more data should be obtained in order to infer the reproductive cycle of this species. How-ever, this species occurs less frequently than other rajoids in the SE Brazil trawl
fisheries’ catches, as shown by Oddone
(2007). Nevertheless, according to the observations presented in this paper and information about this species in other regions, and even other related species in the same region, we inferred that female A. platana undergo an annu-al cycle, with continuous reproduction throughout the year, and eventual sea-sonal variation (though not statistically
significant). Marçal (2003) analysed the
reproductive trends of A. platana for summer and winter in Southern Brazil, recording the GSI and HSI of egg-bear-ing females in both seasons and found no seasonal variation.
[image:25.612.60.416.92.358.2]Our hypothesis of lack of seasonal-hypothesis of lack of seasonal-ity in the reproduction of A. platana is,
Figure 3:
as stated above, reinforced by observa-tions done in other species inhabiting the Southwestern Atlantic, including those belonging to the genus Atlantoraja
Menni, 1972, i.e., A. castelnaui (Ribeiro, 1907) and A. cyclophora (Regan, 1903). Oddone and Vooren (2005) proposed that A. cyclophora in Southern Brazil have an annual cycle with continued re-productive activity, but with no peaks; or an annual cycle with at least one peak in reproductive activity in spring and/or autumn. Oddone et al. (2008), with a large data set for the same spe-cies elsewhere, demonstrated that the second hypothesis was correct. A
simi-lar pattern, with a peak in the GSI and
HSI detected in autumn was reported for female A. castelnaui for the area in question (Oddone et al., 2008).
For other sympatric genera, as Rio-raja Whitley, 1939 (also endemic to the southwestern Atlantic), it was observed that for the southeastern Brazilian area,
R. agassizi has an annual cycle, also with year long ovulation that peaks twice a year (during Sep-tember and De-cember, austral Spring) (Oddone et al., 2007). In Argentinean and Uruguayan wa-ters, Colonello et al. (2007) also re-corded continu-ous reproduction for R. agassizi, with a peak in the reproductive activity of males during late