Open Access
Research article
Validation and reproducibility of computerised cell-viability analysis
of tissue slices
NM Jomha*, PC Anoop, Janet AW Elliott, K Bagnall and LE McGann
Address: University of Alberta, Edmonton, Alberta, Canada
Email: NM Jomha* - [email protected]; PC Anoop - [email protected]; Janet AW Elliott - [email protected]; K Bagnall - [email protected]; LE McGann - [email protected]
* Corresponding author
cell countingcomputerised viability assessmentchondrocytesreproducibilitytissue slices
Abstract
Background: The identification of live cells using membrane integrity dyes has become a frequently used technique, especially with articular cartilage and chondrocytes in situ where tissue slices are used to assess cell recovery as a function of location. The development of a reproducible computerised method of cell evaluation would eliminate many variables associated with manual counting and significantly reduce the amount of time required to evaluate experimental results.
Methods: To validate a custom computerised counting program, intra-person and inter-person cell counts of nine human evaluators (three groups – unskilled, novice, and experienced) were compared with repeated pixel counts of the custom program on 15 digitised images (in triplicate) of chondrocytes in situ stained with fluorescent dyes.
Results: Results indicated increased reproducibility with increased experience within evaluators [Intraclass Correlation Coefficient (ICC) range = 0.67 (unskilled) to 0.99 (experienced)] and between evaluators [ICC = 0.47 (unskilled), 0.85 (novice), 0.93 (experienced)]. The computer program had perfect reproducibility (ICC = 1.0). There was a significant relationship between the average of the experienced evaluators results and the custom program results (ICC = 0.77).
Conclusions: This study demonstrated that increased experience in cell counting resulted in increased reproducibility both within and between human evaluators but confirmed that the computer program was the most reproducible. There was a good correlation between the intact cell recovery determined by the computer program and the experienced human evaluators. The results of this study showed that the computer counting program was a reproducible tool to evaluate intact cell recovery after use of membrane integrity dyes on chondrocytes in situ. This and the significant decrease in the time used to count the cells by the computer program advocate its use in future studies because it has significant advantages.
Background
Assessment of cell recovery in tissues using membrane in-tegrity dyes has become a frequently used technique. This is especially so with articular cartilage and chondrocytes in
situ because the embedding of cartilage cells within the complex matrix makes other techniques such as cell cul-ture and metabolite production impractical. However, there is minimal literature that documents the
Published: 21 March 2003
BMC Musculoskeletal Disorders 2003, 4:5
Received: 3 December 2002 Accepted: 21 March 2003
This article is available from: http://www.biomedcentral.com/1471-2474/4/5
effectiveness or reproducibility of the methods used to count intact cells versus disrupted cells. Such literature is important because the manual counting of cells has the potential for significant variation within/between evalua-tors, within/between studies and between labs. It is also very time consuming. The development of a reproducible, computerised method of cell evaluation after staining with membrane integrity dyes would eliminate many of the variables associated with manual counting. Impor-tantly, the same program could be used by different labs allowing direct comparison of results between labs. Fur-thermore, a computerised method could perform the task in a small fraction of the time required by a human, result-ing in huge time and cost savresult-ings.
Membrane integrity stains such as Syto 13, fluorescein diacetate (FDA) and ethidium bromide (EB) have been used successfully in determining cell integrity in intact ar-ticular cartilage [1–6] and have demonstrated the best cor-relation with long-term survival after transplantation in articular cartilage [7]. Membrane integrity stains aid in evaluating cell viability by inferring that cells with disrupt-ed membranes are dead [8] while those with intact mem-branes have at least retained the possibility of being intact and viable. By combining the nuclear binding stains Syto 13 and EB, contrasting colours (green and red, respective-ly) can be observed for differentiation purposes. Intact cells will allow uptake of Syto 13 and exclude the EB re-sulting in green fluorescence when viewed under fluores-cence microscopy. Conversely, cells with disrupted membranes allow uptake and binding of EB as well as the Syto 13 and these cells will stain red or yellow, enhancing the ability to differentiate between cells with intact and disrupted cell membranes. These stains can be used in situ
so that cell recovery as a function of location within the matrix can be determined and neither fixation nor embed-ding is required to obtain cartilage sections.
Colour differentiation is not always distinct with chondrocytes in situ because of the surrounding cartilage matrix. The matrix may partially absorb the stains making the distinction of cells from the background less well de-fined. Additionally, minor membrane leakage results in less complete EB uptake producing cells of a lighter red or yellow colour further confusing the distinction between intact and disrupted cells. This subjective aspect of the evaluation created inconsistencies between human evalu-ators and led to the development of a computer cell-counting program to provide a reproducible determina-tion of the percentage of intact cells versus disrupted cells.
The program design was based on the same principles as colorimetry [9], which measures light intensity at different wavelengths. Colorimetry is a well-established technique and although this technique does not identify individual
cells, it is used widely to determine the relative percentage of involved cells when compared to a control group. Based on these principles, a computer program was de-signed to provide the percentage of green pixels (Syto 13 stain) versus red pixels (EB stain) after elimination of the background in a digitised image.
A reproducible method of evaluating intact cell recovery is required to adequately evaluate results from experimental procedures with chondrocytes in situ. It was hypothesized that the computer counting program was more reproduc-ible than human cell evaluation because of the variability both within and between humans. This study examined the inter-person and intra-person reproducibility of nine human subjects (divided into three groups) on digitised images of chondrocytes in situ stained with fluorescent dyes and compared the results to the computer assess-ment of the images.
Methods
Fifteen digitised images from previous experiments on pig articular cartilage were collected. Osteochondral dowels of 10 mm diameter had undergone various experimental conditions that included exposure to dimethyl sulfoxide (1 M, 3 M, 6 M) followed by slow cooling (2-stage cryop-reservation [10,11]), or rapid cooling by plunging into liquid nitrogen [1]. After the experimental procedures, 70 µm slices were removed using a Vibratome® (TPI, St.
Lou-is, Missouri) sectioning from the articular surface to the cartilage-bone junction across the widest portion of the dowel. The slices were stained using membrane integrity dyes of ethidium bromide (EB; Sigma, St. Louis, MO) and Syto 13 (Molecular Probes, Eugene, OR) (200 µM EB with 50 µM Syto mixed in PBS). Cells with intact membranes stained green due to the absorption of the Syto stain with the exclusion of the EB stain. Cells with disrupted mem-branes could not exclude the EB stain and therefore stained red. The slices were viewed using a Leitz fluores-cence (440–480 nm) microscope (Leitz, Germany) using a 10X objective and a tube factor of 0.63X. Digital images (800 × 600 pixels) were recorded using a digital camera (Pixera DiRactor, Pixera Corporation, Los Gatos, CA) and stored on computer.
Figure 1
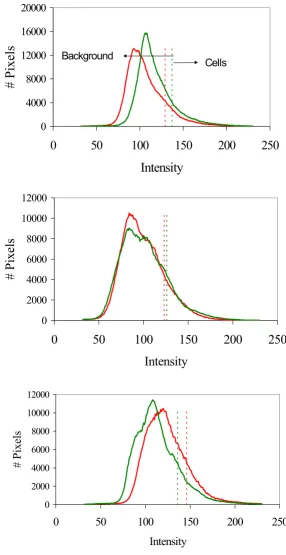
Computer generated histograms from 3 different images after staining with EB and Syto 13. The red line characterizes the rel-ative pixel intensity of the red pixels. The green line characterizes the relrel-ative pixel intensity of the green pixels. The vertical red and green dotted lines indicate the threshold determined by the empirical 85% pixel cutoff determined by the cumulative histograms seen in Figure 2. "# pixels" indicates number of pixels.
,QWHQVLW\
3L[HOV
,QWHQVLW\
3L[HOV
&HOOV %DFNJURXQG
,QWHQVLW\
Figure 2
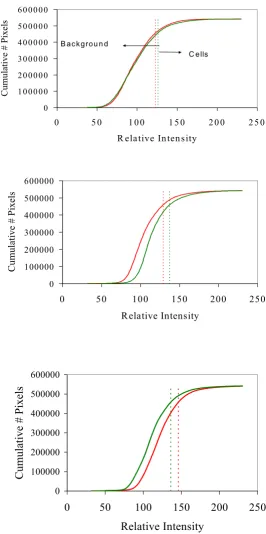
Computer generated cumulative histograms corresponding to the histograms seen in Figure 1. The red and green dotted lines demarcate the 85th percentile of pixels, which was used as the threshold level for pixel intensity. This threshold intensity,
shown in both Figures 1 and 2, was used to differentiate between the background pixels (to the left of the line) and the cell pix-els (to the right of the line).
5HODWLYH,QWHQVLW\
&XPXODWLYH3L[HOV
5HODWLYH,QWHQVLW\
&XPXODWLYH3L[HOV
5 HODWLYH,QWHQVLW\
&XPXODWLYH3L[HOV
image by using the intensity of the pixels at the 85th
per-centile, which was empirically selected to minimize inclu-sion of background and maximize incluinclu-sion of cells over a wide variety of backgrounds and intensities. This was the only empirical input used in the computer program.
Pixels above the threshold intensity for each colour were designated to be red, green, or black using the following algorithm.
If ((Ired > Thred) and (Ired > Igreen))
then Igreen is set to zero, Iblue is set to zero, and Ired
re-mains
else
if ((Igreen > Thgreen) and (Igreen > Ired))
then Ired is set to zero, Iblue is set to zero, and Igreen re-mains
else the pixel is set to black
where Ired, Igreen, and Iblue are the red, green, and blue in-tensities of a pixel, Thred and Thgreen are the threshold in-tensities for red and green. Application of this algorithm to representative images in Figure 3 resulted in the proc-essed images in Figure 4. The sum of red and green pixel intensities was reported for each image to represent the percentage intact (green) and disrupted (red) cells. This
computed percentage recovery was 100%, 55%, and 8% for images A, B, and C, respectively.
Fifteen slices were selected with varying proportions of green and red cells. Three copies of each image were made with one being the original image, one a mirror image, and one rotated 180° to make it difficult for each observer to identify the pictures. The 45 images were arranged in random order for assessment. Three groups of three hu-man evaluators were selected. The "unskilled" group con-sisted of three people (US1, US2, US3) with computer entry experience but no science research or cell counting background. The "novice" group consisted of three people (NV1, NV2, NV3) with less than one year of science re-search background but no experience counting cells. The expert group consisted of three people (EX1, EX2, EX3) with a greater than one year science research background and some experience counting cells. All evaluators were provided with the same instructions. The total number of green and red cells for each of the 45 images was recorded by clicking the computer cursor on each cell to demarcate it as green or red with the totals recorded by a data collec-tion program.
The computer counting program scanned each of the same 45 images and the percentage of green pixels com-pared to red pixels was recorded as previously described.
[image:5.612.84.526.101.255.2]The results were tabulated and statistical analysis was per-formed including Intraclass Correlation Coefficient (ICC) within (Intra-Rater) human evaluators and between (In-ter-Rater) humans and/or computer in addition to 95%
Figure 3
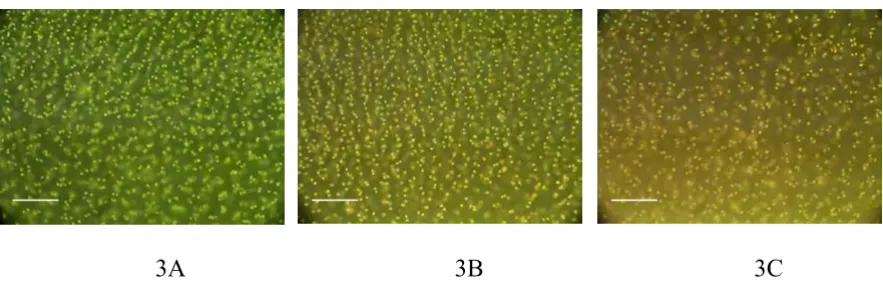
Digitised images of the three different cartilage slice sections from which the histograms in Figures 1 and 2 were generated. These images demonstrate what the human evaluators saw when attempting to quantitatively assess the distribution of red and green cells. The white line in the bottom left corner represents 100 µm.
$
%
&
confidence intervals using SPSS-10.07 (SPSS Inc, San Ra-fael, CA).
Results
Table 1 demonstrates the ICC within all evaluators and the computer program and indicates that evaluators with more experience were more reproducible when repeating counts on the same image (Intra-Rater) while the compu-ter program was perfectly reproducible (ICC = 1.0). Table 2 shows the ICC between the groups of evaluators (Inter-Rater) and indicates that increased experience of the eval-uators resulted in increased correlation between individu-als. The experienced group had an excellent correlation between the individuals (ICC = 0.93). When the results from the computer program were included with the re-sults from the experienced human evaluators, the ICC = 0.84 indicated a very good correlation between the expe-rienced human evaluators and the computer program.
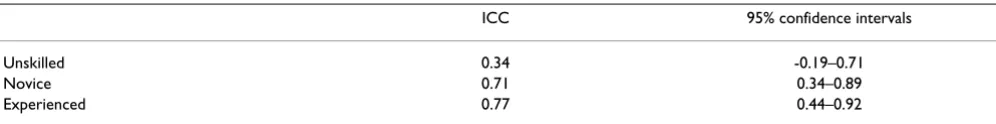
Table 3 shows the ICC with 95% confidence intervals cal-culated by comparing the average results within each group for each digitised image with the results from the computer program.
The ratio of green to red was consistently but not invaria-bly assessed higher by humans than by the computer pro-gram. The ICC of the novice and experienced groups were closely correlated with larger 95% confidence intervals in the novice group. The unskilled group had no correlation with the computer program.
Discussion
The purpose of this study was to validate the use of a cus-tom computer counting program to be used in place of human evaluation of chondrocytes in situ after staining with membrane integrity dyes. The results of this study supported the hypothesis that the computer counting pro-gram was the most reproducible method of counting chondrocytes in situ after staining with membrane integri-ty dyes. As expected, the computer program had perfect re-producibilityin evaluating the three copies of the 15 digitised pictures (ICC = 1.0) while there was always some error with the human evaluators. The best human evalua-tor (EX3) came close to the computer program's reproduc-ibility (ICC = 0.99) but as experience decreased, the reproducibility decreased (Table 1). In addition, the high-est correlation between the three most experienced evaluators was ICC = 0.93, with decreasing correlation be-tween evaluators with less experience (Table 2). Although the results of this experiment showed that experience in science research and cell counting increased reproducibil-ity (higher Intra-Rater ICCs and Inter-Rater ICCs), the computer program was consistently the most reproducible.
[image:6.612.72.531.95.228.2]Table 3 demonstrates that there was a good correlation be-tween the two methods of cell evaluation (ICC = 0.77) but it was noted that the humans consistently (with occasion-al exceptions) assessed the ratio of green to red as a higher value than the computer program. This was likely due to the colours at the threshold (yellow), more likely consid-ered green by humans and red by computer pixel intensity determination. The use of membrane integrity dyes is a
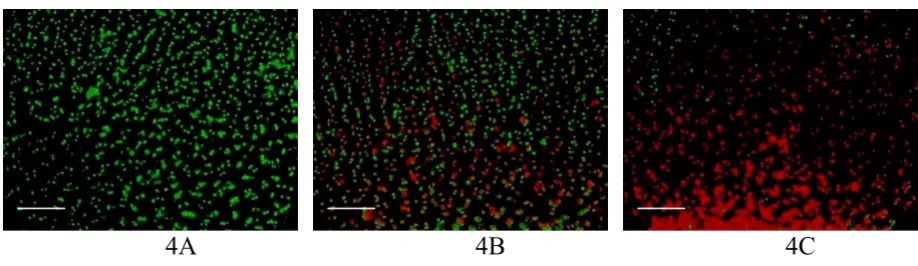
Figure 4
Computer generated images after processing by the computer program as a result of the application of the algorithm to the images in Figure 3. Figure 4A shows that the vast majority of cells are intact (green) while Figure 4B shows a mixed combina-tion of intact (green) and disrupted cells (red). Figure 4C shows that most cells are disrupted (red). The white line in the bot-tom left corner represents 100 µm.
$
%
&
well-accepted method of preliminary assessment of cell recovery after experimental protocols. Currently, manual counting is the only method of cell evaluation of chondrocytes in situ after membrane integrity staining. The custom computer program demonstrated sufficient correlation with the manual counting of experienced hu-man evaluators to warrant its use in the described situa-tion. It is not possible to determine the accuracy of the computer program because there is no absolute measure of viable chondrocytes in situ for comparison in these im-ages because there are difference sources of errors in the computer and human assessments. This program is an im-provement over human evaluators because of inherent in-consistencies noted within and between humans. In addition to being more reproducible than humans, the
program is much quicker and significantly increases the amount of time required to evaluate the cells.
[image:7.612.53.554.109.244.2]Membrane integrity has become a popular method of de-termining cell viability, especially with articular cartilage [1–6,12]. This has been supported by evidence of good correlation between a high proportion of cells with membrane integrity and successful outcome after trans-plantation [7]. The difficulty of using membrane integrity dyes with chondrocytes in situ stems from the absorption of some stain into the background matrix. The necessity of maintaining the background while evaluating chondro-cytes in situ can make differentiating colours more diffi-cult and also can provide an optical illusion with respect Table 1: Intra-Rater ICC for all human evaluators and the computer program. There was increased reproducibility, in general, with increased experience. EX3 demonstrated the highest ICC (0.99) while the computer program was perfectly reproducible (ICC = 1.00).
Evaluator ICC
[image:7.612.52.554.339.401.2]US1 – unskilled 0.75 US2 – unskilled 0.78 US3 – unskilled 0.67 NV1 – novice 0.89 NV2 – novice 0.88 NV3 – novice 0.91 EX1 – experienced 0.87 EX2 – experienced 0.97 EX3 – experienced 0.99 Computer program 1.00
Table 2: Inter-Rater ICC within each group and including the computer program. The "ICC with computer program" denotes the ICC when the results from the computer program were included in the results with the human evaluators. The experienced evaluators demonstrated an excellent ICC (0.93) when compared to each other and when the computer program results were included (0.84). The novices also demonstrated a very good correlation (0.85) within their group but there was a further decrease in the ICC when the computer program was included (0.75). The unskilled group had no correlation (0.47 and 0.36).
ICC without computer program ICC with computer program
Unskilled 0.47 0.36 Novice 0.85 0.75 Experienced 0.93 0.84
Table 3: ICC with 95% confidence intervals
ICC 95% confidence intervals
[image:7.612.57.555.453.515.2]to the colours seen by different cell counters. The difficul-ties can be readily appreciated in the Figure 3 images.
Figure 4 shows that after application of the computed al-gorithm, the differentiation between red and green be-comes much more distinct, and visually correlates with the images seen in Figure 3. The selected cutoff at the 85th
percentile pixel intensity ensured that variations between absorption of stain into the matrix, minor variations in stain intensity created during mixing, and lighting differ-ences in the microscope were eliminated. The images in Figure 4 demonstrate an advantage of using combined stains. The distribution of the relative amounts of red/ green can be visualised and the recovery of cells as a func-tion of locafunc-tion within the matrix can provide valuable in-formation regarding mechanisms of cell injury during cryopreservation. Indeed, characteristic patterns of cell re-covery can be consistently found with specific experimen-tal protocols [1,13]. The computer program provided a consistent and reproducible method of measuring intact cell recovery that can be used to compare results between different experimental techniques and between different labs.
Cost is an important factor in research. Counting of stained cells in one experiment has taken up to 435 hours when performed by a human evaluator [13]. This same cell evaluation can be completed in seconds when using the computer program (to assess the digital images), dras-tically reducing the cost involved but, more importantly, allowing increased numbers of samples to be evaluated which significantly increases the reproducibility within the experiment [14].
The use of the computer program does raise some con-cerns although some of these are the same as for human evaluation. The method described provides the ratio of pixel intensities that are representative of the cellular ex-perimental outcome and not the individual cell count it-self. Counting of individual cells is extremely difficult for humans, especially in tissues of high cell density like artic-ular cartilage and these counts are prone to the same er-rors as automated counting. Cells that stain green are considered alive because their membranes are intact. This results in an upper limit for recovery, because the cells may have sustained lethal injury that has not yet resulted in loss of membrane integrity, one of the final events of cell death [8,15,16]. It has been suggested that cells that have some membrane damage, and thus may be permea-ble to EB, can repair this membrane damage and those cells may survive [17]. Conversely, some cell damage may be due to intracellular events and may not have pro-gressed to membrane disruption by the time the stains are applied [17]. Nevertheless, assessment of membrane
in-tegrity is a useful method in situations where the plasma membrane is a likely target for injury.
In conclusion, this experiment provided evidence that a custom computer counting program was more reproduci-ble than human cell evaluators, and was shown to be a valid method for determination of chondrocyte recovery
in situ after membrane integrity staining. The computer program can provide a useful method of measuring cell outcomes after experimental procedures on tissues sys-tems, while reducing the time and costs involved. It can also allow comparison of results between labs without considering the variations between human evaluators.
Acknowledgements
The authors thank Lauren Beaupre for statistical analysis. JAW Elliott holds a Canada Research Chair in Interfacial Thermodynamics. Funding was pro-vided by University of Alberta Hospital Foundation, Edmonton Civic Em-ployees Charitable Assistance Fund, and the Edmonton Orthopaedic Research Society.
References
1. Jomha NM, Anoop PC, Bagnall K and McGann LE Effects of increas-ing concentrations of dimethyl sulfoxide durincreas-ing cryopreser-vation of porcine articular cartilage Cell Pres Tech 2002,
1(2):111-120
2. Muldrew K, Chung M, Novak K, Schachar NS, Zernicke RF, McGann LE, Rattner JB and Matyas JR Evidence of chondrocyte repopula-tion in adult ovine articular cartilage following cryoinjury and long-term transplantation Osteoarthritis Cartilage 2001,
9(5):432-439
3. Jomha N Cryopreservation of human articular cartilagein
Ex-perimental Surgery, Masters ThesisUniversity of Alberta: Edmonton 1996,
4. Muldrew K, Hurtig M, Novak K, Schachar N and McGann LE Locali-zation of freezing injury in articular cartilageCryobiology 1994,
31(1):31-38
5. Bujia J, Kremer D, Sudhoff H, Viviente E, Sprekelsen C and Wilmes E
Determination of viability of cryopreserved cartilage grafts
Eur Arch Otorhinolaryngol 1995, 252(1):30-34
6. Ohlendorf C, Tomford WW and Mankin HJ Chondrocyte survival in cryopreserved osteochondral articular cartilageJ Orthop Res 1996, 14(3):413-416
7. Schachar NS, Novak K, Hurtig M, Muldrew K, McPherson R, Wohl G, Zernicke RF and McGann LE Transplantation of cryopreserved osteochondral Dowel allografts for repair of focal articular defects in an ovine modelJ Orthop Res 1999, 17(6):909-919 8. Malinin TI Injury of human polymorphonuclear granulocytes
frozen in the presence of cryoprotective agentsCryobiology
1972, 9(2):123-130
9. Mosmann T Rapid colorimetric assay for cellular growth and survival: Application to proliferation and cytotoxicity assays
J Immunol Methods 1963, 65:55-63
10. McGann LE and Farrant J Survival of tissue culture cells frozen by a two-step procedure to -196 degrees C. II. Warming rate and concentration of dimethyl sulphoxide Cryobiology 1976,
13(3):269-273
11. McGann LE and Farrant J Survival of tissue culture cells frozen by a two-step procedure to -196 degrees C. I. Holding tem-perature and timeCryobiology 1976, 13(3):261-268
12. Muldrew K, Novak K, Studholme C, Wohl G, Zernicke R, Schachar NS and McGann LE Transplantation of articular cartilage following a step-cooling cryopreservation protocolCryobiology
2001, 43(3):260-267
13. Jomha NM, Anoop PC and McGann LE Chondrocyte recovery in cryopreserved porcine articular cartilage after bone carrier alterationCryo Letters 2002, 23(4):263-268
14. Gundersen HJ and Osterby R Optimizing sampling efficiency of stereological studies in biology: or 'do more less well!' J
Publish with BioMed Central and every scientist can read your work free of charge "BioMed Central will be the most significant development for disseminating the results of biomedical researc h in our lifetime."
Sir Paul Nurse, Cancer Research UK
Your research papers will be:
available free of charge to the entire biomedical community
peer reviewed and published immediately upon acceptance
cited in PubMed and archived on PubMed Central
yours — you keep the copyright
Submit your manuscript here:
http://www.biomedcentral.com/info/publishing_adv.asp
BioMedcentral
15. Tavakol K, Miller RG, Bazett-Jones DP, Hwang WS, McGann LE and Schachar NS Ultrastructural changes of articular cartilage chondrocytes associated with freeze-thawing J Orthop Res
1993, 11(1):1-9
16. Malinin TI, Mnaymneh W, Lo HK and Hinkle DK Cryopreservation of articular cartilage. Ultrastructural observations and long-term results of experimental distal femoral transplantation
Clin Orthop 1994, 303:18-32
17. McGann LE, Yang HY and Walterson M Manifestations of cell damage after freezing and thawingCryobiology 1988, 25(3): 178-185
Pre-publication history
The pre-publication history for this paper can be accessed here: