2019 International Conference on Artificial Intelligence and Computing Science (ICAICS 2019) ISBN: 978-1-60595-615-2
The Granular Differentiation Model of Rural Poverty
Based on Data Mining
Sen WANG
1, Yan-sui LIU
2, 3*and Zhen-qiang WU
11School of Computer Science, Shaanxi Normal University, Xi’an, China
2Institute of Geographic Science and Natural Resources Research, CAS, Beijing, China
3Center for Assessment and Research on Targeted Poverty Alleviation, CAS, Beijing, China
Keywords:Information granularity, Data mining, Poverty differentiation characteristics.
Abstract. Rural poverty is a hot topic around the world, and the precision of policy making become the key of China's poverty alleviation strategy in the new era. Based on the theory of information granularity in artificial intelligent domain, this study deeply analyzed the massive data from the targeted poverty alleviation big data platform by data mining, and then constructed a Granular poverty differentiation model to identify poverty differentiation characteristics at different levels of granularity in parts of China. We build a knowledge base to support the policy making of targeted poverty alleviation. This result can well support the research of China’s rural poverty.
Introduction
China has making great contributions for poverty reduction in the world [1]. However, large
population and extreme poverty is becoming an intractable obstacle to the development of China [2].
From the existing research results, these researches on China’s rural poverty are mainly focused on rural poverty system, poverty differentiation characteristics and the cause of poverty [3,4]. There are
many methods used in these fields [4,5,6,7,8,9].
However, first, these methods lack correlation analysis across multiple geographic levels. Next, in the study of poverty characteristics, they are mainly based on qualitative description. These studies are difficult to provide the required quantitative indicators in the geographical division and poverty classification. Finally, with the development of targeted poverty alleviation, China has established many large data platforms for precise poverty alleviation [10]. The poverty information
obtained from different data platforms is too chaotic to increase the available knowledge or directly support precise poverty alleviation policies. Therefore, how to obtain valuable information from the massive data, and how to extract the knowledge and associate them at different levels is the key to solve these problems of targeted poverty alleviation.
Based on the theory of information granularity in artificial intelligent domain, this study deeply analyzed the massive data from the targeted poverty alleviation big data platform by data mining, and then constructed a Granular poverty differentiation model to identify poverty differentiation characteristics at different levels of granularity in parts of China.
Data and Methods
Data Description
The data used to study the characteristics of poverty differentiation in this paper mainly come from household survey data of 236 poor villages in five regions A, B, C, D and E. The data includes the basic situation of poor villages, infrastructure, public services, production conditions, social resources and other content.
Method
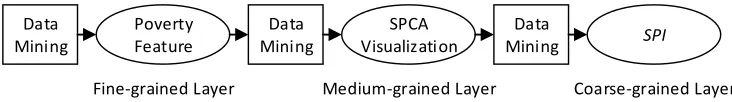
Information Granularity Theory. Based on information granularity theory, [11] poverty feature
feature classification to form a medium-grained level and SPI is counted to form a coarse-grained level for poverty classification. The structure of the poverty-differentiated feature granularity model is shown in Fig.1
Data Mining
Data Mining
Data Mining
Fine-grained Layer Poverty Feature
SPCA
Visualization SPI
[image:2.612.117.483.117.168.2]Medium-grained Layer Coarse-grained Layer
Figure 1. The structure diagram of poverty different characteristic granular model.
Data Mining of Poverty Feature Items. FP-Growth algorithm is used for data mining to extract potential association rules from the massive data of different big data platforms. This algorithm obtains the result with strong correlation by capturing frequently occurring poverty feature items. Its frequency is the support degree of the FP-Growth algorithm, and its calculation formula is as shown in Eq.1.
up( ⇒ ) = ( ∪ ) = ( ∪ )
( ) (1)
In Eq.1: F and G are two poverty feature sets in a certain region. S is the total number of all poverty feature items.
SPCA Model. To correlate and quantify the degrees of rural poverty in different regions, SPCA model is used to quantitatively analyze the extent of rural poverty in different regions and build a geographical poverty structure according to china's poverty status. The SPCA model is shown in Fig.2.
Labor
Social
resources Diet
Production Financial assets Disaster
Interaction
Poverty alleviation
policy Interaction
Causes of poverty
Livelihood Strategy
Precision assistance Ecological
[image:2.612.140.466.373.497.2]strategy
Figure 2. The model of SPCA.
SPCA model classified poverty characteristics mainly formed by five indexes: labor, diet, financial assets, production, and social resources.
Sustainable Poverty Index. SPI is used to quantify the sustainability of poverty in a region. SPI can reflect the relationship of five indexes in a region and its impact on the status quo of regional livelihoods [12]. The calculation formula of SPI is shown in Eq.2.
= ( + + + + + + + + + J)(1 − ) (2)
In Eq.2: J, K, L, M and N represent the values of labor, diet, financial assets, production and social resources respectively. Sup is the support degree of data mining results in this area.
Result Analysis
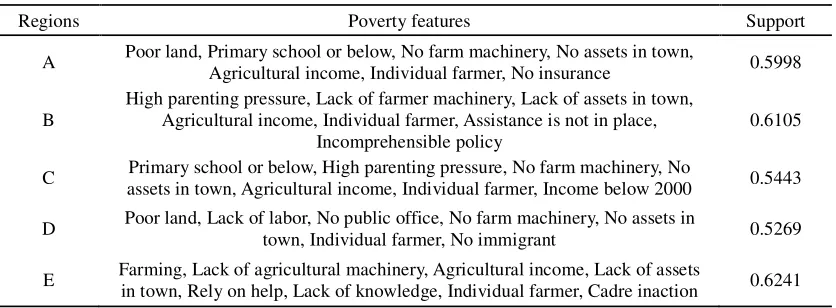
Poverty Characteristics of Fine-Grained Level
Table 1. The most frequent concentration of poverty factors in regions.
Regions Poverty features Support
A Poor land, Primary school or below, No farm machinery, No assets in town,
Agricultural income, Individual farmer, No insurance 0.5998
B
High parenting pressure, Lack of farmer machinery, Lack of assets in town, Agricultural income, Individual farmer, Assistance is not in place,
Incomprehensible policy
0.6105
C Primary school or below, High parenting pressure, No farm machinery, No
assets in town, Agricultural income, Individual farmer, Income below 2000 0.5443
D Poor land, Lack of labor, No public office, No farm machinery, No assets in
town, Individual farmer, No immigrant 0.5269
E Farming, Lack of agricultural machinery, Agricultural income, Lack of assets
in town, Rely on help, Lack of knowledge, Individual farmer, Cadre inaction 0.6241
[image:3.612.110.501.309.401.2]In Tab.1, a higher level of support degree indicates that the poverty characteristics in the data set are more pronounced in its region. The distribution of poverty characteristics obtained through the most standardized method as shown in Tab.2:
Table 2. Poverty distribution of regions.
Regions Labor Diet Financial assets Production Social resources
A 6 0 6 6 3
B 6 0 6 3 6
C 6 2 4 2 0
D 3 0 6 6 6
E 6 2 4 2 2
[image:3.612.97.514.475.560.2]In Tab.2, a higher value indicates that the poverty characteristics are more prominent in its region. The counts of the indexes in the five regions are sorted in descending order of numerical values. The results are shown in Tab.3:
Table 3. The sorting table for total number of indexes.
Ranking Type of indicator Total number of all regions
1 Labor 27
2 Financial assets 26
3 Production 19
4 Social resources 17
5 Diet 4
Tab.3 describes the cumulative number of occurrences of each index value in the poverty structure. A larger value indicates that the index is more important and influential in its region.
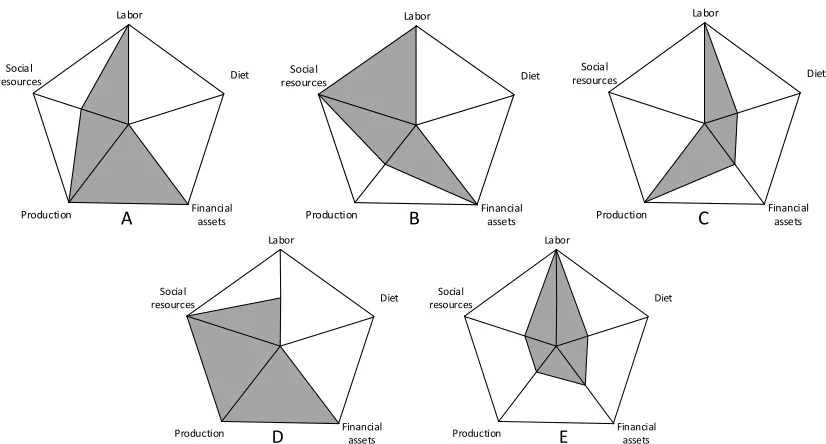
Poverty Characteristics of Medium-Grained Level
Labor
Diet Social
resources
Financial assets Production A
Labor
Diet Social
resources
Financial assets Production B
Labor
Diet Social
resources
Financial assets Production C
Labor
Diet Social
resources
Financial assets Production D
Labor
Diet Social
resources
[image:4.612.97.510.66.288.2]Financial assets Production E
Figure 3. Poverty characteristics of region A, region B, region C, region D, region E.
The size of each shaded part of these figures indicates the degree of stability of the poverty structure in the region. A larger value indicates that the poverty structure is more stable in its region and the impoverishment is more serious. The prominent part of the shadow pattern indicates that this index is the core poverty feature of the region. The less the prominent part, the more unstable the poverty structure, and the easier it is to solve the poverty problem.
Poverty Characteristics of Coarse-Grained Level
Based on the distribution of poverty characteristics in each region, the SPI of each region is clustered to hierarchically quantify the capacity of sustainable poverty in all regions. The results of regional SPI are discretized to classify poverty level. The poverty level classification results are shown in Tab.3:
Table 3. The poverty level classification results of five regions.
Regions SPI Categories SPI range C 30.9876 Class 1 SPI ≤ 32 E 36.0864 Class 2 32 < SPI ≤ 60 B 63.099 Class 3 60<SPI A 64.8324 Class 3 60<SPI D 76.6422 Class 3 60<SPI
It can be seen from Tab.4 that the sustainable poverty capacity of region C in the class I is weaker than region E in the class II, and the sustainable poverty capacity of region E is weaker than region A, B and D of the class III.
Conclusion
This study analyses the poverty characteristics of five regions from three granularity level:
①At a fine-grained level: The five regions of A, B, C, D, and E, all demonstrate the poverty characteristics of “lack of farmer machinery, individual farmer, no assets in town” This shows that these regions all lack of production data and no capital accumulation. It can be seen from Tab.3 that the lack of labor and financial assets in the rural poverty regions are the emphasis of poverty alleviation policies, rather than the basic guarantees such as diet.
[image:4.612.185.426.479.554.2]poverty characteristics in general. The similarity analysis of the poverty structure among different poverty regions with strong correlation can well improve the accuracy of poverty alleviation and support to local poverty reduction policies.
③At a coarse-grained level: Regional SPI presents obvious spatial differentiation. The two regions C and E have obvious core poverty characteristics, so their sustainable poverty ability is low. The three regions of A, B and D have relatively high SPI due to the relatively uniform distribution of poverty characteristics in all indexes. In some high SPI regions such as A, B, and D, the interrelationships among various poverty indexes should be balanced. On the other hand, in some low SPI regions such as C and E, their core poverty characteristics should be focused on to carry out poverty alleviation.
Reference
[1] Yang Yuanyuan, Liu Yansui, Zhang Ziwen. Innovation and Suggestions on Accurate Poverty Alleviation Policy Based on Typical Survey [J]. Bulletin of Chinese Academy of Sciences, 2016, 31(03): 337-345.
[2] Liu Yansui,Zhou Yang,Liu Jilai. The Regional Differentiation Characteristics of Rural Poverty in China and Its Poverty Alleviation Strategy [J]. Bulletin of Chinese Academy of Sciences, 2016, 31(03): 269-278.
[3] Wu Peng, Li Tongsheng, Li Weimin. Spatial Differentiation and Influencing Factors of Rural Poverty in County Area—A Case Study of Shanyang County, Shaanxi Province [J]. Geographical Research, 2018, 37(03): 593-606.
[4] Liu Yansui, Li Jintao. Geographic Detection and Optimization Decision-making of Differentiation Mechanisms of Rural Poverty in China [J]. Acta Geographica Sinica, 2017, 72(01): 161-173.
[5] Wang Xiaolin, Sabina Alkire. Multidimensional Poverty Measurement in China: Estimation and Policy Implications [J]. China Rural Economy, 2009(12): 4-10+23.
[6] Zou Wei, Fang Yingfeng. A Dynamic Multi-Dimensional Study on Poverty in China [J]. Chinese Journal of Population Science, 2011(06): 49-59+111.
[7] He Renwei, Li Guangqin, Liu Yunwei, Li Lina, Fang Fang.A Study on the Precision Poverty Alleviation Analysis Method Based on Sustainable Livelihoods—A Case Study of Liangshan Yi Autonomous Prefecture in Sichuan Province [J]. Progress in Geography, 2017, 36(02): 182-192.
[8] Li Yurui, Cao Zhi, Zheng Xiaoyu et al. A Regional Model and Sustainable Approach to Implementing Poverty Alleviation in China [J]. Bulletin of Chinese Academy of Sciences, 2016, 31(3): 279-288.
[9] Xiang Yunhua, Liu Huan. An Empirical Analysis of Social Assistance to Promote Accurate Poverty Alleviation under Safe Poverty Alleviation Model [J]. Journal of Jiangxi University of Finance and Economics, 2016, 107(5): 63-73.
[10]Wang Lei, Xu Lu, Wang Xia. Coupling Analysis and Mechanism Innovation of Precision Poverty Alleviation Operation Mechanism Driven by Big Data—Based on the Cases of Guizhou and Gansu [J]. Journal of Public Management, 2017, 14(03): 135-143+159-160.
[11]Bu Dongbo, Bai Shuo, Li Guojie. The Granularity Principle in Clustering/Classification [J]. Chinese Journal of Computers, 2002(08): 810-816.