http://dx.doi.org/10.4236/wjnst.2016.62011
How to cite this paper: Gabbar, H.A., Zhang, L.P., Boafo, E., Bondarenko, D. and Stoute, C.A.B. (2016) Simulations of High- Current Plasma Beam by Continuum and Statistical Mechanical Models. World Journal of Nuclear Science and Technology, 6, 103-114. http://dx.doi.org/10.4236/wjnst.2016.62011
Simulations of High-Current Plasma
Beam by Continuum and Statistical
Mechanical Models
Hossam A. Gabbar
1,2*, Luping Zhang
1, Emmanuel Boafo
1, Daniel Bondarenko
1,
C. A. Barry Stoute
21Faculty of Engineering and Applied Science, University of Ontario Institute of Technology, Oshawa, Canada 2Faculty of Energy Systems and Nuclear Science, University of Ontario Institute of Technology, Oshawa, Canada
Received 22 February 2016; accepted 19 April 2016; published 22 April 2016
Copyright © 2016 by authors and Scientific Research Publishing Inc.
This work is licensed under the Creative Commons Attribution International License (CC BY). http://creativecommons.org/licenses/by/4.0/
Abstract
The paper builds the high-current plasma beams model under different dimensions (1D, 2D, and 3D) by continuum (magnetohydrodynamics MHD) and statistical (Monte Carlo MC) mechanics under conditions of low pressures (10−3 Pa). After detailed presentation of the model, two
me-thods firstly have been analyzed in terms of plasma beam properties. Then, we compare the si-mulation results of MHD numerical sisi-mulation with MC stochastic particles sisi-mulation. Finally, through further analysis, it is demonstrated that integrated hybrid MHD and MC method (IMHDMC) provides an innovative practical tool to capture essential properties of high-current plasma beams.
Keywords
Plasma Beam Simulation, Magnetohydrodynamics, Monte Carlo, PHITS, IMHDMC
1. Introduction
Plasma is a collection of electrons and ions, which is regarded as a truly multi-physics phenomenon, in the fourth fundamental state. Plasma exhibits strongly coupled interaction between electron and ion transport, elec-tromagnetic fields, heat transfer, and fluid mechanics [1]. As a result of complexity of plasma physics, expe-riences are not sufficient to predict plasma behavior to desired level of accuracy and experimental plasma in de-tails is difficult to be achieved due to extreme operating conditions. In this paper, author uses two computational
modelling methods to simulate high-current plasma beams and one advanced method to analyze simulation re-sults further. The important object, high-current plasma beams, is used to demonstrate HOPE Innovations Inc.’s alternative approach to generate fusion energy.
The long term purpose of HOPE’s research is to validate the Z-pinch phenomenon used in the multi-pinch plasma for nuclear fusion. The aim of this paper is not to find analyze the fusion process, rather the use of alter-native algorithms to properly map the plasma in a Z-pinch. Navier-stokes equations for plasma are normally used for mass transport analysis and plasma thrusters [2]. Monte Carlo, or better known as particle-in-cell, me-thod is used mainly in ion thruster analysis [3]. This research explores the possibility of combining fluid analysis with particle analysis to have a complete picture of the plasma.
2. Methodology
The methodology encompasses the three methods of plasma simulations: continuum mechanics (magnetohy-drodynamic (MHD) model), statistical mechanics (Monte Carlo model), and the hybrid of the two. The section covers the theory and assumptions, flow charts, and the reasoning behind the use of the hybrid model.
2.1. MHD Methodology
The MHD methodology covers the use of Navier-Stokes equations in a plasma environment. The assumptions covers the quasi-neutrality of the plasma; the flow chart covers how the algorithm solve the equations effective-ly.
2.1.1. Assumptions
The 3D MHD model studied is time-dependent and based on the following main assumptions.
1) The plasma is treated as a single conducting fluid using macroscopic variables and their corresponding hy-drodynamic conservation equations.
2) The single-fluid equations describe behavior of plasma, which is very-low-frequency and like large-scale fluid.
The aim of MHD method is to get general behavior of high-current plasma beams under low pressures.
2.1.2. MHD Flowchart
The equations for mass density, ρ, velocity, v, and charge density, ρe, are obtained by summing the
correspond-ing multi-fluid equations over all species:
1) Conservation of Mass
We start from the equation of total mass conservation in MHD is
0.
t
ρ
ρ
∂ + ⋅∇ =
∂ v (1) The mass conservation dictates there is no change in the mass during transport.
2) Conservation of Charge
The equation for conservation of charge is
0. e e t ρ ρ ∂ + ⋅∇ =
∂ v (2)
3) Conservation of Momentum
The momentum conservation equation in MHD is
v
v p
t
ρ
ρ
τ
∂ + ⋅∇ = −∇ + ∇ + ×
∂ v J B (3)
where p,τ, J, and B are the isotropic pressure, shear stress, current density, and magnetic field, respectively. 4) Ohm’s Law
(
)
σ
= + ×
J E v B (4)
5) Faraday’s Law
.
t ∂ ∇× = −
∂
B
E (4)
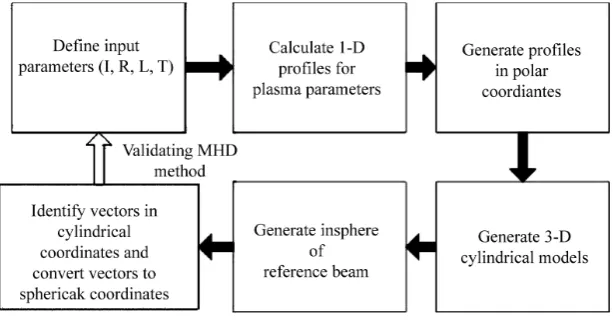
The 1D, 2D and 3D profiles of the above-mentioned parameters have been successfully modelled. The 2D profiles are constructed in the polar coordinates (r, θ). The 3D profiles are generated in the cylindrical coordi-nate system (r, θ, z). The flowchart of MHD simulation is shown in Figure 1.
2.2. MC Methodology
Then methodology of the Monte-Carlo covers the theory and the flow chart of the algorithm. The theory covers the layers of the algorithm. It is much slower than the MHD method, but the algorithm covers both continuum and statistical mechanics of the fluid. The flow chart illustrates the path of the algorithm to simulate the plasma.
2.2.1. MC Theory
In MC theory, when we consider an electron crosses one or several layers of the plasma, path length is firstly assumed to be obtained by mean free path and random number in initial layer. Then next path length is corrected directly based on the ratio of mean free paths of several layers which the electron traverses. The MC program is composed of three parts as shown in Figure 2.
Where N and L are the number of traced electrons and the number of steps of the tracing electron, respectively. Nm and Lm are the corresponding maximum values. Ek denotes the kinetic energy and Z denotes the depth of the
tracing electron. Tt denotes the total thickness of sample and Ec denotes the cut-off energy.
2.2.2. MC Flowchart
The particle and heavy ion transport code is an essential implement in the design and study of the high-current plasma beams. The multi-purpose Monte Carlo Particle and Heavy Ion Transport code System (PHITS) [5][6]
based on the NMTC (Nuclear Meson Transport Code) and JAM (Jet-Aa Microscopic Transport Model) has been developed. The physical processes which PHITS includes in a multipurpose simulation code are divided into two categories: the transport process and the collision process. In the transport process, the PHITS can simulate a motion under external fields such as magnetic and electric fields. Without external fields, neutral particles move along a straight trajectory with constant energy up to a next collision point. The second category of the physical processes is collision with nuclei in material. According to the mean free path, the PHITS chooses next collision point using the MC method. To generate secondary particles of the collision, we need the information on final state of collision.
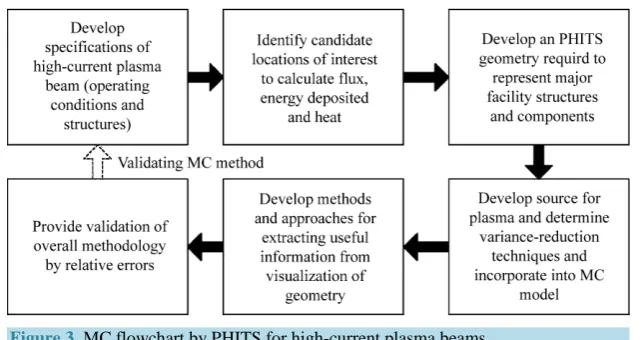
[image:3.595.161.468.548.708.2]In Figure 3, we have six steps to simulate high-current plasma beams by MC method. In first step, the geo-metry of high-current plasma beams is defined using Boolean operator, including cells and surfaces, etc. Next, we use infinite space and fill them with certain materials and define them as void. The wall is made of copper and plasma beam is produced by ionized electron source beam. In the third step, we select cylindrical shape of
Figure 3. MC flowchart by PHITS for high-current plasma beams.
source distribution with mono-energy source particle. Then, we use [T-3dshow] and [T-gshow] tallies for checking geometry, such as 2D and 3D visualizations, and we also use [T-track], [T-heat] and [T-deposit] tallies for calculating physical quantities, such as particle flux and heat and deposition energy. In the final step, some control functions are applied to improve MC simulation accuracy, such as calculation mode and particle trans-port simulation (maxcas and maxbch).
2.3. IMHDMC Methodology
In Figure 4, it illustrates that IMHDMC method includes three parts: general input, two models coupled and in-teraction, final output. Once we obtain MHD and MC simulation results, IMHDMC method is used to integrate simulation results in order to obtain reasonable and useful analysis in industrial applications, such as plasma ga-sification and fusion energy generation. Finally, simulated results from MHD and MC methods are validated by IMHDMC method.
3. Simulation
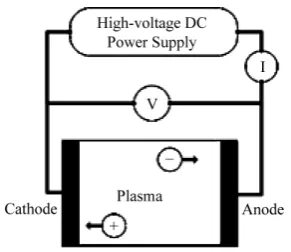
To initiate a high-current plasma beam, a voltage is applied to both ends of a single carbon tube passing through the chamber, as shown in Figure 5. A notch or a length of thinner tube is made at the center point of the carbon tube. The tube is expected to vaporize starting from the center thinned-down location, and thus a plasma arc is generated and maintained by the supplied voltage and current. When the current passing through the plasma media is high enough, a pinched plasma beam forms under the influence of the Lorentz force. The plasma beam may extinguished when the gap between the electrodes exceeds the length.
3.1. MHD Simulation
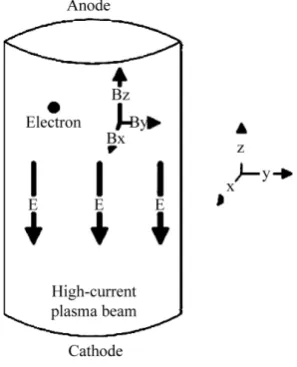
The self-induced force density [8] (or Lorentz force) of the plasma beams has to be calculated from the vector components of J and B. Figure 6 shows the equilibrium in the z-pinch which can be represented by a cylindrical plasma column of radius a with cylindrical coordinates (r, θ, z). The equilibrium is treated by assuming axial symmetry. The axial plasma current has a current density distribution Jz(r). The axial current Jz(r) generates an
azimuthal magnetic field Bθ
( )
r .The azimuthal field is defined inside the plasma by [9]
( )
02 2π Ir B r a θ µ
= (5)
where I is the plasma current.
By analyzing Equation (1) to Equation (3), current density J(r)is related to magnetic field, we can get
( )
20 d 1 constant d π z
B B I
J r
r r a
θ θ
µ
= + = =
Figure 4. IMHDMC [7] flowchart for high-current plasma beams.
Figure 5. Simple representation of a discharge tube-plasma.
[image:6.595.241.387.445.571.2] [image:6.595.203.429.598.704.2]which suggests that current density is uniform across the plasma.
The plasma pressure is integrated from r to a and solving for P leads to [10]
( )
0 2(
2 2)
( )
2 22 4 0 2
4π
I a r
P r a r P
a a
µ −
= − =
(7)
which is a parabolic profile. The overall pressure profile is
( )
( ) ( )
( )
( )
2 1
2 2 3 2 2 3
2 2
0 a r 0 a r ,
P r kT r n r kT n
a a
− −
= =
(8)
where k is the Boltzmann constant. The plasma density and temperature profiles can be written as:
( ) ( )
( )
( )
1 1
2 2 3 2 2 3
2 2
0
0 ,
0
P
a r a r
n r n
kT
a a
− −
= =
(9)
( )
( )
2
2 2 3
2
0 a r .
T r T
a −
=
(10)
3.2. MC Simulation
The electrons in plasma participate in elastic and inelastic collisions and these collisions mainly cause changing energy and direction of moving electrons. The basic MC the ory is based on Null-Collision technique [11] and the electron flux, heat and deposit energy have been investigated.
1) MC Simulation Model
The MC simulation model is shown in Figure 7 and the electric field in high-current plasma beam is assumed to be uniform in the cathode region. Besides, the magnetic field is time-independent in space.
2) Simulation Algorithm
[image:7.595.239.388.522.706.2]Firstly, MC simulation is started with initial electrons of high-current plasma beams emitted from the cathode. For an initial electron, its exact position is x = 0, y = 0, z = 0, r = 0, which is assumed to have an initial projectile energy value at 158 keV. The entry angle is randomly selected in line with a cosine distribution. Electrons are assumed to move freely, until an arbitrary collision happens. The flight time of electrons between two succes-sive collisions is determined by the Null-Collision method. The motion equations of electrons are integrated by a fourth order Runge-Kutta routine. The energy of electrons after one collision can be used as the starting condition
for the free motion of electrons until next collision. The electron is assumed to be scattered isotopically and its new direction is calculated by
( )
1cos θ = −1 2N, (11)
2
2π ,N
ϕ = (12)
where θ and φ denote polar angles, N1 and N2 denote uniform random numbers between 0 and 1. Electrons are
followed from the source, through whole life history of collisions, until they escape the limitation (copper wall). The sequence is repeated continuously for the initial electrons (106), and the important parameters are calculated as an average of all electrons.
3.3. IMHDMC Simulation
The simulation starts with MHD model, using arbitrary production and loss rates for Ar and electrons densities. In MHD model, the electric field distribution, current density and Lorentz force density calculated are used as input in MC model. After one complete run of MC model have been carried out, this run is repeated and has all the data from MC model. Through the same pattern, a number of consecutive runs of MC model have to be per-formed, until convergence is reached, which is defined by plasma fluxes arriving at the cathode. When conver-gence is achieved within MC model, MHD model starts to use appropriate production and loss rates, which are obtained from MC model. The results yield a new electric field distribution, new current density and Lorentz force density profiles of plasma. These new data are inserted again in MC model, then the procedure of simulat-ing MC model is repeated in the same way.
4. Results and Discussion
This sections covers the results from the three methods. Firstly, the MHD results and discussion on the results; then the MC method; and finally the hybrid model, and the comparison among the three.
4.1. MHD Method
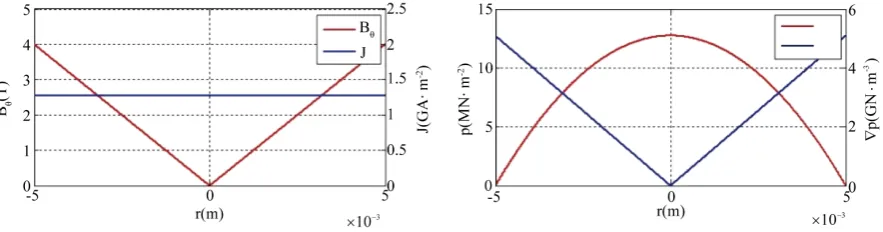
The radial profiles of plasma parameters in a single plasma beam are shown in Figure 8, and the profiles are calculated using Equation (1), Equation (2), and Equation (5). These profiles are used to construct the polar pro-files required for the 3D modelling of plasma beam. Figure 9 shows the polar profiles of plasma parameters of single plasma beam. The color bar in each plot represents the variation of the plasma parameter over the beam radius.
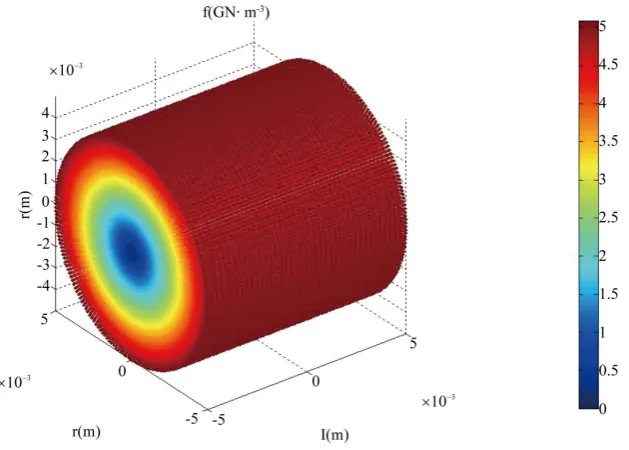
The 3D model for high-current plasma parameters is shown in Figure 10. The model represents the Lorentz force (or the force density) acting on the plasma beam. The length of model is about 10 mm which corresponds to the diameter of the focal region. Since the model is constructed in the cylindrical coordinates (r, θ, z), the corresponding in-sphere has to be converted to the spherical coordinates (r, θ, φ). Figure 11 shows Lorentz force for high-current plasma beam. The force for high-current plasma beam is calculated by integrating force density over cylinder volume.
[image:8.595.93.535.577.693.2]Figure 9. Polar plots of plasma parameters in high-current plasma beam.
Figure 10. 3D model of Lorentz force for high-current plasma beam.
4.2. MC Method
4.2.1. Plasma Trajectory and Flux
Tally [T-3dshow] gives us a 3D plasma beam geometry, as shown in Figure 12. We can see that argon is in red color and copper is in cyan color and check 2D geometry of MC model by tally [T-gshow]. The sphere is hypo-thetical so that it is supposed to be void region.
[image:9.595.160.475.340.565.2][image:10.595.86.540.77.265.2]
(a) (b)
Figure 11. (a) Force density for high-current plasma beam and (b) force for high-current plasma beam.
(a) (b) (c)
Figure 12. (a) Plasma beam 3D geometry by [T-3dshow] tally; (b) Plasma beam 2D geometry on xy plane; (c) Plasma beam 2D geometry on xz plane.
(a) (b)
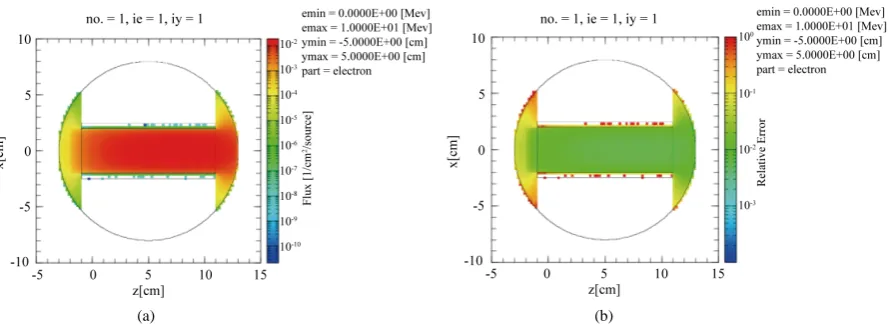
Figure 13. Electron flux of electron source on x-z plane in part (a) and its corresponding relative errors in part (b).
[image:10.595.91.538.293.434.2] [image:10.595.93.538.470.635.2]4.2.2. Plasma Deposition Energy Distribution
Only ionization energy losses by charged particles (electron) are scored by [T-deposit] tally. Particles with energy below emin parameters are not traced by PHITS simulation. Plasma beam mainly distributes in cell 100 so we use reg mesh. In Figure 14, the deposition energy distribution is similar to Gaussian distribution. Since total number of particles is 106, more than 104 source particles have 10−2 - 10−1 MeV deposit energy. With de-crease of deposit energy, the number of source particles are reduced. It takes 1 hour to finish running all algo-rithms by PHITS.
4.2.3. Heat Distribution
During process of argon ionization, neutral atoms and ions are produced. We can use [T-heat] tally to calculate neutral and ion doses. In Figure 15, for the part (a), plasma beam has low heat and the value is smaller than 10−4 [MeV/source]. The heat is almost uniform except the entrance part. In copper region, there are also some heat distribution since neutrals and ions penetrate into copper and produce 10−7 [MeV/source] heat. In the part (b), we can see that relative errors of heat is smaller than 0.1 in plasma beam. According to relative error on the edge of copper, it is reasonable for us to neglect heat value in the part (a) corresponding to the same position. It takes around 1 hour 16 minutes to obtain heat distribution simulation.
4.3. IMHDMC Method
[image:11.595.187.435.347.526.2]The IMHDMC method is a comprehensive method that integrates MHD and MC simulation results together. Therefore, it links magnetohydrodynamic fluid with particle transport and collision in high-current plasma
Figure 14. Deposition energy (MeV) calculated in region 100.
[image:11.595.95.537.549.695.2](a) (b)
beams. A MHD simulation defines spatial distribution of magnetohydrodynamic fluid fields and this distribution is then employed by a MC simulation to characterize energy deposited and heat field. MATALB codes are used for MHD simulation, while PHITS is used for MC transport and collision simulation. According to IMHDMC simulation, Lorentz force are main parameters which affect fluid flow in a magnetic field. In the center of high-current plasma beam, there is highest particle flux where there is largest Lorentz force density. Besides, the pressure starts to decrease from center point along radial direction, which is same as heat distribution. Finally, high-current plasma beam deposits energy in a form of Gaussian and the maximum value is at initial energy value.
5. Conclusion
High-current plasma beams are simulated by two methods: MHD and MC methods. Then it is analyzed by IMHDMC method. For MHD method, the initial work is focused on developing analytical model for high- current plasma beams. Numerical simulations are successfully conducted using MATLAB codes to obtain vari-ous plasma parameters. For MC method, we use tallies to check 2D and 3D plasma beam geometry. Also, we develop electron flux on two planes and the heat and deposit energy distributions are obtained. For all calcula-tions, the accuracy is satisfied since the relative errors are smaller than 0.01. Finally, the unified viewpoint by IMHDMC method in the same conditions provides us a totally new picture to analyze the simulation results correctly.
Acknowledgements
We thank HOPE Innovations Inc. for providing the important information. And we also thank Dr. Sayf Elgriw for supporting the work in this paper, and Mr. Eric Heritage for providing us with PHITS software.
References
[1] Lebouvier, A., Iwarere, S.A., Ramjugernath, D. and Fulcheri, L. (2013) 3D Magnetohydrodynamic Modelling of a dc Low-Current Plasma Arc Batch Reactor at Very High Pressure in Helium. Journal of Physics D: Applied Physics, 46, Article ID: 145203. http://dx.doi.org/10.1088/0022-3727/46/14/145203
[2] Bogaerts, A., Neytsa, E., Gijbelsa, R. and Van der Mullenb, J. (2002) Gas Discharge Plasmas and Their Applications.
Spectrochimica Acta Part B: Atomic Spectroscopy, 57, 609-658. http://dx.doi.org/10.1016/S0584-8547(01)00406-2
[3] Dini, F., Baghdadi, R., Amrollahi, R. and Khorasani, S. (2010) An Overview of Plasma Confinement in Toroidal Sys-tems. Glow Discharges and Tokamaks, 4, 159-279.
[4] Iwase, H., Kurosawa, T., Nakamura, T., Yoshizawa, N. and Funabiki, J. (2002) Development of General-Purpose Par-ticle and Heavy Ion Transport Monte Carlo Code. Journal of Nuclear Science and Technology, 39, 1142-1151. http://dx.doi.org/10.1080/18811248.2002.9715305
[5] Niita, K., Sato, T., Iwase, H., Nose, H., Nakashima, H. and Sihver, L. (2006) PHITS—A Particle and Heavy Ion Trans- port Code System. Space Radiation Transport, Shielding, and Risk Assessment Models, 41, 1080-1090.
[6] Niitaa, K., Takada, H., Meigo, S.-I. and Ikeda, Y. (2001) High-Energy Particle Transport Code NMTC/JAM. Beam
In-teractions with Materials and Atoms, 184, 406-420. http://dx.doi.org/10.1016/s0168-583x(01)00784-4
[7] Marcel, G. (2003) An Introduction to Plasma Astrophysics and Magnetohydrodynamics. Springer, The Netherlands.
[8] Skullerud, H.R. (1968) The Stochastic Computer Simulation of Ion Motion in a Gas Subjected to a Constant Electric Field. Journal of Physics D: Applied Physics, 1, 1567-1569. http://dx.doi.org/10.1088/0022-3727/1/11/423
[9] Elgriw, S.G. (2009) Investigation of Magnetohydrodynamic Fluctuation Modes in the STOR-M Tokamak. University of Saskatchewan, Saskatoon.
[10] Dolan, T.J. (1982) Fusion Research: Principles, Experiments and Technology. Pergamon Press, Oxford.
![Figure 2. MC algorithm [4] in MC model.](https://thumb-us.123doks.com/thumbv2/123dok_us/7963193.753572/4.595.124.501.82.704/figure-mc-algorithm-in-mc-model.webp)