Learning-Testing Process in Classroom:
An Empirical Simulation Model
Buda, Rodolphe
EconomiX - UMR 7166 CNRS, Université de Paris 10
January 2009
Online at
https://mpra.ub.uni-muenchen.de/12146/
An Empirical Simulation Model
Rodolphe Buda
∗Economix
†-
UMR 7166 CNRS
Universit´e de Paris 10
Summary
This paper presents an empirical micro-simulation model of the teaching and the testing process in the classroomH. It is a non-econometric micro-simulation
model describing informational behaviors of the pupils, based on the observation of the pupils’ communication behavior during lessons and tests. The represen-tation of the knowledge process is very simplified. However, we tried to study the involvements of individual motivation, capability and relationship with other pupils of each pupil, to compare them to the new-classical(and keynesian) and Austrian information and knowledge theoretical results. It is a first step and fu-ture development should concern expectation behaviors and dynamics. This paper aims too to give, we hope so, some criteria of pupils’ rationality in the classroom.
Key-Words : Teaching, Learning, Cheating, Information, Communication, Knowledge, Micro-simulation, Classroom
JEL Classification : A2, D83, G14
Computers & Education, 52(1), 177-187, 2009, cElsevier 2008
HPrograms and sample data are available - the actual names of pupils have been hidden.
∗Acknowledgment: The author would like to thanks the anonymous referee for his critiques
and advises, and would obviously be responsible for any remaining error.
†[email protected] - [email protected]-T01-40-97-77-89 -v
01-47-21-46-89B200, Avenue de la R´epublique, Bt.G 610-B, 92001 NANTERRE Cedex - FRANCE
”Time is mali” one of my students.
Since the famous experiences of E.H.Chamberlin (1948) and then V.L.Smith (1962), the classroom has become a favorite field of applied micro or macro-economics laws of the experimental macro-economics (G.Delemeester & J.Brauer 2000). In the usual experiment design, pupils play some economic roles, and the teacher leads experiment. The modelling of the classroom is mainly educational or psy-chological1, however pupils and teacher rarely play their own role (R.Fernandez & J.Gali, 1999 ; R.Gary-Bobo & A.Trannoy, 2004).
Our purpose was to model the relationship between pupils and teacher in the classroom, during the lesson and during tests and exams. Our model is empirical - but not econometric - and based on observation2. The model calculates some micro-simulations3 but it tries to explain and not to forecast any socioeconomic events. The classroom is considered as an information and knowledge complex market4. Indeed, in such a market, the teacher would appear as the main ”sup-plier” of information and the pupils as ”demanders”, but information process in the classroom is actually rather more complex5. We have analyzed all the infor-mational - listening, chatting and cheating one - behavior of pupils and the teacher during lessons and tests, and then translated them into a few simple equations.
Consequently, our major topic is clearly the modelling of educational learn-ing6, but we believe we could obtain some results which could improve the un-derstanding of the Economics of information too (R.Buda, 2000). According to this, we’ll consider the New-classical Economic School (G.S.Becker, 1964) through it’s design of learning process, the New-keynesian Economic School (S.J.Grossman & J.E.Stiglitz, 1980) through its model of asymmetric informa-tion, and the Austrian Economic School (F.A.Hayek, 1937 & 1945) through its process of knowledge discover.
I - The Equations of the Model
The class is composed of N pupils and one teacher. The teacher teaches a lesson which is divided into jperiods. The pupils have to learn the lesson before the tests (exam, or competitive exam). This test is divided into 20 parts8. The quarterly average of each pupil is calculated with their marks in each test.
Properties and behaviors- Each pupiliworks with courage (Ci) and is able to understand the lesson according to his capabilities (Ai)9
0≤Ci≤200 (1) 0≤Ai≤200 (2) The teacher gives information to the pupils, puts the test and the marks according to the answers of each pupil. During the lesson, he can giveboni b to the pupils who give good answers and help the teacher in making the understanding of the class increase. On the other hand, the teacher can givemali mto the pupils who are chatting during the lesson. Eachbonusandmalus(resp.) increases or decreases (resp.) one percent of the quarterly average.
Behaviors during lesson - When the teacher teaches the lesson, pupil i be-lieves he has understood - translated by the encoding variableEij -, but he did’nt because of his own chatting or the chatting around10. Then he consequently won’t have to cheat during the test because he things he has the right answers. They are interested in some topics different from the lesson (Lj). Lessons and topics are
divided into 20 parts, thus pupils choose at each moment between chatting or lis-tening to the lesson. Pupil will pay attention during the lesson, if its weight (wL)
is greater than the weight of his chatting (wT).
wiL,j=wiM∗Mci−1 (3)
wherec−1 is the rank of the previous test andwM the weight of the mark. The
weight of the course depends on the test too. During the lesson, the pupil i ac-cumulates knowledge11 (Kij). Sometimes pupil ihas well understood (Kij=Lj),
but sometimes the pupilihas misunderstood (Kij6=Lj) or has not listened to the
lesson (Kij=0)12. If a pupiliis chatting with a pupilk- exclusively during the j
lapse of time -, both haven’t recorded the information given (Kij=0 andKkj =0). The event of chatting depends on the expectation of the test - especially the cost of fraud (cF) during the test.
At the end of each lesson, the aggregation of chatting’s behavior is given by
BT OT = N
∑
i=1 20
∑
j=1
Bij (5)
There is a gap, when the pupil doesn’t pay attention during lessons
if Kij=0 then Gij=1 (6)
hence Gi=
20
∑
j=1
Gij (7)
The chatting of some pupils can disturb the understanding of the weakest pupils, especially according to a few thresholds :
Ci≤C (8)
Ai≤A (9)
N
∑
i=1
Gij≥G (10)
At the end of the lesson, pupiliaccumulated the following level of knowledge13
Ki=
20
∑
j=1
Kij (11)
and the whole class
KT OT = N
∑
i=1 20
∑
j=1
Kij (12)
For each pupil ifKti≤K0i with 0≤l≤1 then the encoding capability is given by
Eti=Eti−1∗l (13)
that means pupili will be able to understand the future lessons with a minimal level of knowledgeK0i.
Behaviors during a test : Pupilianswers to the test in writing papersPj. His
answers depends on his knowledge (Pij=Kij). If the answer is correct (Kij=Lj)
then pupiligets a point in his mark14(πij=1). Hence his total mark is
Mci=
20
∑
j=1
πi
where fraud f =1 if pupil is caught in free-riding behavior15 - a microeconomic word which denotes the behavior of someone who uses a good without to pay it -, andcF the points which are lost by the free-rider pupil.
Nomenclature
i Rank of the pupil
j Rank of the lesson’s chapter
c Rank of the tests (from 1 tocmax)
Ci Courage and effort ofi
Ai Understanding capability ofi
Mci Mark ofiduring testc
Mi Quarterly average of pupili
MT OT Whole quarterly average
MAT OT Actual whole quarterly average
MST OT Simulated whole quarterly average
∆MT OT Difference between simulated and
actual whole quarterly average
θT OT
M Ratio∆MT OT overMAT OT
Ei Encoding capability ofiduring lesson
Lj Chapter jof the current lesson
Bij Chatting’s level of pupiliduring
the lapse of time of the jth chapter’s lesson
BT OTj Whole chatting’s level during
the lapse of time of the jth chapter’s lesson
BT OT Whole chatting’s level at the end of the lesson
wiL Weight of the lesson according to pupili
wiT Weight of the chatting according to pupili
wiM Weight of the marks according to pupili
cF Fraud cost
Kij Knowledge’s level of pupiliabout the chapter j
Gij Gap of pupiliconcerning the chapter j
KT OT
t Knowledge accumulated duringtby all pupils
l Encoding deterioration coefficient
Pi
j Test answer to question jbyi
πi
j Point of the mark of question jbyi
f Free-riding’s catching dummy variable
II - Calibration of the Model
The sample of actual data (marks and other assessments) come from personal actual marks of pupils given by the author, as teacher. The pupils were pupils in a French high school of the western suburb of Paris - Lyc´ee Guy de Maupassant (Colombes). Two classes studied Economics and law at the degree of ”Classe de Premire - in French educational system” and one at the degree of ”Classe de Terminale - in French educational system” - they prepared baccalaureate exami-nation. The last class studiedAdministrative Managementat the degree of ”Classe de Terminale”. All of them have been evaluated during a baccalaureate training test. Neither the author (the teacher) nor the pupils knew that the actual marks will be used into a simulation model, when the test happened.
The calibration of the model consisted to determine the value of some param-eters of the equations of our model. So, we have iterated some simulations with different values of parameters, on an actual sample of four classes until to obtain simulated averages the most near from the actual one.
So, we have built an average lag indicator and an error indicator given by the formulae of∆MT andθMT
∆MT OT = MST OT−MAT OT (15)
θT OT
M = ∆M
T OT
MT OT A
(16)
whereMST OT is the simulated total average andMAT OT is the actual total average.
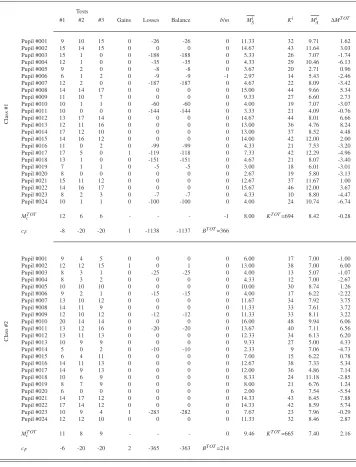
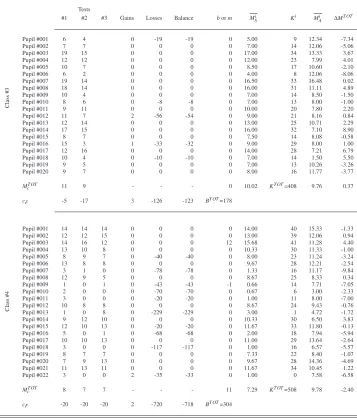
The results of our calibration simulation are displayed on tables 3 and 4 de-scribing the simulation of class #1, #2, #3 and #4. The result of the first (−0.28)
and the third (0.37) class seem to be relatively good (error less than 4%).
Unfortu-nately, the simulation of second (2.16) and the fourth (−2.40) class are relatively less good (error less than 30%). We could explain this greater error because the assumption of homogeneity of tests was probably too strong in fact. Furthermore, one of the pupils, # 022, did not respect the rules of the classroom (class #4).
Table 1: Simulation results for classes #1 and #2
Tests
#1 #2 #3 Gains Losses Balance b/m Mi
S Ki MiA ∆MT OT
Cl
as
s
#
1
Pupil #001 9 10 15 0 -26 -26 0 11.33 32 9.71 1.62 Pupil #002 15 14 15 0 0 0 0 14.67 43 11.64 3.03 Pupil #003 15 1 0 0 -188 -188 0 5.33 26 7.07 -1.74 Pupil #004 12 1 0 0 -35 -35 0 4.33 29 10.46 -6.13 Pupil #005 9 2 0 0 -8 -8 0 3.67 20 2.71 0.96 Pupil #006 6 1 2 0 -9 -9 -1 2.97 14 5.43 -2.46 Pupil #007 12 2 0 0 -187 -187 0 4.67 22 8.09 -3.42 Pupil #008 14 14 17 0 0 0 0 15.00 44 9.66 5.34 Pupil #009 11 10 7 0 0 0 0 9.33 27 6.60 2.73 Pupil #010 10 1 1 0 -60 -60 0 4.00 19 7.07 -3.07 Pupil #011 10 0 0 0 -144 -144 0 3.33 21 4.09 -0.76 Pupil #012 13 17 14 0 0 0 0 14.67 44 8.01 6.66 Pupil #013 12 11 16 0 0 0 0 13.00 36 4.76 8.24 Pupil #014 17 12 10 0 0 0 0 13.00 37 8.52 4.48 Pupil #015 14 16 12 0 0 0 0 14.00 42 12.00 2.00 Pupil #016 11 0 2 0 -99 -99 0 4.33 21 7.53 -3.20 Pupil #017 17 5 0 1 -119 -118 0 7.33 42 12.29 -4.96 Pupil #018 13 1 0 0 -151 -151 0 4.67 21 8.07 -3.40 Pupil #019 7 1 1 0 -5 -5 0 3.00 18 6.01 -3.01 Pupil #020 8 0 0 0 0 0 0 2.67 19 5.80 -3.13 Pupil #021 15 11 12 0 0 0 0 12.67 37 11.67 1.00 Pupil #022 14 16 17 0 0 0 0 15.67 46 12.00 3.67 Pupil #023 8 2 3 0 -7 -7 0 4.33 10 8.80 -4.47 Pupil #024 10 1 1 0 -100 -100 0 4.00 24 10.74 -6.74
MT OT
c 12 6 6 - - - -1 8.00 KT OT=694 8.42 -0.28 cF -8 -20 -20 1 -1138 -1137 BT OT=366
Cl
as
s
#
2
Pupil #001 9 4 5 0 0 0 0 6.00 17 7.00 -1.00 Pupil #002 12 12 15 1 0 1 0 13.00 38 7.00 6.00 Pupil #003 8 3 1 0 -25 -25 0 4.00 13 5.07 -1.07 Pupil #004 8 3 2 0 0 0 0 4.33 12 7.00 -2.67 Pupil #005 10 10 10 0 0 0 0 10.00 30 8.74 1.26 Pupil #006 9 2 1 0 -15 -15 0 4.00 17 6.22 -2.22 Pupil #007 13 10 12 0 0 0 0 11.67 34 7.92 3.75 Pupil #008 14 11 9 0 0 0 0 11.33 33 7.61 3.72 Pupil #009 12 10 12 0 -12 -12 0 11.33 33 8.11 3.22 Pupil #010 20 14 14 0 0 0 0 16.00 48 9.94 6.06 Pupil #011 13 12 16 0 -20 -20 0 13.67 40 7.11 6.56 Pupil #012 13 11 13 0 0 0 0 12.33 34 6.13 6.20 Pupil #013 10 9 9 0 0 0 0 9.33 27 5.00 4.33 Pupil #014 5 0 2 0 -10 -10 0 2.33 9 7.06 -4.73 Pupil #015 6 4 11 0 0 0 0 7.00 15 6.22 0.78 Pupil #016 14 11 13 0 0 0 0 12.67 38 7.33 5.34 Pupil #017 14 9 13 0 0 0 0 12.00 36 4.86 7.14 Pupil #018 10 6 9 0 0 0 0 8.33 24 11.18 -2.85 Pupil #019 8 7 9 0 0 0 0 8.00 21 6.76 1.24 Pupil #020 6 0 0 0 0 0 0 2.00 6 7.54 -5.54 Pupil #021 14 17 12 0 0 0 0 14.33 43 6.45 7.88 Pupil #022 17 14 12 0 0 0 0 14.33 42 8.59 5.74 Pupil #023 10 9 4 1 -283 -282 0 7.67 23 7.96 -0.29 Pupil #024 12 12 10 0 0 0 0 11.33 32 8.46 2.87
MT OT
III - Anti-fraud Policies Simulations
After each lesson, we assume that the teacher gets a test to the pupils, and marks them. We have considered the oral activities of pupils during lesson. It is integrated into the evaluation of each pupil. Moreover, as we know, some pupils try to cheat during the tests to obtain some answers they ignore and the behavior of the teacher is not neutral to control it. We have selected four typical anti-fraud policies. Then we made run some collective and individual simulations.
Quarterly average’s calculation- All the marks are collected into a quarterly average according to the following procedure. If we consider thebonus b=1 and themalus m=−1, the oral score of pupilOis given by
Oi=1+∑m+∑b
100 (17)
and the average of thecmaxmarks of each pupili,Mi, is calculated according to
formula
Mi=Oi∗( 1
cmax
cmax
∑
q=1
Mqi) (18)
Repression against fraud policies- Each teacher has got a reputation to his pupils. The pupils usually expect the reaction of their teacher in front of their cheating’s behavior.
We designed four policies :
#1 - thenon-rigorousone : The teacher leaves its pupils communicating during tests. Consequently, the ”free-rider” pupil never losses any point,
#2 - thesimple auctions policy one : During test, the first free-rider losses n
points, then the following one lossesn+1 points, and so on.
Table 2: Simulation results for classes #3 and #4
Tests
#1 #2 #3 Gains Losses Balance borm Mi
S Ki MAi ∆MT OT
Cl
as
s
#
3
Pupil #001 6 4 0 -19 -19 0 5.00 9 12.34 -7.34 Pupil #002 7 7 0 0 0 0 7.00 14 12.06 -5.06 Pupil #003 19 15 0 0 0 0 17.00 34 13.33 3.67 Pupil #004 12 12 0 0 0 0 12.00 23 7.99 4.01 Pupil #005 10 7 0 0 0 0 8.50 17 10.60 -2.10 Pupil #006 6 2 0 0 0 0 4.00 8 12.06 -8.06 Pupil #007 19 14 0 0 0 0 16.50 33 16.48 0.02 Pupil #008 18 14 0 0 0 0 16.00 31 11.11 4.89 Pupil #009 10 4 0 0 0 0 7.00 14 8.50 -1.50 Pupil #010 8 6 0 -8 -8 0 7.00 13 8.00 -1.00 Pupil #011 9 11 0 0 0 0 10.00 20 7.80 2.20 Pupil #012 11 7 2 -56 -54 0 9.00 21 8.16 0.84 Pupil #013 12 14 0 0 0 0 13.00 25 10.71 2.29 Pupil #014 17 15 0 0 0 0 16.00 32 7.10 8.90 Pupil #015 8 7 0 0 0 0 7.50 14 8.08 -0.58 Pupil #016 15 3 1 -33 -32 0 9.00 29 8.00 1.00 Pupil #017 12 16 0 0 0 0 14.00 28 7.21 6.79 Pupil #018 10 4 0 -10 -10 0 7.00 14 1.50 5.50 Pupil #019 9 5 0 0 0 0 7.00 13 10.26 -3.26 Pupil #020 9 7 0 0 0 0 8.00 16 11.77 -3.77
MT OT
c 11 9 - - - 0 10.02 KT OT=408 9.76 0.37 cF -5 -17 3 -126 -123 BT OT=178
Cl
as
s
#
4
Pupil #001 14 14 14 0 0 0 0 14.00 40 15.33 -1.33 Pupil #002 12 12 15 0 0 0 0 13.00 39 12.06 0.94 Pupil #003 14 16 12 0 0 0 12 15.68 41 11.28 4.40 Pupil #004 13 10 8 0 0 0 0 10.33 30 11.33 -1.00 Pupil #005 8 9 7 0 -40 -40 0 8.00 23 11.24 -3.24 Pupil #006 13 8 8 0 0 0 0 9.67 28 12.21 -2.54 Pupil #007 3 1 0 0 -78 -78 0 1.33 16 11.17 -9.84 Pupil #008 12 9 5 0 0 0 0 8.67 25 8.33 0.34 Pupil #009 1 0 1 0 -43 -43 -1 0.66 14 7.71 -7.05 Pupil #010 2 0 0 0 -70 -70 0 0.67 6 3.00 -2.33 Pupil #011 3 0 0 0 -20 -20 0 1.00 11 8.00 -7.00 Pupil #012 10 8 8 0 0 0 0 8.67 24 9.43 -0.76 Pupil #013 1 0 8 0 -229 -229 0 3.00 1 4.72 -1.72 Pupil #014 9 12 10 0 0 0 0 10.33 30 6.50 3.83 Pupil #015 12 10 13 0 -20 -20 0 11.67 33 11.80 -0.13 Pupil #016 5 0 1 0 -68 -68 0 2.00 18 7.94 -5.94 Pupil #017 10 10 13 0 0 0 0 11.00 29 13.64 -2.64 Pupil #018 3 0 0 0 -117 -117 0 1.00 16 6.57 -5.57 Pupil #019 8 7 7 0 0 0 0 7.33 22 8.40 -1.07 Pupil #020 7 9 13 0 0 0 0 9.67 28 14.36 -4.69 Pupil #021 11 13 11 0 0 0 0 11.67 34 10.45 1.22 Pupil #022 3 0 0 2 -35 -33 0 1.00 0 7.58 -6.58
MT OT
#3 - theno-return auctions policyone : The rule is the same as simple auctions policy but the cost of fraud never decreases between two tests, and
#4 - themaximal repressionone : The free-rider who is caught, losses all the points of the test - 20 in the French assessment system.
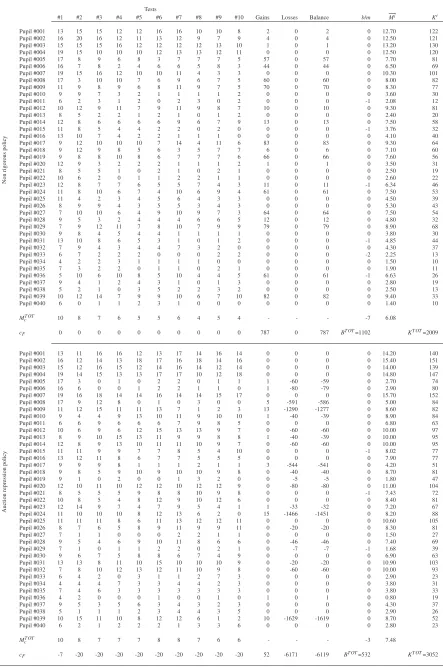
Description and results of the simulations- We firstly made run four typical simulations to investigate the performances of the pupils according to the anti-fraud policy of the teacher - see Table 5 and 6. The first simulations gave us a collective answer, but we need to investigate according to an individual point of view.
Table 3: Anti-fraud policies’ simulation
Tests
#1 #2 #3 #4 #5 #6 #7 #8 #9 #10 Gains Losses Balance b/m Mi Ki
N o n ri g o ro u s p o li cy
Pupil #001 13 15 15 12 12 16 16 10 10 8 2 0 2 0 12.70 122 Pupil #002 16 20 16 12 11 13 12 9 7 9 4 0 4 0 12.50 121 Pupil #003 15 15 15 16 12 12 12 12 13 10 1 0 1 0 13.20 130 Pupil #004 19 15 10 10 10 12 13 13 12 11 0 0 0 0 12.50 120 Pupil #005 17 8 9 6 8 3 7 7 7 5 57 0 57 0 7.70 81 Pupil #006 16 7 8 2 4 6 6 5 8 3 44 0 44 0 6.50 69 Pupil #007 19 15 16 12 10 10 11 4 3 3 0 0 0 0 10.30 101 Pupil #008 17 3 10 10 7 6 9 6 7 5 60 0 60 0 8.00 82 Pupil #009 11 9 8 9 6 8 11 9 7 5 70 0 70 0 8.30 77 Pupil #010 9 9 7 3 2 1 1 1 1 2 0 0 0 0 3.60 30 Pupil #011 6 2 3 1 2 0 2 3 0 2 0 0 0 -1 2.08 12 Pupil #012 10 12 9 11 7 9 11 9 8 7 10 0 10 0 9.30 81 Pupil #013 8 5 2 2 1 2 1 0 1 2 0 0 0 0 2.40 20 Pupil #014 12 8 6 6 6 6 9 6 7 9 13 0 13 0 7.50 58 Pupil #015 11 8 5 4 4 2 2 0 2 0 0 0 0 -1 3.76 32 Pupil #016 13 10 7 4 2 2 1 1 1 0 0 0 0 0 4.10 40 Pupil #017 9 12 10 10 10 7 14 4 11 6 83 0 83 0 9.30 64 Pupil #018 9 12 9 8 5 6 3 5 7 7 6 0 6 0 7.10 60 Pupil #019 9 8 8 10 8 6 7 7 7 6 66 0 66 0 7.60 56 Pupil #020 12 9 3 2 2 2 1 1 1 2 1 0 1 0 3.50 31 Pupil #021 8 5 5 1 0 2 1 0 2 1 0 0 0 0 2.50 19 Pupil #022 10 6 2 0 1 1 2 2 1 1 0 0 0 0 2.60 22 Pupil #023 12 8 7 7 6 5 5 7 4 3 11 0 11 -1 6.34 46 Pupil #024 11 8 10 6 7 4 10 6 9 4 61 0 61 0 7.50 53 Pupil #025 11 4 2 3 4 5 6 4 3 3 0 0 0 0 4.50 39 Pupil #026 8 9 9 4 3 5 5 3 4 3 0 0 0 0 5.30 43 Pupil #027 7 10 10 6 4 9 10 9 7 3 64 0 64 0 7.50 54 Pupil #028 9 5 3 2 4 4 4 6 6 5 12 0 12 0 4.80 32 Pupil #029 7 9 12 11 7 8 10 7 9 9 79 0 79 0 8.90 68 Pupil #030 9 8 4 5 4 4 1 1 1 1 0 0 0 0 3.80 30 Pupil #031 13 10 8 6 5 3 1 0 1 2 0 0 0 -1 4.85 44 Pupil #032 7 9 4 3 4 4 7 3 2 0 0 0 0 0 4.30 37 Pupil #033 6 7 2 2 2 0 0 0 2 2 0 0 0 -2 2.25 13 Pupil #034 4 2 2 3 1 1 1 1 0 0 0 0 0 0 1.50 10 Pupil #035 7 3 2 2 0 1 1 0 2 1 0 0 0 0 1.90 11 Pupil #036 5 10 6 10 8 5 10 4 4 5 61 0 61 -1 6.63 26 Pupil #037 9 4 1 2 4 3 1 0 1 3 0 0 0 0 2.80 19 Pupil #038 5 2 1 0 3 5 2 2 3 2 0 0 0 0 2.50 13 Pupil #039 10 12 14 7 9 9 10 6 7 10 82 0 82 0 9.40 33 Pupil #040 6 0 1 1 2 3 1 0 0 0 0 0 0 0 1.40 10
MT OT
c 10 8 7 6 5 5 6 4 5 4 - - - -7 6.08
cF 0 0 0 0 0 0 0 0 0 0 787 0 787 BT OT=1102 KT OT=2009
A u ct io n re p re ss io n p o li cy
Pupil #001 13 11 16 16 12 13 17 14 16 14 0 0 0 0 14.20 140 Pupil #002 16 12 14 13 18 17 16 18 14 16 0 0 0 0 15.40 151 Pupil #003 15 12 16 15 12 14 16 14 12 14 0 0 0 0 14.00 139 Pupil #004 19 14 15 13 13 17 17 10 12 18 0 0 0 0 14.80 147 Pupil #005 17 3 0 1 0 2 2 0 1 1 1 -60 -59 0 2.70 74 Pupil #006 16 6 0 0 1 2 2 1 1 0 1 -80 -79 0 2.90 80 Pupil #007 19 16 18 14 14 16 14 14 15 17 0 0 0 0 15.70 152 Pupil #008 17 9 12 8 0 1 0 3 0 0 5 -591 -586 0 5.00 84 Pupil #009 11 12 15 11 11 13 7 1 2 3 13 -1290 -1277 0 8.60 82 Pupil #010 9 4 4 9 13 10 11 9 10 10 1 -40 -39 0 8.90 84 Pupil #011 6 6 9 6 6 6 7 9 8 5 0 0 0 0 6.80 63 Pupil #012 10 6 9 6 12 15 13 13 9 7 0 -60 -60 0 10.00 97 Pupil #013 8 9 10 15 13 11 9 9 8 8 1 -40 -39 0 10.00 95 Pupil #014 12 8 9 13 10 11 11 10 9 7 0 -60 -60 0 10.00 95 Pupil #015 11 11 9 9 7 7 8 5 4 10 0 0 0 -1 8.02 77 Pupil #016 13 12 11 8 6 7 7 5 5 5 0 0 0 0 7.90 77 Pupil #017 9 9 9 8 1 1 1 2 1 1 3 -544 -541 0 4.20 51 Pupil #018 9 8 5 9 10 9 10 10 9 8 0 -40 -40 0 8.70 81 Pupil #019 9 1 0 2 0 0 1 3 2 0 0 -5 -5 0 1.80 47 Pupil #020 12 10 11 10 12 12 10 12 12 9 0 -80 -80 0 11.00 104 Pupil #021 8 5 5 5 9 8 8 10 9 8 0 0 0 -1 7.43 72 Pupil #022 10 8 5 4 8 12 9 10 12 6 0 0 0 0 8.40 81 Pupil #023 12 14 9 7 4 7 9 5 4 1 1 -33 -32 0 7.20 67 Pupil #024 11 10 10 10 8 12 13 6 2 0 15 -1466 -1451 0 8.20 88 Pupil #025 11 11 11 8 6 11 13 12 12 11 0 0 0 0 10.60 105 Pupil #026 8 7 6 5 8 9 11 9 9 11 0 -20 -20 0 8.30 81 Pupil #027 7 1 1 0 0 0 2 2 1 1 0 0 0 0 1.50 27 Pupil #028 9 5 4 6 9 10 11 8 6 6 0 -46 -46 0 7.40 69 Pupil #029 7 1 0 1 1 2 2 0 2 1 0 -7 -7 -1 1.68 39 Pupil #030 9 6 7 5 8 8 6 7 4 9 0 0 0 0 6.90 63 Pupil #031 13 13 8 11 10 15 10 10 10 9 0 -20 -20 0 10.90 103 Pupil #032 7 8 10 12 13 12 11 10 9 8 0 -60 -60 0 10.00 93 Pupil #033 6 4 2 0 3 1 1 2 7 3 0 0 0 0 2.90 23 Pupil #034 4 4 4 7 3 3 4 4 2 3 0 0 0 0 3.80 31 Pupil #035 7 4 6 3 3 3 3 3 3 3 0 0 0 0 3.80 33 Pupil #036 4 2 0 0 0 1 0 0 1 0 1 0 1 0 0.80 19 Pupil #037 9 5 3 5 6 3 4 3 2 3 0 0 0 0 4.30 37 Pupil #038 5 1 1 1 2 3 4 4 3 5 0 0 0 0 2.90 26 Pupil #039 10 15 11 10 8 12 12 6 1 2 10 -1629 -1619 0 8.70 52 Pupil #040 6 2 1 2 2 2 1 3 3 6 0 0 0 0 2.80 23
MT OT
c 10 8 7 7 7 8 8 7 6 6 - - - -3 7.48
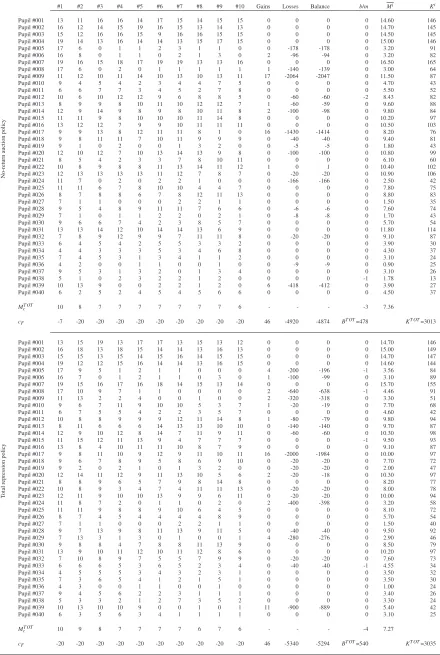
Table 4: Anti-fraud policies’ simulation (Continued)
Tests
#1 #2 #3 #4 #5 #6 #7 #8 #9 #10 Gains Losses Balance b/m Mi Ki
N o -r et u rn au ct io n p o li cy
Pupil #001 13 11 16 16 14 17 15 14 15 15 0 0 0 0 14.60 146 Pupil #002 16 12 14 15 19 16 15 13 14 13 0 0 0 0 14.70 145 Pupil #003 15 12 16 16 15 9 16 16 15 15 0 0 0 0 14.50 145 Pupil #004 19 14 13 16 14 14 13 15 17 15 0 0 0 0 15.00 146 Pupil #005 17 6 0 1 1 2 3 1 1 0 0 -178 -178 0 3.20 91 Pupil #006 16 8 0 1 1 0 2 1 3 0 2 -96 -94 0 3.20 82 Pupil #007 19 16 15 18 17 19 19 13 13 16 0 0 0 0 16.50 165 Pupil #008 17 6 0 2 0 1 1 1 1 1 1 -140 -139 0 3.00 64 Pupil #009 11 12 10 11 14 10 13 10 13 11 17 -2064 -2047 0 11.50 87 Pupil #010 9 4 5 4 2 3 4 4 7 5 0 0 0 0 4.70 43 Pupil #011 6 6 7 7 3 4 5 2 7 8 0 0 0 0 5.50 52 Pupil #012 10 6 10 12 12 9 6 8 8 5 0 -60 -60 -2 8.43 82 Pupil #013 8 9 9 8 10 11 10 12 12 7 1 -60 -59 0 9.60 88 Pupil #014 12 9 14 9 8 9 8 10 11 8 2 -100 -98 0 9.80 84 Pupil #015 11 11 9 8 10 10 10 11 14 8 0 0 0 0 10.20 97 Pupil #016 13 12 12 7 9 9 10 11 11 11 0 0 0 0 10.50 103 Pupil #017 9 9 13 8 12 11 11 8 1 0 16 -1430 -1414 0 8.20 76 Pupil #018 9 8 11 11 7 10 11 9 9 9 0 -40 -40 0 9.40 81 Pupil #019 9 1 0 2 0 0 1 3 2 0 0 -5 -5 0 1.80 43 Pupil #020 12 10 12 7 10 13 14 13 9 8 0 -100 -100 0 10.80 99 Pupil #021 8 5 4 2 3 3 7 8 10 11 0 0 0 0 6.10 60 Pupil #022 10 8 9 8 8 11 13 14 11 12 1 0 1 0 10.40 102 Pupil #023 12 13 13 13 13 11 12 7 8 7 0 -20 -20 0 10.90 106 Pupil #024 11 7 0 2 0 2 2 1 0 0 0 -166 -166 0 2.50 42 Pupil #025 11 11 6 7 8 10 10 4 4 7 0 0 0 0 7.80 75 Pupil #026 8 7 8 8 6 7 8 12 11 13 0 0 0 0 8.80 83 Pupil #027 7 1 1 0 0 0 2 2 1 1 0 0 0 0 1.50 35 Pupil #028 9 5 4 8 9 11 11 7 6 6 0 -6 -6 0 7.60 74 Pupil #029 7 1 0 1 1 2 2 0 2 1 0 -8 -8 0 1.70 43 Pupil #030 9 6 6 7 4 2 3 8 5 7 0 0 0 0 5.70 54 Pupil #031 13 13 14 12 10 14 14 13 6 9 0 0 0 0 11.80 114 Pupil #032 7 8 9 12 9 9 7 11 11 8 0 -20 -20 0 9.10 87 Pupil #033 6 4 5 4 2 5 5 3 3 2 0 0 0 0 3.90 30 Pupil #034 4 4 3 3 3 5 3 4 6 8 0 0 0 0 4.30 37 Pupil #035 7 4 5 3 1 3 4 1 1 2 0 0 0 0 3.10 24 Pupil #036 4 2 0 0 1 1 0 0 1 0 0 -9 -9 0 0.90 25 Pupil #037 9 5 3 1 3 2 0 1 3 4 0 0 0 0 3.10 26 Pupil #038 5 1 0 2 3 2 2 1 2 0 0 0 0 -1 1.78 13 Pupil #039 10 13 9 0 0 2 2 1 2 0 6 -418 -412 0 3.90 27 Pupil #040 6 2 5 2 4 5 4 5 6 6 0 0 0 0 4.50 37
MT OT
c 10 8 7 7 7 7 7 7 7 6 - - - -3 7.36
cF -7 -20 -20 -20 -20 -20 -20 -20 -20 -20 46 -4920 -4874 BT OT=478 KT OT=3013
T o ta l re p re ss io n p o li cy
Pupil #001 13 15 19 13 17 17 13 15 13 12 0 0 0 0 14.70 146 Pupil #002 16 18 13 18 15 14 14 13 16 13 0 0 0 0 15.00 149 Pupil #003 15 15 13 15 14 15 16 14 15 15 0 0 0 0 14.70 147 Pupil #004 19 12 12 15 16 14 14 13 16 15 0 0 0 0 14.60 144 Pupil #005 17 9 5 1 2 1 1 0 0 0 4 -200 -196 -1 3.56 84 Pupil #006 16 7 0 1 2 1 1 0 3 0 1 -100 -99 0 3.10 89 Pupil #007 19 15 16 17 16 18 14 15 13 14 0 0 0 0 15.70 155 Pupil #008 17 10 9 7 1 1 0 0 0 0 2 -640 -638 -1 4.46 91 Pupil #009 11 13 2 2 4 0 0 1 0 0 2 -320 -318 0 3.30 51 Pupil #010 9 6 7 11 9 10 10 5 3 7 1 -20 -19 0 7.70 68 Pupil #011 6 7 5 5 4 2 2 3 5 7 0 0 0 0 4.60 42 Pupil #012 10 8 8 9 9 9 12 11 14 8 1 -80 -79 0 9.80 94 Pupil #013 8 11 6 6 6 14 13 13 10 10 0 -140 -140 0 9.70 87 Pupil #014 12 9 10 12 8 14 7 11 9 11 0 -60 -60 0 10.30 98 Pupil #015 11 15 12 11 13 9 4 7 7 7 0 0 0 -1 9.50 93 Pupil #016 13 8 4 10 11 11 10 8 7 9 0 0 0 0 9.10 87 Pupil #017 9 8 11 10 9 12 9 11 10 11 16 -2000 -1984 0 10.00 97 Pupil #018 9 6 7 8 9 5 8 6 9 10 0 -20 -20 0 7.70 72 Pupil #019 9 2 0 2 1 0 1 3 2 0 0 -20 -20 0 2.00 47 Pupil #020 12 14 11 12 9 11 13 10 5 6 2 -20 -18 0 10.30 97 Pupil #021 8 8 9 6 5 7 9 8 14 8 0 0 0 0 8.20 77 Pupil #022 10 8 9 3 4 7 4 11 11 13 0 -20 -20 0 8.00 78 Pupil #023 12 11 9 10 10 13 9 9 6 11 0 -20 -20 0 10.00 94 Pupil #024 11 8 7 2 0 1 1 0 2 0 2 -400 -398 0 3.20 58 Pupil #025 11 11 9 8 8 9 10 6 4 5 0 0 0 0 8.10 72 Pupil #026 8 7 4 5 4 4 4 4 8 9 0 0 0 0 5.70 54 Pupil #027 7 1 1 0 0 0 2 2 1 1 0 0 0 0 1.50 40 Pupil #028 9 7 13 9 8 11 13 9 11 5 0 -40 -40 0 9.50 92 Pupil #029 7 13 3 1 3 0 1 0 0 1 4 -280 -276 0 2.90 46 Pupil #030 9 8 8 4 7 8 8 11 13 9 0 0 0 0 8.50 79 Pupil #031 13 9 10 11 12 10 11 12 8 6 0 0 0 0 10.20 97 Pupil #032 7 10 8 9 7 5 5 7 9 9 0 -20 -20 0 7.60 73 Pupil #033 6 6 6 5 3 6 5 2 3 4 0 -40 -40 -1 4.55 34 Pupil #034 4 5 5 5 3 4 3 2 3 1 0 0 0 0 3.50 32 Pupil #035 7 3 6 5 4 1 2 1 5 1 0 0 0 0 3.50 30 Pupil #036 4 3 0 0 1 1 0 0 1 0 0 0 0 0 1.00 24 Pupil #037 9 4 5 6 2 2 3 1 1 1 0 0 0 0 3.40 26 Pupil #038 5 3 3 2 1 2 7 3 5 2 0 0 0 0 3.30 24 Pupil #039 10 13 10 10 9 0 0 1 0 1 11 -900 -889 0 5.40 42 Pupil #040 6 3 5 6 3 4 1 1 1 1 0 0 0 0 3.10 25
MT OT
c 10 9 8 7 7 7 7 6 7 6 - - - -4 7.27
rn in g -T es tin g P ro ce ss in Cl a ss ro o m -A n E m p ir ic a l S im u la tio n M o d el 1 3
Table 5: Individual comparison between the anti-fraud policies
Pupil # 005 Pupil # 020 Pupil # 035 ( 92, 45) ( 23,121) ( 43,190)
Honest Free-rider Non given Honest Free-rider Non given Honest Free-rider Non given
N o n ri g o ro u s
K5= 385 K5= 0 K5= 234 K20= 285 K20= 0 K20= 179 K35= 201 K35= 0 K35= 83 KT= 8337 KT= 7222 KT= 8165 KT= 8006 KT= 7222 KT= 8165 KT= 8561 KT= 7712 KT= 8165 M5= 2.2 M5= 19.1 M5= 8.7 M20= 14.5 M20= 0.0 M20= 9.6 M35= 10.7 M35= 0.0 M35= 4.5 MT= 10.5 MT= 9.9 MT= 10.7 MT= 10.5 MT= 10.2 MT= 10.7 MT= 11.2 MT= 10.1 MT= 10.7 S= 26 S= 16 S= 24 S= 23 S= 23 S= 24 S= 30 S= 23 S= 24
Ma x im a l re p re ss iv e
K5= 385 K5= 0 K5= 383 K20= 385 K20= 0 K20= 283 K35= 201 K35= 0 K35= 169 KT= 11001 KT= 10640 KT= 11000 KT= 11046 KT= 10640 KT= 11000 KT= 8561 KT= 10906 KT= 11000 M5= 19.3 M5= 18.4 M5= 19.1 M20= 14.2 M20= 0.0 M20= 9.4 M35= 10.7 M35= 0.0 M35= 9.4 MT= 14.1 MT= 14.0 MT= 14.1 MT= 14.3 MT= 13.8 MT= 14.1 MT= 11.2 MT= 14.1 MT= 14.1
S= 36 S= 33 S= 34 S= 35 S= 33 S= 34 S= 30 S= 35 S= 34
S im p le a u ct io n
IV - Discussion and Concluding Remarks
Micro-simulation is an interesting technics, but we have to pay attention to our first results. Firstly, the behaviors we have modelled are unfortunately un-observable : chatting is rather un-observable, not free-riding16. So an experimental and questionnaire approach could help us to correct this drawback, especially to estimate the behavioral coefficients. Let’s now examine the empirical results that we’ll compare to the theoretical results, and present the future development.
An empirical analysis :Most of our results - Table 5 and 6 - are not amazing, because they came from a mechanical process. The knowledge level decreases if the teacher does not supervise his exams and tests. Nevertheless tables 5 and 6 tell us the rate level of knowledge doesn’t decrease so widely as we might have expected. No significant difference seems to exist between all the anti-fraud poli-cies - we mean #2, #3 and #4. The non-rigorous policy (#1) doesn’t incite pupils to pay attention during lessons (and to learn)17. The global level of knowledge decreases and so that, even if pupils can free ride during the test and exam, free riding becomes inefficient and useless - see Table 8.
To investigate the individual point of view, we have made three simulations - Table 7 : the basic simulation (non given), ”honest” one (the pupil never free-rides), and ”free-rider” one (the pupil free-rides). We found that in the ”honest” one, the level of knowledge is good, but in the ”free-rider” one, the free-rider pupil makes the other (especially the weakest one) fail. Free-riding is no use to the pupils who have the strongest intellectual capabilities. However, some other simulations seem necessary to confirm our first results, and to give a better inter-pretation of our indicators.
A recall of the theoretical context: The educational learning process is an important topic of the New-classical Economic Thought that was illustrated by G.S.Becker (1964). The learning is considered as an human investment process according to the competition model. However, this pattern is difficult to model in an individual level and on a short run18 - pupils rarely expect the returns from the tests anda fortiorifrom the lessons.
Table 6: General comparison of the anti-fraud policies
Criteria Nonrigourous Simple No-return Maximal policy auctions auctions repression policy policy policy
Winnings/Losses of fraud 0 -6119 -4874 -5294 Chatting 787 532 478 540
Max. level of knowledge 122 152 165 155 Min. level of knowledge 10 19 13 24 Total of knowledge 2009 3052 3013 3035
the end of the ninetieth century, the admitted assumption was that the economic agent has got freely all relevant information he needs to make his own deci-sion20. The Austrian economists denied this assumption, in explicating that the market mechanism is explained because of the lack of information of individual agents (F.A.Hayek, 1945) but the both economic thoughts agreed about the self-regulatory of the market economy. After 1929 crises, the Keynesian economists questioned this self-regulatory - F.A.Hayek (1937) linked it to the information’s process discovery. Information is dispersed among the individuals and available through the commodities price. Since the seventies, the information is became an important theoretical economic topic. It consisted to leave one of the assump-tions of the pure and perfect competition model and to explain the persistent dis-equilibrium of the market. Especially S.J.Grossman and J.E.Stiglitz proposed the paradoxical result that if a market is efficient in terms of information, all rele-vant information is already reflected in market prices, then no individual would be incited to acquire the information on which prices are grounded21.
An essay of theoretical interpretations of the model : One of the results of our model was that a classroom where the teacher leaves pupils free to commu-nicate has worse test results than one where teacher control the communication between pupils. We can translate this results so : when pupils expect free-riding without cost, they don’t learn lesson and then they have to ask neighbors during test. But neither individual pupil nor his neighbors are incited to learn, so no pupil is able to answer and so to succeed the test. If one of the pupils had learnt lesson, he would have produced public information, because he should have to give it to other pupils of the classroom. Except if he agrees to give information to other pupils, he has no interest to make so according to an effort/marks analysis22. We obtain a variant ofGrossman-Stiglitz effect” (S.J.Grossman and J.E.Stiglitz, 1980) linked to the public information : no individual could make profit in producing public information.
Fundamentally, pupils have a search information’s behavior to produce answer that teacher is waiting for. Such a behavior should obviously take place during lesson but not during test or exam. During our actual tests, we usually tell to our pupils thatcF (fraud cost) doesn’t represent a punishment butthe price they have
to pay to buy the cheating information. Consequently, pupils have to choose between two behaviors : producing answer (by learning) or ”buying” cheating information with a high probability to buy a wrong answer - they usually don’t know if they ”buy” the right answer.
The next development of the model: They should concern the expectation’s behavior25, the long run dynamics. Moreover, some functions should be revised, especially the encoding function26 Eij, the learning function Kij, the lesson func-tionLjwhich could be build as a network, and the mark parameterπijwhich could
be no more boolean. The design of knowledge provided by F.Machlup (1984) could help us to perform the specification27. Moreover, we’ll keep ournon a pri-oritheoretical point of view - our empirical model doesn’t belong to one economic thought or to one other - and we’ll try to understand the pupil’s behavior in front of knowledge, and finally, we hope so, get some criteria of the pupil’s rationality28 in the classroom.
Notes
1- See J.E.Brophy and T.L.Good, 1986, Teacher behavior and student achievement.Handbook
of Research on Teaching. M.C.Wittrock, New York: MacMillan, 328-357 or J.B.Carroll. 1963. A
model of school learning.Teachers College Record64: 723-733. Some mathematical models has
been developed (S.A.Goldman and M.J.Kearns, ”On the Complexity of Teaching”,Proceedings
of the Fourth Annual Workshop on Computational Learning Theory, ACM Press, 1991 ; J.Jackson
and A.Tomkins, ”A Computational Model of Teaching”,Proceedings of the Fifth Annual
Work-shop of Computational Learning Theory, ACM Press, 319-26, 1992 ; H.D.Mathias, ”A Model of
Interactive Teaching”,Journal of Computer and System Sciences. 54(3): 487-501, 1997)
accord-ing to an artificial intelligence point of view.
2- It is based on the experience of the author, who teaches economics, law and management in
high school and economics at university.
3- According to the micro-simulation principles described by G.H.Orcutt (1957), even if this
author initially promoted micro-econometric models. ”Microsimulation (a.k.a. microanalytic
sim-ulation) is a modelling technique that operates at the level of individual units such as persons, households, vehicles or firms. Within the model each unit is represented by a record containing a unique identifier and a set of associated attributes e.g. a list of persons with known age, sex, mar-ital and employment status; or a list of vehicles with known origins, destinations and operational characteristics. A set of rules (transition probabilities) are then applied to these units leading to simulated changes in state and behavior. These rules may be deterministic (probability=1), such as changes in tax liability resulting from changes in tax regulations, or stochastic (probability≤1), such as chance of dying, marrying, giving birth or moving within a given time period. In ei-ther case the result is an estimate of the outcomes of applying these rules, possibly over many time steps, including both total overall aggregate change and, crucially, the distributional nature of any change.”International Microsimulation Association. The microsimulation belongs to a more general individual modelling approach called Agent-based Computational Economics (a.k.a. ACE) - see N.Gilbert (2008, pp.17-18) about then links between Microsimulation and the ACE and L.Tesfatsion and K.L.Judd (Eds) (2006) for a wider overview.
4- See L.R.Anderson and C.A.Holt (1996) about an experimental analysis of information, but
where pupils and the teacher didn’t play their own role.
5- Especially, relationship between pupils and teachers could be view as a game. See our paper
6- The author would like to reassure the reader - especially if the reader is one of his pupils
or students. For the author, the behaviors are often translatable into some equations, never the individuals.
7- It was implemented in Turbo-Pascal 7.0.
8- This assumption is obviously restrictive, however we chosen it because of the ”French”
assessment system based on 20 points.
9- We have used the Random function.
10- We consider here the chatting as a direct conversation between two pupils (or students).
However, the role of the mobile in the pupil’s conversation is increasing and we’ll have to consider it - see P.L.P. Rau et al. (2008).
11- Term used according to an educational point of view and not according to an Austrian point
of view : ”[...]information is the stock of the existing known, while knowledge is the flow of new
and ever expanding areas of the known.” P.Boettke (2002, p.266).
12- In a future release, we could specify this learning function soKi
j=αi∗Ljwhere 0≤α≤1.
13- In a future release, we could consider it exists a hierarchy among the lesson’s items. One
couldn’t get theLnitem of the lesson if he has not previously theLmone withm<n. TheLvector
could be translated into a network.
14- In a future release, we could introduce aβ parameter soπi
j=β with 0≤β ≤1 according
the quality of the answer.
15- We have only consider data transmission between one ”sender” and one ”receiver”, but
cheating behavior is more complex (J.Kerkvliet and C.L.Sigmund, 1999). See P.W.Grimes & J.P.Rezek (2005) about the psychological determinants of the cheating behavior. Moreover, we should distinguish between girls and boys inside the classroom. About the gender differences of participation in class, see A.Caspi et al. (2008).
16- About cheating test, see W.H.Angoff, ”The Development of Statistical Indices for Detecting
Cheaters”,Journal of the American Statistical Association, 69 (345): 44-49, 1974 ; R.B.Frary,
T.N.Tideman and T.M.Watts, ”Indices of Cheating on Multiple-Choice Tests”,Journal of
Educa-tional Statistics, 2 (4): 235-56, 1977 ; and more recently G.J.Cizek,Cheating on Tests: How to Do It, Detect It and Prevent It, Lawrence Erlbaum Associates, 1999 ; B.A.Jacob and S.D.Levitt,
”Rotten Apples: an Investigation of the Prevalence and Predictors of Teacher Cheating”,Working
Paper NBER, 9413, 2003.
17- C.R.Tittle and A.R.Rowe (1974) had shown that the instructor who had a reputation of being
”lovable and understanding” had the greater amount of cheating in his class. Those who where most in need of points were willing to take greater risks. Furthermore, moral appeal did not
work for decreasing this amount. J.R.Magnuset al.(2002) have shown a sociocultural difference
between the cheaters, but J.Kerkvliet (1994) don’t find a typical profile of cheater.
18- E.A.Hanushek (1971) and more recently Rivkin S.G., E.A.Hanushek and J.F.Kain (2005),
C.Jaag (2006) provide a real neoclassical approach of the classroom, however, the teachers and the students remain some abstract optimizing agents.
19- Even later in the ACE - see T.Brenner (2006). The rare works come from Economics of
Education towards Economics of Information - let’s quote N.R.Netusil and M.Haupert (1995) about the New-classical school and Z.X.Zygmont (2006) about the Austrian Economics’ school.
20- See by e.g. I.Macho-Stadler and J.D.Perez-Castrillo (2001).
21- See P.J.Boettke (2001) and P.J.Boettke & P.Leeson (2003) about the recent critique of this
result.
22- However, we have supposed that the pupils were same psychological and we know it is not
always actual see R.Buda (1996,op.cit.).
23- The ”classical” assessment system often seems to lead pupils toward this wrong goal - see
Ownership and Job Design”, Journal of Law, Economics and Organization, 7 (Spring): 24-51, 1991.
24- Let’s add the Austrians generally consider that actors ”are not only confronted with their
lack of knowledge of the other person but also with their lack of self-knowledge” (T.Aimar, 2008). Our microsimulation approach could perhaps help to investigate about it.
25- Sometimes pupils have bad cost of fraud’s (c
F) expectations so that, free-riding does not
normally increase. They did’nt know the teacher’s policy or they mistake on it.
26- We should consider more sociopsychological determinants ; see M.A.Burke and T.R.Sass
(2008) about the peer-effect and the performance of the individuals in the classroom.
27- F.Machlup provided a classification of the individual knowledge. Thepractical knowledge
linked to the professional activities,intellectual knowledgeanswering to our curiosity,entertaining
knowledgelinked to leisures and our emotional stimulation, spiritual knowledge linked to our
religious beliefs, andrandomized knowledgeobtained without any search.
28- During quarterly, some pupils keep an actual ”boni-mali accounts”.
References
Aimar T. 2008. ”Self-ignorance: Towards an extension of the Austrian paradigm”,The Review
of Austrian Economics, 21(1), march: 23–43.
Anderson L.R. and C.A.Holt. 1996. ”Classroom Games: Information Cascades”,Journal of
Economic Perspectives. 10(4) (Fall): 187–93.
Becker G.S. 1964. Human Capital : A Theoretical and Empirical Analysis with Special
Reference to Education. New York. Columbia University Press. 187 p.
Boettke P.J. 2002. ”Information and Knowledge: Austrian Economics in Search of its
Unique-ness”,The Review of Austrian Economics. 15(4): 263–74.
Boettke P.J. and P.Leeson. 2003. ”The Austrian School of Economics (1950–2000)” in
J.Biddle and W.Samuels (Eds.) Blackwell Companion to the History of Economic Thought.
Ox-ford: Basil Blackwell Publishers.
Brenner T. 2006. ”Agent Learning Representation: Advice on Modelling Economic
Learn-ing”, in L.Tesfatsion and K.L.Judd,Handbook of Computational Economics - Agent-based
Com-putational Economics, Vol.2, Amsterdam, North-Holland: 895–947.
Buda R. 1996. ”Th´eorie des jeux et communication ´el`eves-enseignant”, Les Cahiers
p´edagogiques. 347: 63–64.
Buda R. 2000. ”Quantitative Economic ModellingvsMethodological Individualism ?”,
Com-munication at AHTEA Colloque : ”What does an Austrian Applied Economic look like ?”, Paris,
May 18th-19th 2000,Working Paper Modem, 9, University of Paris 10, 24 p.
Burke M.A. and T.R.Sass. 2008. ”Classroom Peer Effects and Student Achievement”, Work-ing Paper CALDER-Urban Institute. (June): 51 p.
Caspi A., E.Chajuta and K.Saporta. 2008. ”Participation in class and in online discussions:
Gender differences”,Computers and Education, 50(3), April: 718–724.
Chamberlin E.H. 1948. ”An Experimental Imperfect Market”,Journal of Political Economy.
56: 95–108.
Delemeester G. and J.Brauer. 2000. ”Games Economists Play: Noncomputerized Classroom
Games”,Journal of Economic Education. 31(4): p.406.
Fernandez R. and J.Gali. 1999. ”To Each According to...? Tournaments, Markets and the
Matching Problem under Borrowing Constraints”,Review of Economic Studies. 66(4): 799–824.
Gary-Bobo R. and A.Trannoy. 2004. ”Efficient tuition fees, examinations, and subsidies”,
Gilbert N. 2008.Agent-based Models, Los Angeles, SAGE Publications, Series: Quantitative Applications in the Social Sciences, 153, 98 p.
Grimes P.W. and J.P.Rezek. 2005. ”The Determinants of Cheating by High School Eco-nomics Students: A Comparative Study of Academic Dishonesty in the Transitional Economies”,
International Review of Economics Education. 4(2): 23–45
Grossman S.J. and J.E.Stiglitz. 1980. ”On The Impossibility of Informationally Efficient
Markets”,The American Economic Review. 70(3) (june): 393–408.
Hanushek E.A. 1971. ”Teacher Characteristics and Gains in Student Achievement: Estimation
Using Micro Data”,American Economic Review. 60: 280–288.
Hayek F.A. Von. 1937. ”Economics and Knowledge”,Economica. 4: 33–54.
Hayek F.A. Von. 1945. ”The Use of Knowledge in Society”,American Economic Review.
35(4): 519–30.
Jaag C. 2006. ”A Simple Model of Educational Production”,Working Paper Institute of Public
Finance and Fiscal Law, University of St.Gallen. (Jan.): 22 p.
Kerkvliet J. 1994. ”Cheating by Economics Students: A Comparison of Survey Results”,
Journal of Economic Education, 25(2) (Spring): 121–33.
Kerkvliet J. and C.L.Sigmund. 1999. ”Can We Control Cheating in the Classroom ?”,Journal
of Economic Education, 30(4) (Fall): 331–43.
Machlup F., 1984.Economics of Information and Human Capital - Knowledge : Its Creation,
Distribution, and Economic Significance, Vol 3, Princeton, Princeton University Press, 672 p.
Macho-Stadler I., J.D.Perez-Castrillo, 2001. An Introduction to the Economics of
Informa-tion: Incentives and Contracts, Oxford, Oxford University Press. 304 p.
Magnus J.R., V.M.Polterovich, D.L.Danilov and A.V.Savvateev. 2002. ”Tolerance to
Cheat-ing: A Cross-Country Analysis”,Journal of Economic Education, 33(2) (Spring): 125–35
Netusil N.R. and M.Haupert, (1995). ”The Economics of Information: A Classroom Experi-ment”, Journal of Economic Education, 26: 357–363.
Orcutt G.H. 1957. ”A New Type of Socio-Economic System”,The Review of Economics and
Statistics. 39(2) (may): 116–23.
Rau P.L.P, Q.Gaoa and L.M.Wu. 2008. ”Using mobile communication technology in high
school education: Motivation, pressure, and learning performance”,Computers and Education,
50(1), Jan.: 1–22.
Rivkin S.G., E.A.Hanushek and J.F.Kain. 2005. ”Teachers, Schools and Academic
Achieve-ment”,Econometrica. 73(2): 417-458.
Smith V.L. 1962. ”An Experimental Study of Competitive Market Behavior”, Journal of
Political Economy. 70: 111–37.
Tesfatsion L. and K.L. Judd (Eds). 2006. Handbook of Computational Economics, Vol.2
-Agent-Based Computational Economics, Amsterdam, North Holland, 872 p.
Tittle C.R. and A.R.Rowe. 1974. ”Fear and the Student Cheater”,Change, apr.: 47–48.
Zygmont Z.X., (2006). ”Debating the Socialist Calculation Debate: A Classroom Exercise”,