Effective Electromagnetic Log Data Interpretation
in Realistic Reservoir Models
M. Epov, C. Suhorukova, V. Glinskikh, M. Nikitenko, O. Nechaev, I. Surodina
Institute of Petroleum Geology and Geophysics SB RAS, Novosibirsk, Russian Federation Email: SuhorukovaKV@ipgg.sbras.ru
Received 2013
ABSTRACT
This paper analyzes some specific features of the numerical interpretation of high-frequency electromagnetic logging data in vertical, deviated and horizontal boreholes entering oil- and water-saturated formations. The interpretation is based on numerical modeling for signals.
Keywords: High-frequency Electromagnetic Logging; VEMKZ; 2D & 3D Modeling; Numerical Interpretation
1. Introduction
High-frequency electromagnetic soundings (VEMKZ) are designed for estimation of electrical resistivity dis-tribution around borehole [1]. The system involves five or nine three-coil arrays. Phase shift (and amplitude ratio in some tools [2]) between two neighboring coils are measured. Frequencies of an exciting field are chosen in the range from 875 kHz for a 2 m long probe to 14 MHz for a 0.5 m long probe. A sounding curve is a combina-tion of all probes signals at one measurement point. The curve demonstrates resistivity distribution from borehole to the uninvaded formation.
The VEMKZ method enables us to solve several prob-lems of practical importance in inclined and horizontal boreholes: estimation of formation and invaded zone resistivities; location of a reservoir top and base as well as gas-oil and water-oil contacts position with respect to a borehole; estimation of resistivities’ radial distribution from the borehole to formation in boreholes filled with high-conductive drilling mud.
In order to analyze the high-frequency electromagnetic soundings with realistic problem formulations algorithms were developed and calculation programs created, which implement the numerical analytic [3-5] and fi-nite-difference approaches [6,7], and finite-element method [8].
2. Electromagnetic Properties of Geological
Media
As has been observed for the decades of electrical log data numerical interpretation, every so often estimates of electrical resistivity (ρ) from electromagnetic sounding data and estimates from direct current sounding (lateral
logging sounding - LLS or Russian BKZ) disagree with each other.
The signals measured by various techniques were compared at intervals of thick homogeneous argillaceous deposits in marker beds, primarily, in terms of accuracy level assessment of the measuring. Signals from VEMKZ probes running at frequencies ranging from 0.875 to 14 MHz, in such formations tend to be consistent with model containing low resistance invasion zone, whereas BKZ signals are attributed to models either with missing invasion zone, or with narrow high-resistivity zone.
The said apparent contradiction is eliminated by an extension of geoelectric model parameters, like introduc-tion of dielectric permittivity (ε) allowing to exclude vasion zone from VEMKZ data interpretation in the in-tervals with impermeable rocks. Figure 3 shows the re-sult of fitting resistivity model and model including (ρ,) parameters according to VEMKZ and BKZ data for clayey formation drilled with nonsaline clay mud.
In the course of inversion a certain effective value was determined in which all processes of polarization in the heterogeneous medium are reflected. Consequently, with such an approach employed, estimate is often higher, than values for each individual component com-posing rocks. Different researchers suggest different es-timates for relative permittivity as high as several hun-dreds and thousands of relative units, based on the results of samples investigation (sandstone, loams, clay, [9]), and of LWD data interpretation (frequencies 0.4 and 2 MHz, pyritized shales, [10]), with frequency dispersion also being observed therewith.
frequency corresponds to its own value. Estimates of dielectric permittivity vs. frequency, obtained in several clayey formations, are consistent with the values ob-tained on shale samples [9].
Resistivity model is determined by BKZ data. Then such values are matched for the obtained ρ values, that calculated VEMKZ signals would fit with the measured ones. An example of such fitting in a clayey formation is shown in Figure 1. BKZ and VEMKZ measurements were simultaneous, and the well is drilled with nonsaline clay mud. BKZ signals are shown on the top in the se-lected resistivity model, in the middle are VEMKZ signals measured (the solid line) and calculated in resis-tivity model (the dotted line), at the bottom are VEMKZ signals measured and calculated in model with fitted ef-fective value . The fitted values are ρ = 3.4 ohm·m, and = 133 (rel.units).
[image:2.595.63.287.432.709.2]The VEMKZ signals and medium dielectric permittiv-ity relationships have been experimentally validated by the measurements performed in fresh waters of Lake Teletskoye [11]. As a result of numerical inversion of the signals recorded in the water and air-water boundary profiling, the values of electrical resistivity and relative dielectric permittivity of water (170 - 190 ohm·m and 62 - 67 rel. units) were obtained. The resistivity value was supported by independent measurements, and estimate corresponds to expected value for water with similar sa-linity.
Figure 1. BKZ and VEMKZ responses measured in clayey formation.
3. Realistic Problem Formulation and
Interpretation of Model
3.1. Borehole Rugosity Influence
Borehole rugosity is brought about when drilling both vertical [12], and inclined wells, in particular, using de-flectors [13]. They can be represented by spiral cuttings, periodic thickening (when drilling with deflectors), as well as individual fractures, or their system. Hole rugosi-ties, when filled with drilling mud with high electrical conductivity, cause quasiperiodic or chaotic big ampli-tude fluctuations (from a fraction of degree to several tens) to come up on the VEMKZ logs. The fact that changing signals account for intense rugosity of a bore-hole wall is supported by the correlation of caliper and VEMKZ logs.
According to the modeling results, signal fluctuations similar in form and amplitude are localized opposite shallow (some mm deep) cavities and thin fractures. The fluctuations period along the hole tend to associate with rugosity zones, and their amplitude increases with the cavity depths and operating frequency of probe, while the fluctuations pattern depends on the form of cavity and smoothness of their edges. The deviation from the level of signal in undisturbed rocks, appear to be identical on the amplitude, no matter whether it increases or de-creases. This allows to exclude the influence of cavities and fractures on the signal, by its averaging.
Identical fluctuations of signals are modeled in con-stant diameter boreholes, however, the borehole shape can be both sinusoidal and spiral [14]. The fluctuations period is equal to the spiral period in case of spiral bore-hole shape, while in a sinusoidal borebore-hole it is twice as less than the sinusoid period.
Relying on log data it is possible to evaluate rugosity parameters (Figure 2) as follows: on the basis of the fit-ting signals it was defined that cavity depth equals 0.007 m, fracture depth is 1.5 m, fracture width is 0.029 m, fracture resistivity 0.2 ohm·m.
3.2. Eccentricity Effect
High electrical conductivity of drilling mud cause tool eccentricity to influence VEMKZ logs in the borehole [14]. As calculations have it, the bigger the borehole ra-dius is, and the more contrasting are the electrical con-ductivities and the probe operating frequency, the higher is the influence. Therefore, in order to increase reliability of numerical interpretation of the data measured in wells with high electrical conductivity of drilling mud, proper correction must be made for eccentricity effect.
measured signal into apparent resistivity including the borehole and probe eccentricity effects, and also to cal-culate signals for the position on the borehole axes.
Figure 3 represents the result of algorithm applied to practical VEMKZ log data. Probe designation includes probe length in decimeters. The borehole radius is 0.062 m, resistivity of drilling mud is 0.03 ohm·m. When ec-centricity effect is taken into account in the clayey por-tion of formapor-tion, apparent resistivities for different probes become almost identical, and any noticeable di-vergence remains only in sandstones intervals.
Figure 2. Measured (the solid line) and modeled (the dot-ted line) VEMKZ responses. Hole radius = 0.108 m, mud resistivity = 0.1 ohm·m.
Figure 3. Measured responses and corrected responses.
With eccentricity effect taken into account, the sound-ing curve behavior changes, normally, in such a manner that when inversion is applied both thickness and resis-tivity of low-ohmic near-well zone tend to decrease. The said regularity is typical for VEMKZ logs in small-di- ameter boreholes with low resistive drilling mud.
3.3. Vertical Boreholes
Intermediate range of frequencies is used in VEMKZ, where signal is affected not only by diffusive, but also wave processes in the media. Phase shift and amplitude ratio measured in electromagnetic logging, when jointly applied, allow to reconstruct a full range of electrophysi-cal parameters. The paper addresses the solutions of for-ward linear and inverse two-dimensional problems on the basis of linearized representation of relative ampli-tude and phase characteristics of electromagnetic field (the theory of pseudogeometrical factors) [3]. With this problem formulation, it is possible to approximate al-lowance for offset currents as diffusion input from wave processes, caused by spatial distribution.
The linearized representations of electromagnetic sig-nals measured in conducting media, given the offset cur-rents, allow to effectively employ linear inversion in the solution of inverse problem. The solution of inverse problem includes the inversion of matrix composed of sensitivities calculated for phase shift and amplitude ratio to model parameters. Stage-by-stage approach is used for inversion. The first stage was reduced to one-dimen- sional inversion, which included identification of elec-trophysical parameters of both near-well zone and the formation, whereas during stage two they were specified (ρ, ) in the course of two-dimensional inversion.
Figure 4 presents the results of two-dimensional in-version of practical VEMKZ logs in the carbonate reser-voir interval penetrated by a well with the oil-based flu-ids. The previously identified thin beds testify to the ex-tent of the detailed investigation. Their thicknesses vary from 0.3 to 1.1 m, which appears to be significantly less than the probing system length.
Vertical distributions of ρ and in the invasion zone and within formation, based on the results of one-di- mensional (1) and two-dimensional (2) inversions are shown. The reliability of the results obtained can be validated in comparative analysis of the practical and calculated for the recovered model of synthetic curves for phase shifts, provided therewith. Average values of relative divergences on the considered interval account for 3% - 4% for short probes and do not exceed 2% for long ones.
3.4. Inclined and Horizontal Wells
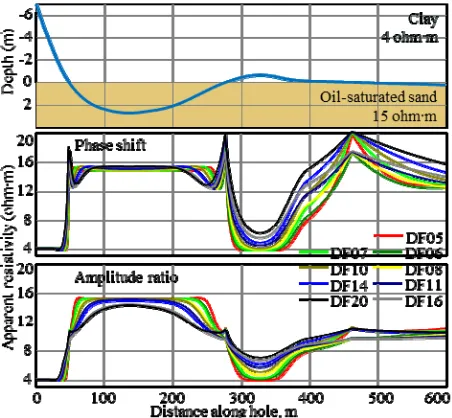
water-saturated reservoir, overlain by clayey deposits (Figure 5). The calculation has been made for horizontal beds. Clay resistivity is 4 ohm·m, resistivity of reservoir is 15 ohm·m. The borehole track (at the top of Figure 5)
Figure 4. The results of the inversion of practical VEMKZ logs within carbonate reservoir. The recovered 1D and 2D distributions are ρ (left) and (middle). Practical (solid lines) and synthetic (dotted lines) curves for phase shifts (right).
Figure 5. Model of a well with horizontal completion, penetrating the reservoir; and apparent resistivity logs.
is typical in the context of West Siberia geological envi-ronment. Apparent resistivity was calculated with the use of phase shift (a
, at the middle) and amplituderatio (a
A / A2 1
, at the bottom).It is known that when VEMKZ tool penetrates the bed boundary there will appear electrical charges propor-tional to the formation resistivity contrast ratio at this boundary. The said charges affect the responses. The influence is particularly strong for the phase shift (∆φ): the phase shift diagrams show maximum peaks, which correspond to the points of boundary crossing. The more inclined is the well the higher are the spikes. Responses from the second layer appear at the intervals where dis-tance from the boundary to the receivers is less than an offset from the transmitter to the nearest receiver (0.8 of probe length) the influence from, for example, another medium becomes evident, with apparent resistivity in the reservoir decreasing to 13 ohm·m and increasing in the clayey bed up to 6 - 7 ohm·m. All the apparent resistivity values reach true reservoir resistivity only in the lowest part of the well (80 - 200 m), where these points are re-moved further than the sonde length from boundary. In a higher conductive clayey cap rock the charge response is a bit lower and apparent resistivity reaches resistivity of the clayey formation at shorter distances from the boundary, about half of sonde length. True resistivity of the clayey formation was shown by sondes with length 0.5 - 1.1 m. The interval where the well extends almost along the boundary (360 - 600 m) is characterized, firstly, by difference in a
readings from sondes with various spacing, which would mean that there is an con-ductive invaded zone when traditional interpretation techniques are applied; and, secondly, diagrams for the main and additional groups of probes differ. The latter could be useful in distinguishing the effects, conditioned by nearing the horizontal boundary, or by lateral inho-mogeneity of reservoir properties.Amplitude ratio is less influenced by the charge than the phase shift. The a
A / A2 1
logs do not show big peaks, as the boundary crossing boundaries. The logs for two deepest sondes don’t reach the value of the reservoir resistivity. Sondes with lengths from 0.5 to 0.8 m reach the value of clay resistivity. The fact that shoulder effect is more significant for A / A2 1 than it appears for ∆φbecause the medium interval governing the amplitude ratio is bigger than the one governing the phase shift.
For water-saturated reservoirs in West Siberia resistiv-ity values are the same as for clays. Therefore, the fol-lowing reservoir model is divided into oil-water-satu- rated and water-saturated parts with resistivity of 15 ohm·m and 4 ohm·m, respectively (Figrue 6). The influence of the more conductive lower part takes place in the points located at a distance less than sonde length for a
[image:4.595.60.286.501.710.2]the interval, where the well is closer than half-length to the boundary, apparent resistivity at the a
curvesincreases and reaches maximal value at the lowest point of the well (0.3 m from boundary).
If we add a thin resistive layer to the model (usually it is carbonated sandstone with resistivity 30-100 ohm·m) it would significantly change a near the boundary. Let’s
place the layer with thickness 0.2 m and resistivity 50 ohm·m at the boundary. In the model at Figure 5 maxi-mum values a
near the boundary increase highly;under the boundary clay produces almost imperceptible lowering effect, whereas a
in the subhorizontalinterval are significantly enhanced. At the a
A / A2 1
a
diagram maximum peaks appear in points where the well crosses the boundary. In the model shown at the Figure 6
the influence of the lower medium on the phase shift proves even smaller. At the bottom part of the well a high resistive interlayer caused an increase in for both parameters and changed the shape of a
A / A2 1
curve related to the short sonde.In general, the increase in resistivity of high-resistance interlayer leads to the enhanced resistivity contrast and its greater growth whith the tool crossing boundaries, and to lesser dependence on the medium at the other side of the interlayer. We should note that the interlayer with these parameters is not reflected in the signals of induc-tion logging in vertical wells.
The calculations attest to the fact that the VEMKZ signals in deviated and horizontal wells depend neither on enclosing rocks nor contrasting interlayers in the beds thicker than double probe length. In the middle part of the layer of this kind its true resistivity will be shown by
a
diagrams for all the probes and a
A / A2 1
diagrams, but not including long-spaced probes. How-ever, characteristic behavior of signals near the bounda-ries and singlevalued dependence on the contrast of elec-trical properties allows to estimate formation parameters, using program for modeling responses of the deviated tool, in case the well track is known.Calculations of a signal in realistic model (including borehole) shows that the main curve features are not changed; it’s only the extreme points that are subject to changes caused by charges at the boundaries, which is evidenced by the sharp spikes accounting for short probes getting smoothed out. The signals of long probes (Epov, Martakov et al, 1999) are practically independent from conductive solution in the borehole. In practice, the commonly used diameter of a hole is 0.124 m, which dehotes its lesser impact.
4. High Performance GPU-based Computing
Parallel algorithms are developed for higher productivity in solving forward and inverse problems ofelectromag-netic logging in calculations on GPU [15]. Development of algorithms performed with the use of Nvidia CUDA technology. Data on efficiency of the developed parallel algorithms of modeling and inversion on GPU are ana-lysed. The most significant information is execution time of functions on the graphic device, device/host copying times, and time to copying ratio, and calculations on the device.
[image:5.595.309.538.299.517.2]Efficiency estimates of calculations on the Nvidia Ge- Force, Tesla graphic cards (Figure 7) were obtained. Ap- parently, when using GPU for parallel computations, it is possible to significantly increase productivity in com- parison with identical sequential calculations on the cen- tral processor (Intel Core 2 Quad 2.4 GHz). With the use of parallel algorithms and high-performance calculations on multiprocessing devices the creation of new automated interpretation systems has been reduced to practice.
Figure 6. The model of well with horizontal completion near oil-water contact and apparent resistivity logs.
[image:5.595.309.540.558.720.2]n created for the solution of forward
[1] “VIKIZ Metho as Boreholes,” Ed.
g-ova, M. N. Nikitenko and Ju. N.
ikitenko and K. V. Suhorukova, “On
ard 2D Problems
uency
Induc-5.
Algorithms have bee
Conclusions
of Eand inverse problems in numerical interpretation of elec- tromagnetic logs in realistic models of terrigenous reser- voirs penetrated by vertical, inclined or horizontal wells. There also have been developed algorithms for numerical correction of borehole rugosities and probe eccentricity effects. Effective algorithms for fast two-dimensional modeling and inversion were developed. Joint two-di- mensional inversion for relative amplitude and phase characteristics measured in electromagnetic logging al- lows to estimate electrical conductivity and dielectric permittivity. Algorithms for modeling in inclined and horizontal wells allow to investigate signal features when approaching and crossing boundaries. High-performance calculations on GPU allow to carry out numerical inter- pretation of data in real time.
REFERENCES
d for Logging Oil and G
by Epov and Antonov. Novosibirsk: Branch “Geo” of the Publishing House of the SB RAS, 2002, p. 112.
[2] M. Epov, K. Kayurov, I. Yeltsov, K. Sukhorukova, A. Petrov, A. Sobolev and A. Vlasov, “New SKL Logging Equipment, Methods and EMF Pro Programs for Data Interpretation,” Bureniei Neft, No. 2. 2010, pp. 16-19. [3] M. I. Epov and V. N. Glinskikh, “Electromagnetic Lo
ging: Modeling and Inversion,” Novosibirsk: Publishing house Geo, 2005, p. 98.
[4] M. I. Epov, K. V. Suhoruk
Antonov, “Application HILIS for Logging in Horizontal Wells,” Russian Geology and Geophysics, Vol. 39, No. 5. 1998, pp. 649-656.
[5] M. I. Epov, M. N. N
the Inversion of VIKIZ Data Measured in Thinly-Laminated Formations in Inclined Borehole,” Karotazhnik, No. 6, 2006, pp. 84-100.
[6] S. V. Martakov and M. I. Epov, “Forw
lectromagnetic Logging,” Russian Geology and Geo-physics, Vol. 40, No. 2, 1999, pp. 249-254.
[7] I. V. Surodina and M. I. Epov, “High-Freq
tion Data Affected by Biopolymer-Based Drilling Flu-ids,” Russian Geology and Geophysics, Vol. 53, No. 8, 2012, pp. 1062-1069.doi:10.1016/j.rgg.2012.06.008 [8] M. I. Epov, E. P. Shurina and O. V. Nechaev, “3D
For-ward Modeling of Vector Field for Induction Logging Problems,” Russian Geology and Geophysics. Vol. 48, No. 9, 2007. pp. 770-774.doi:10.1016/j.rgg.2006.05.003 [9] A. D. Talalov and D. S. Daev, “Structural Mechanism of
Luling, J. Rasmus, P.
Suhorukova, M. N. Nikitenko and A. N. Petrov,
Giniatov and I. N. Gulanov, “Hole
“VIKIZ Log
Fea-kova, M. N. Nikitenko, A. A.
I. B. Labutin, “EM Log-Frequency Dispersion of Electric Properties of Heteroge-neous Rocks,” Izvestiya Physics of the Solid Earth, Vol. 32, No. 8, 1996. pp. 683-691.
[10] B. I. Anderson, T. D. Barber, M. G.
N. Sen, J. R. Tabanou and S. M, “Haugland Observations of Large Dielectric Effects on LWD Propaga-tion-Resistivity Logs,” SPWLA 48th Annual papers, 2007.
[11] K. V.
“Numerical Interpretation of VIKIZ and VEMKZ Re-sponses in Waters of Lake Teletskoye,” Karotazhnik, No. 5, 2007, pp. 30-38.
[12] A. I. Gubina, G. Z.
wall Trough Influence on Logging Data,” Geologiya Neftii Gaza, No. 11. 1997. pp. 38-42.
[13] M. G. Zykina and V. G. Mamjashev,
tures in Horizontal Well,” Proceedings of International conference for geophysicists and geologists, Tyumen, December 3-7, 2007. CD.
[14] M. I. Epov, C. V. Suhoru
Gorbatenko and V. S. Arzhantsev, “Electromagnetic Sounding in Deviated and Horizontal Wells: Mathemati-cal Modeling and Real Data Interpretation,” SPE Russian Oil & Gas Exploration & Production Technical Confer-ence & Exhibition, Moscow, Russia 16-18th October 2012, Paper 162034-MS, p. 18.
[15] V. N. Glinskikh, M. I. Epov and