http://dx.doi.org/10.4236/ojpc.2013.34018
A Slightly Modified Expression of the Polar Surface
Area Applied to an Olfactory Study
Paul Laffort
Centre des Sciences du Goût, Dijon, France Email: [email protected]
Received August 21, 2013; revised September 20, 2013; accepted September 28,2013
Copyright © 2013 Paul Laffort. This is an open access article distributed under the Creative Commons Attribution License, which permits unrestricted use, distribution, and reproduction in any medium, provided the original work is properly cited.
ABSTRACT
The polar surface area of a molecule is currently defined as the surface sum over all polar atoms, primarily oxygen and nitrogen, also including their attached hydrogens (named PSA1 in the present study). Some authors also include sulfur and phosphor (PSA3). The slight modification suggested here is based on the fact that it is difficult to consider, on a theoretical point of view, hexavalent S and pentavalents N and P as polar atoms. Indeed, in these cases, all their periph- eral electrons are involved in bondings. We propose to define PSA2 using the initial definition extended to O, S, N, P, with the exception of hexavalent S and pentavalents N and P. In order to test this hypothesis, the three expressions PSA1, PSA2 and PSA3 have been applied in a QSAR to a physiological phenomenon called comfort olfactory per- ceived intensity, for the human responses to 186 odorants (QSAR stands for Quantitative Structure Activity Relation- ship). The PSA2 expression has been selected as the more suitable, associated with two other molecular properties (molar refraction and Van der Waals molecular volume).
Keywords: Polar Surface Area; QSAR; Cheminformatics; Olfaction; Honey-Bee; Psychophysics
1. Introduction
The polar surface area PSA is a quite fascinating mole- cular property on various aspects. On one hand, its defi- nition is chemically simple and precise, according to Palm et al. [1]: “the area occupied by nitrogen and oxy- gen atoms, and hydrogen atoms attached to these het- eroatoms”. On the other hand, its justification has been considered, in a first time, as strictly pharmacological, in the sense that it mainly reflects the molecular transport properties of drugs, particularly blood-brain barrier (BBB) penetration and intestinal absorption [1,2]. The consid- eration that PSA could also be involved in the physico- chemical field as a general criterion of polarity was un- expected, since, for example, strongly polar elements such as halogens, particularly fluorine, have always been excluded of its definition. We have however recently shown that PSA, associated with the Van der Waals mo- lecular volume Vw, is strongly involved in the charac- terization of the polarity of gas-liquid chromatography stationary phases [3].
As already pointed out in 2007 by Ertl [4], the number of publications in which PSA is involved has been growing exponentially since 1996. One of the more
noteworthy recent ones is due to Muehlbacher et al. [5], who have obtained a discrimination without misclassifi- cation between two sets of drugs (87 not BBB permeable compounds and 133 BBB permeable compounds), using only four molecular descriptors in which PSA has a key role.
The aim of the present study is firstly to propose, on theoretical considerations, a slightly modified definition of PSA, and then to test if one or another of its expres- sions reflects, possibly associated with other molecular characteristics, the biological phenomenon summarized hereafter in the particular case of human olfactory re- sponses.
The Comfort Olfactory Perceived Intensity
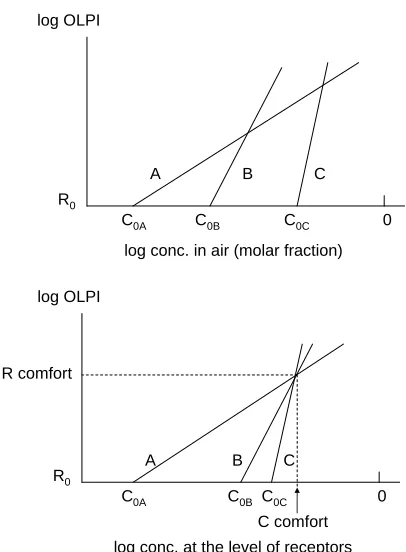
This phenomenon can be apprehended in the Figure 1.
log conc. in air (molar fraction) log OLPI
R0
C0A C0B C0C 0
B C
A
log conc. at the level of receptors log OLPI
R0
C0A C0B C0C 0 R comfort
C comfort
[image:2.595.71.274.82.358.2]A B C
Figure 1. Simplified representation of the comfort model for the olfactory perceived intensity (OLPI), already verified in the honey-bee. Concentrations are expressed in molar frac- tions. See details in text.
odorant concentration has to be considered at the recap- tors level rather than in air, in order to have a complete description of the phenomenon. This transformation is supposed to be obtained using a simple physicochemical property.
The bottom of the Figure 1 visualizes the results we
have already verified in the honey bee. Firstly, the con- vergence of the straight lines using electroantenographi- cal responses vs. fractions of saturated vapor pressures is high (r = 0.97, N = 59, F = 404, without outliers) [7]. Secondly, the ordinate of this point corresponds to an OLPI value associated with an optimal learning of olfac- tory recognition using an associating conditioning of the proboscical reflex [8-10]. For this reason we consider the ordinate of this convergence point as reflecting an opti- mal comfort. The abscissa of the convergence point, iden- tical for all odorants, is the logarithmic value of 1/250 of the maximal possible concentration at the receptor levels (expressed in molar fraction, i.e.−2.4).
Unfortunately, if the saturated vapor pressure at room temperature appears to be a suitable property to trans- form the top into the bottom of Figure 1 for honey-bees,
it is not the case for humans [11,12]. The explanation seems to be that the odorants reach the olfactory den- drites via a humid way in vertebrates, and through a dry route into pores-tubules in insects.
It should be noted that a synthesis of the experimenta- tions on honey-bees summarized above has not yet been published except in a shortened form [13], but has been orally presented in Dijon [13] and at the Monell Chemi- cal Senses Center [14].
2. Methods
2.1. Molecular Properties
Three groups of physicochemical properties have been tested, all derived from the molecular structure.
Properties more or less associated with the mo- lecular size, namely molar mass (M), Van der Waals
molecular volume (Vw), Van der Waals molecular sur- face (Sw), Molar refractivity (MR), molecular polariza- bility (PIZ), partition coefficient octanol-water (ClogP). All these properties have been got from the Chemaxon calculator-plugins [15]. A seventh expression has been considered, the solvation parameter of dispersion (δ) ac- cording to Laffort and Héricourt [16].
Properties of polar nature, rather independent of the molecular size, namely three different expressions of the polar surface area (PSA).
In a first time, PSA values have been established by Palm et al. [1,2] using sophisticated programs taking into account the molecular three-dimensional shape and its flexibility. Later, a very simple topological method using summation of surface contributions of polar fragments (termed TPSA) has been applied by Ertl et al. [17], ex- hibiting an excellent correlation with theoretical PSA values (r = 0.991, N = 34 810 substances).
The slightly polar atoms sulfur and phosphor have sometimes been taken into consideration [4,18]. We have called PSA1 the version with only O and N and PSA3 the version with O, N, S and P.
We have added a supplementary version, named PSA2, which includes O, S except when it is hexavalent, and N and P only when they are trivalent. That implies, among others, the exclusion of N in nitrates, S in sulfates, P in phosphates. This alternative choice is in agreement with the fact, according to the Lewis theory [19], that the pe- ripheral electrons involved in dative (or semi-polar) bonding should totally attributed to the more polar of the two concerned polar atoms. For example, four out five peripheral electrons of N in organic nitrates should to- tally be attributed to the two O, whereas the fifth electron is shared in a covalent bonding with one C. Therefore, this type of pentavalent nitrogen should totally be non polar, as it is visualized in Figure 2, and on the contrary
to that admitted in the PSA1 and PSA3 versions.
Figure 2. Graphical representation of the four dative (or semi-polar) bonds and the four covalent bonds of nitro- methane, according to the Lewis theory [19], clearly show- ing that the pentavalent nitrogen is not polar (absence of pairs of peripheral electrons not included in the bonding, whereas each oxygen has two pairs).
One induction/polarizability index, also independ- ent of the molecular size. This property is the ε solva-
tion parameter according to Laffort and Héricourt [16]. It is very similar to the descriptor named R2 or E according to Abraham and co-authors [20,21].
2.2. Olfactory Properties
Two experimental olfactory properties are needed to draw the top of the Figure 1 for humans:
Olfactory thresholds, which are, in some way, the in- tercept of the straight lines with the X axis,
The slopes of the straight lines, currently named pow- er law exponents.
Presently, the most complete and sure compilation of human olfactory thresholds in air has been established in 2011 by Van Gemert [22] and concerns 1150 odorants. However, an issue encountered with this type of compi- lation is that different authors obtain widely different values for the same substance. We have shown since 1963 [23] that these differences, mainly due to differ- ences in experimental protocols, can be considerably re- duced by assigning a specific weighting coefficient to each author’s results. Applying this method, Devos et al.
[24] have established in 1990 the most recent published collection of standardized thresholds, which concerns 529 odorants. An updated version of this compilation, unpublished, has been established in 1995 for 117 sup- plementary compounds [25].
It is also well established since 1969 that the exponent values differ, for a given odorant, with the experimental procedure [26]. Applying a similar method as for thresh- olds, Devos et al. [27] have published in 2002 the most recent and complete collection of standardized human power law exponents in air.
The updated compilation of olfactory thresholds and that of power law exponents according to Devos et al.
[25,27], concern in common 194 odorants. Eight com- pounds have been discarded of this overlapping set: Two selenium compounds for which part of the tested
molecular properties have not been found (ethanese- nelol and diethyl selenide).
Four charged compounds for which part of the tested molecular properties have not been found (ozone, 2-propenyl isocyanide, phenyl isocyanide and ammo- nia, i.e. NH4OH in aqueous solution).
Two alcohols presenting very small values of power law exponents (0.11 and 0.08 for 1-nonanol and 1- decanol respectively). Indeed, in the explored regres- sions of log of thresholds vs. other characteristics, the exponents being expressed in inverse values, they could present an excessive influence in the statistical proc- essing (expressed in inverse values, the 186 kept val- ues represent 1/3 of the total range when these two alcohols are included).
2.3. Statistical Tools
In addition to the Microsoft Excel Windows facilities for drawing diagrams and handling data sets, the SYSTAT® 10.2 for Windows has been applied for stepwise MLRA (Multidimensional Linear Regression Analysis).
3. Results
3.1. QSAR (Quantitative Structure/Activity Relationship) for 186 Odorants
We have compared all together the olfactory properties and the molecular parameters for the 186 compounds described in the Methods section, in order to embrace the larger possible of molecular features. The eleven mo- lecular parameters have been tested in multiple cross combinations using the SYSTAT stepwise MLRA. The best obtained regression is given by Equation (1):
0.8177 7.406 MR PSA2
p.ol 3.604 2.3
100 Vw
66 142 72
n (1)
tial F ratios corresponding to each term.
The global characteristics of the regression are: r = 0.77, N = 186, F = 89, without outliers
Equation (1) means that the stepwise regression analy- sis:
has confirmed the selection of 1/n,
has selected one of the terms more or less related to the molecular size, with a preference for molar refrac- tion,
has selected an expression of the polarity expressed by the ratio PSA2/Vw (preference of the new expres- sion of PSA and preference of Vw over Sw, among others),
has not selected the proposed induction/ polarizability expression (δ),
has not selected ClogP (partition coefficient octanol- water), very popular in pharmacology.
In order to simplify the Equation (1) handling, we pro- pose to name vertolf (as VERtebrates Olfactory Filter), the sum of its second and third terms:
7.406 MR PSA2
vertolf 3.604
100 Vw
(2)
Because of the definition of p.ol, all the terms of Equa- tion (1) can be multiplied by (−1) if the dependent vari- able is preferred as the log of threshold (also expressed in molar fraction):
0.8177
log threshold vertolf 2.3
n (3)
Equation (3) can be compared to that obtained by Patte
et al. [7] for the honey-bees:
0 0
log log
logC RC R logSVP 2.4
n (4)
A comparison between Equations (3) and (4) clearly shows an almost identical value of the constant, corre- sponding to the convergence point abscissa in the bottom of Figure 1 (i.e. approximately the log value of 1/200 the
supposed maximal concentration at the level of recap- tors).
In addition, [- vertolf] expression takes the place of log SVP, and we can interpret the numerator of the first term in Equation (3) as follows:
0
logRClogR 0.8177 (5) or:
0 6.57
C
R R
3.2. Nature of the Convergence Point Ordinate
The challenge is, as we saw, to check if the ratio RC/R0 equal to 6.57 corresponds or not to an easily noticeable
level, not too faint, not too strong.
The oldest attempt of a standardized scale of OLPI is credited to Allison and Katz in 1919 [28]. According to this method, named category scaling, when subjects are asked to classify odor intensities in, for example, one of these categories: odorless, very weak, weak, medium, strong, very strong, by attributing a such value as 0, 1, 2, 3, 4 or 5 to each of these categories, a linearity between these numbers and the logarithm of the concentration is observed. In some ways, these categories are directly pro- portional to a logarithmic expression of the true OLPI.
In a more accurate method, named olfactory matching, odorous stimuli under study may be compared with a se- ries of calibrated concentrations of a reference odor, gene- rally 1-butanol. Initiated in 1971 by Dravnieks [29], this procedure has been adopted as a standard method by the ASTM [30] and by AFNOR [31]. In the latter standard, correspondences between the two scales are indicated.
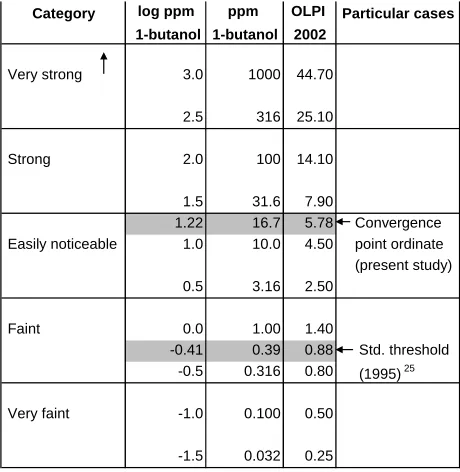
We have displayed in Figure 3 the corresponding val-
ues between the suprathreshold categories and the 1-but- anol concentration equivalences according to the AF- NOR standard X 43-103 [31]. Figure 3 also includes the
corresponding standardized values of the OLPI according to the equation proposed by Devos et al. [27]:
2002
OLPI 2C (6) in which C stands for a given odorous intensity expressed in terms of ppm of 1-butanol. From this equation, 10 units of OLPI2002 correspond to 50 ppm of 1-butanol.
Equation (6) applied to the threshold value of 1-bu- tanol according to Devos et al. [25] (0.39 ppm vol) gives
Category log ppm ppm OLPI Particular cases 1-butanol 1-butanol 2002
Very strong 3.0 1000 44.70
2.5 316 25.10
Strong 2.0 100 14.10
1.5 31.6 7.90
1.22 16.7 5.78 Convergence Easily noticeable 1.0 10.0 4.50 point ordinate (present study) 0.5 3.16 2.50
Faint 0.0 1.00 1.40
-0.41 0.39 0.88 Std. threshold -0.5 0.316 0.80 (1995) 25
Very faint -1.0 0.100 0.50
[image:4.595.308.538.466.702.2]-1.5 0.032 0.25
an OLPI2002 value of 0.88, and therefore the RC value of
rgence po
fort OLPI Here Proposed
f the convergence point in the bottom
nt in the same
tical tests obtained between ex- pe
Equation (1
Equation (5) becomes equal to 5.78 (0.88 × 6.57). It clearly appears in Figure 3 that the conve
int ordinate takes the upper place in the easily notice- able category and it should therefore be suitable to at- tribute it the label of comfort point. It should however be specified that this assertion implies the procedures taken as a benchmark in the two compilations of Devos et al.
and in the AFNOR standard as well, i.e. the natural sniff- fing. Using other procedures, as for example a relatively low flow rate of stimulation (e.g. 160 ml/min, as recom- mended by ASTM E544-99), leads to a reaching easily noticeable category for higher concentrations of 1-bu-tanol (around 87 ppm according to Dravnieks [32]). It can be seen in Figure 3 that this concentration using na-
tural sniffing corresponds to a strong category.
4. Discussion
4.1. The Model of Com
We have observed some satisfactory results in the previ-ous section, when compared to those previprevi-ously obtained in the honey-bee:
the abscissas o
of Figure 1 are very similar in both cases [values of
constants in Equations (3) an (4)] the ordinate of the convergence poi
bottom of Figure 1 corresponds in both cases to an
OLPI not too strong, not too faint, optimal for odorant recognition by the honey-bees (Introduction), and characterized as easily noticeable from human re- sponses (Figure 3).
By contrast, the statis
rimental and predicted human olfactory thresholds using Equation (1) are appreciably lower than in the honey-bee experimentation (r = 0.77 instead of 0.97, F = 89 instead of 404). One argument seems to indicate that this observation is rather due to a lack of accuracy of the biological data than the weakness of the model:
We have compared our above results using
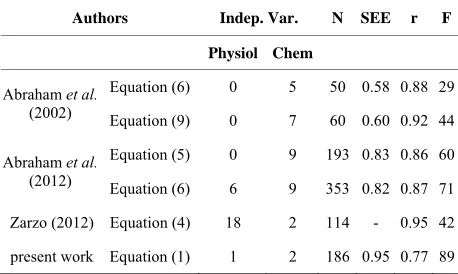
) with the predicted human olfactory thresholds in the three most recent publications on this QSAR topic, even not at all involved in the comfort concept here developed [33-35]. From the comparison of statistical tests, the F ratio values are moderate in all cases, and incidentally the best one is observed with the present study, as sum- marized in Table 1. As a reminder, F ratio value can be
obtained from the correlation coefficient r, the number of observations N (here the number of odorants) and the number of independent variables, according to Abdi [36]:
2
2
1 1
r N NbIndepVar
F
NbIndepVar
r (7)
Table 1. Comparative statistical tests SEE, r an for six QSAR models in three recent publ and in the present study.
d F observed ications [33-35]
Authors Indep. Var. N SEE r F
Physiol Chem
Equation (6) 0 5 50 0.58 0. 88 29
Abraham et al.
(2002) Equation (9) 60 0.60 0.92 44
present wor
0 7
Equation (5) 0 9 193 0.83 0.86 60
Abraham et al.
(2012) Equation (6) 6 9 353 0.82 0.87 71
Zarzo (2012)
k
Equation (4) 18 2 114 - 0.95 42
Equation (1) 1 2 186 0.95 0.77 89
of the pre tio
g to the considered statistical test, r or F. The statisti- i
The finding that the ratio of the polar surface area over olume (PSA/Vw) has
The cross validation on the comfort OLPI from honey- sponses in one hand, and on the ex- pression PSA/Vw from chromatographic phenomena and Obviously, the quality dic n differs accord-in
c ans appear to favor the second criterion, particularly when the number of independent variables increases in large proportion relatively to the number of observations (here the odorants under study).
One of the possible applications of the model of OLPI comfort proposed here is the prediction of power law exponents from experimental data sets of olfactory thresh- olds, which are known for much more odorants. That could be useful, for example, in the study of synergy and inhibition of olfactory mixtures, where it has be shown for a long time the role played by the power law expo- nents [37,38]. More generally speaking, the suprathresh- old OLPI using ASTM or AFNOR standard procedures should be applied more frequently in place or in com- plement of thresholds measurements.
4.2. The Polar Surface Area
the Van der Waals molecular v
been selected by the MLRA processing in the present study may be related to the involving of this expression in gas-liquid chromatographic phenomena, where it es- timates well the polarity of stationary phases (Laffort [3] ). At this stage, only the classical polar surface area,
i.e. PSA1, has been tested in chromatographic phenom- ena.
The PSA2 version, apparently more rational on a theo- retical point of view than the PSA1 and PSA3 versions, has been always, in the present study, preferred by the MLRA processing to the two other versions.
5. Conclusion
[image:5.595.308.537.123.260.2]the present psychophysical study in the other hand, pro- vides strong arguments in favor of a robustness of the whole.
6. Supporting Information
Supporting information associated with this article (nume-lfactory properties for equest to the author:
s David Laffort for his sincerely thanks the C ly interactive calculator. He
[1] K. Palm, K. Luthman, A. L. Ungell, G. Strandlund and
Artursson, “C rption with
Mole-cule Surface P harmaceutical
Sci-rical data of physicochemical and o
186 odorants) is freely available on r <[email protected]>.
7. Acknowledgements
The author warmly acknowledge editing assistance, and also mAxon Company for its freehe-
is strongly indebted to the co-authors involved in the previous studies making possible the present synthesis, more particularly: Gérard Arnold, Isabelle Canard, Mi- chel Devos, Andrew Dravnieks, Michel Etcheto, Pierre Héricourt, Pierrette Marfaing, François Patte, Yves Pichon, Jacques Rouault, and Leo Van Gemert. Thank you so much to all!
REFERENCES
P. orrelation of Drug Abso
roperties,” Journal of P ences, Vol. 85, No. 1, 1996, pp. 32-39. http://dx.doi.org/10.1021/js950285r
[2] K. Palm, P. Stenberg, K. Luthman and P. Artursson, “Po- lar Molecular Surface Properties Predi
Absorption of Drugs in Humans,” Pharmaceutical Re- ct the Intestinal search, Vol. 14, No. 5, 1997, pp. 568-571.
http://dx.doi.org/10.1023/A:1012188625088
[3] P. Laffort, “Solvation Parameters. Part 5: Physicochemi- cal Interpretation of Experimental Solvent V
tionary Phases of Gas-Liquid Chromatographalues for Sta-y,” Journal of Chromatography A, Vol. 1218, No. 26, 2011, pp. 4025-4033.
http://dx.doi.org/10.1016/j.chroma.2011.04.068
[4] P. Ertl, “Polar Surface Area,” In: R. Mannhold, Ed., Mo- lecular Drug P
pp. 111-126.
roperties, Wiley-VCH, Heidelberg, 2007,
http://dx.doi.org/10.1002/9783527621286.ch5
[5] M. Muehlbacher, G. M. Spitzer, K. R. Liedl and J. Korn- huber, “Qualit t n of Blood-Br
Permeability on a Large and Refined Dataset,” ative Predic io ain BarrJournal of ier Computer-Aided Molecular Design, Vol. 25, No. 12, 2011, pp. 1095-1106.
http://dx.doi.org/10.1007/s10822-011-9478-1
[6] P. Laffort and A. Dravnieks, “An Approach to a Physico- Chemical Model of
by Single Compounds,” Journal of Theoretic
Olfactory Stimulation in Vertebra
al Biology
tes , Vol. 38, No. 2, 1973, pp. 335-345.
http://dx.doi.org/10.1016/0022-5193(73)90178-1
tennogram Stimulus-Response Curves for 59 Odourants in the Honey-Bee Apis mellifica,” Jo
siology, Vol. 35, No. 9, 1989, pp. 667-675.
[7] F. Patte, M. Etcheto and P. Marfaing, “Laffort
Electroan-urnal of Insect Phy-
http://dx.doi.org/10.1016/0022-1910(89)90086-3
[8] P. Marfaing, J. Rouault and P. Laffort, “Effect of the Concentration and Nature of Olfactory Stimuli on the Proboscis Extension of Conditioned Honey
mellifica Ligustica,” Journal of Insect Physiology
Bees Apis
, Vol. 35, No. 12, 1989, pp. 949-955.
http://dx.doi.org/10.1016/0022-1910(89)90018-8
[9] I. Canard, “Influence de L’intensité du Stimulus et de L’ionisation de L’atmosphère sur L’apprentissage Olfac- tif de l’Abeille Apis mellifica Ligu
vior Biology, University of Paris, 1990.
stica,” DEA of Beha-
tember 1990. [10] I. Canard, M. Devos and P. Laffort, “Influence de L’in-
tensité du Stimulus et de L’ionisation de L’atmosphère sur L’apprentissage Olfactif de L’Abeille,” 10th Meeting on Insect Physiology, Toulouse, 19-21 Sep
[11] P. Laffort and F. Patte, “Derivation of Power Law Expo- nents from Olfactory Thresholds for Pure Substances,”
Annals of the New York Academy of Sciences, Vol. 510, 1987, pp. 436-439.
http://dx.doi.org/10.1111/j.1749-6632.1987.tb43582.x [12] F. Chauvin, “Amélioration de la Définition et de la
Détermination des Paramètres de Solubilité. Application à L’olfaction,” Ph.D.
Dijon, 1998. Thesis, University of Bourgogne,
ium, 12-13 September 1996, University of
op, 23-24 April
tion
Applied Informatics Jour-
[13] P. Laffort, “Apprentissage Olfactif chez L’Abeille: Quel- ques Résultats Susceptibles D’extension à l’Homme,” In: G. Bertrand, Ed., Le Goût, Network CLUSE, Third Cross- Border Sympos
Bourgogne, Dijon, 1998, pp. 579-584.
[14] P. Laffort, “The Concept of Comfort Concentration in Olfaction from Honey Bee Experimentation. Similarities and Differences with Human Olfaction,” Monell and TOSTQ Sweetness Conference Worksh
2001, Monell Chemical Senses Centre, Philadelphia. [15] ChemAxon Ltd., 2012.
http://www.chemaxon.com/products/calculator-plugins [16] P. Laffort and P. Héricourt, “Solvation Parameters of So-
lutes: An Attempt of Improvements in Characteriza and Determination,” The Open
nal, Vol. 2, 2008, pp. 22-31.
http://dx.doi.org/10.2174/1874136300802010022 [17] P. Ertl, B. Rohde and P. Selzer, “Fast Calculation of Mo-
lecular Polar Surface Area as a Sum of Fragment-Based Contributions and Its Applic
Drug Transport Properties,” Journal of Medical Chemis- ation to the Prediction of try, Vol. 43, No. 20, 2000, pp. 3714-3717.
http://dx.doi.org/10.1021/jm000942e
[18] S. Winiwarter, N. M. Bonham, F. Ax, A. Hallberg, H. Lennernäs and A. Karlén, “Correlation of Human Jejunal Permeability (in Vivo) of Drugs with Experi
Theoretically Derived Parameters. A
mentally and Multivariate Data Analysis Approach,” Journal of Medical Chemistry, Vol. 41, No. 25, 1998, pp. 4939-4949.
http://dx.doi.org/10.1021/jm9810102
a02261a002 762-785. http://dx.doi.org/10.1021/j
Hydrogen-Bonding: [20] M. H. Abraham, “Scales of Solute
Their Construction and Application to Physicochemical and Biochemical Processes,” Chemical Society Reviews, Vol. 22, No. 2, 1993, pp. 73-83.
http://dx.doi.org/10.1039/cs9932200073
[21] A. M. Zissimos, M. H. Abraham, A. Klamt, F. Eckert and J. Wood, “A Comparison between the Two General Sets of Linear Energy Descriptors of Abraham
Journal of Chemical Information and Com
and Klam
puter Sciences
t,” , Vol. 42, No. 6, 2002, pp. 1320-1331.
http://dx.doi.org/10.1021/ci025530o
[22] L. J. Van Gemert, “Compilations of Odour Threshold Values in Air, Water and Other Media,” Oliemans, Punter & Partners BV, Zeist, 2011.
[23] P. Laffort, “Essai de Standardisation des Seuils Olfactifs
t, P. Laffort and L. J
an Gemert,
erences in the Exponent Humains pour 192 Corps Purs,”Archives des Sciences Physiologiques, Vol. 17, 1963, pp. 75-105.
[24] M. Devos, F. Patte, J. Rouaul . Van Gemert, “Standardized Human Olfactory Thresholds in Air,” IRL Press, Oxford, 1990.
[25] M. Devos, J. Rouault, P. Laffort and L. J. V
“Standardized Human Olfactory Thresholds in Air,” Un-published Updating of the 1990 Version, 1995.
[26] W. S. Cain, “Odor Intensity Diff
of the Psychophysical Function,” Perception & Psycho- physics, Vol. 6, No. 6, 1969, pp. 349-354.
http://dx.doi.org/10.3758/BF03212789
[27] M. Devos, J. Rouault and P. Laffort, “Standardized Ol- factory Power Law Exponents in Man,” Editions Univer-sitaires de Dijon, Dijon, 2002.
[28] V. C. Allison and S. H. Katz, “An Investigation
.1021/ie50112a024 of Stenches and Odors for Industrial Purposes,” Journal of Industrial & Engineering Chemistry, Vol. 11, No. 4, 1919, pp. 336-339. http://dx.doi.org/10
dard
t of the Odour of Gaseous Effluent, Supra-Thre-
Structural Properties of Odorants,” In: R.
[29] A. Dravnieks, “Fundamentals of Odor Perception. Their Applicability to Air Pollution Control Programs,” NCASI Technical Bulletin, Vol. 54, 1971, pp. 1-27.
[30] ASTM Historical Standard: ASTM E544-99, “Stan Practices for Referencing Suprathreshold Odor Intensity,”
American Society for Testing and Materials, Philadelphia, 2004.
[31] AFNOR, “Air Quality, Olfactometric Measurements, Mea- suremen
shold Methods,” French Standard AFNOR NF X43-103, Paris, 1996.
[32] A. Dravnieks, “Correlation of Odor Intensities and Vapor Pressures with
A. Scanlon, Ed., Flavor Quality, Objective Measurement,
ACS Symposium Series, Vol. 51, American Chemical So- ciety, Washington DC, 1977, pp. 11-28.
http://dx.doi.org/10.1021/bk-1977-0051.ch002 [33] M. H. Abraham, J. M. R Gola, J. E. Cometto-Muñiz a
W. S. Cain, “A Model for Odour Thresholds,”
nd
Chemical Senses, Vol. 27, No. 3, 2002, pp. 95-104.
http://dx.doi.org/10.1093/chemse/27.2.95 [34] M. H. Abraham, R. Sánchez-Moreno, J. E.
ñiz and W. S. Cain, “An Algorithm for 35
Cometto-Mu- 3 Odor Detec- tion Thresholds in Humans,” Chemical Senses, Vol. 37, No. 3, 2012, pp. 207-218.
http://dx.doi.org/10.1093/chemse/bjr094 [35] M. Zarzo, “Effect of Functional Group and Carb
Length on the Odor Detection Threshold of Aliphatic on Chain Compounds,” Sensors, Vol. 12, No. 4, 2012, pp. 4105- 4112. http://dx.doi.org/10.3390/s120404105
[36] H. Abdi, “Multiple Correlation Coefficient,” In: N. J. Salkind, Ed., Encyclopedia of Measurement and Statistics, Sage, Thousand Oaks, 2007, pp. 648-651.
http://dx.doi.org/10.4135/9781412952644.n91 [37] P. Laffort, M. Etcheto, F. Patte and P Marfaing
tions of Power Law Exponent in Synergy and, “Implica- Inhibition of Olfactory Mixtures,” Chemical Senses, Vol. 14, No. 1, 1989, pp. 11-23.
http://dx.doi.org/10.1093/chemse/14.1.11 [38] P. Laffort, “Inhibitory Process of the Olf
tion,” French Patent No 9308079, CNRS,
![Figure 2. Graphical representation of the four dative (or semi-polar) bonds and the four covalent bonds of nitro- methane, according to the Lewis theory [19], clearly show- ing that the pentavalent nitrogen is not polar (absence of pairs of peripheral elec](https://thumb-us.123doks.com/thumbv2/123dok_us/7894953.742761/3.595.70.271.85.232/graphical-representation-covalent-according-pentavalent-nitrogen-absence-peripheral.webp)