http://dx.doi.org/10.4236/epe.2016.85024
Perceptions of Climate Change, Sea Level
Rise, and Possible Consequences Relate
Mainly to Self-Valuation of Science
Knowledge
Joanna Burger
1,2,3, Michael Gochfeld
2,3,4, Taryn Pittfield
3,5, Christian Jeitner
31Division of Life Sciences, Rutgers University, Piscataway, NJ, USA
2Environmental and Occupational Health Sciences Institute, Rutgers University, Piscataway, NJ, USA 3Consortium for Risk Evaluation with Stakeholder Participation, Rutgers University, Piscataway, NJ, USA 4Environmental and Occupational Medicine, Rutgers Robert Wood Johnson Medical School, Rutgers University,
Piscataway, NJ, USA
5Ecology and Evolution Graduate Program, Rutgers University, New Brunswick, NJ, USA
Received 26 March 2016; accepted 8 May 2016; published 11 May 2016 Copyright © 2016 by authors and Scientific Research Publishing Inc.
This work is licensed under the Creative Commons Attribution International License (CC BY).
http://creativecommons.org/licenses/by/4.0/
Abstract
people who rated their own scientific knowledge as average or below average.
Keywords
Perception, Decline, Climate Change, Sea Level Rise, Knowledge Level
1. Introduction
For at least three decades, agencies, governments, and intergovernmental panels have investigated and docu-mented the changing global climate and sea level rise, determining that these accelerating changes are largely anthropogenic, largely due to the use of fossil fuel [1]. Although there has been controversy, the role of humans, individually and collectively, in affecting climate change is now generally accepted among climate scientists [1]-[3]. The questions for public policy makers, managers, and those connected with energy development and use, therefore, are how rapidly is climate changing, how high will sea level rise, what impacts might occur in a given region (flooding, storms, agriculture), and what can be done to slow the changes or adapt to them. Re-cently, the New York City Panel on Climate Change [4] noted that sea level rise could be nearly a meter in the next 50 years, which would have severe consequences for New York City, for much of the coastal United States and elsewhere in the world. The large increase in people along coasts worldwide should lead to energy public policies that reduce global warming.
Over half of the US population lives along coasts [5][6], where severe storms and hurricanes are predicted to increase in number and severity [4][7][8]. Damages will be high because of vulnerability to coastal flooding and wind damage [9]. Severe storms threaten property, health, and the lives of people, tax emergency services and infrastructure, and disrupt personal safety and community operations [10]-[12]. Disasters are stressful to in-dividuals and communities [13][14], and can result in a lack of sufficient clean water, food and heat to survive. Further, severe storms and hurricanes can change the physiognomy of coastal ecosystems, causing harm to indi-vidual organisms and habitats [15]-[18]. Both the frequency and intensity of hurricanes and tropical storms, as well as sea level rise, are increasing [19]-[21], which will have a severe impact on ecosystem services [22].
The perceptions and concerns of the public are often an important factor in setting public policy and priorities, and influencing the directions of future commerce, industry, and energy development. Understanding both the perceptions of the public about environmental issues, and why they hold these views is critical to development of sound public policy and to gaining acceptance for such policies. Perceptions of professionals often differ from those of the general public, and may even differ among different professional groups [23]. Perceptions can be elicited in focus groups, or by questionnaires that either ask open-ended questions or ask for a rating (e.g. Likert scale) of the severity or importance of a list of possible concerns. Likert scales have been used to evaluate a va-riety of environmental concerns, including degradation caused by coastal nature-based tourism [24], environ-mental quality and eco-cultural attributes [25]-[27], land use [28]-[30], and management and restoration options [31]-[33]. Increasingly, the role of perceptions in climate change issues is being discussed as having an impor-tant role in public policy [34][35].
Several studies have claimed that there is a decreasing interest in climate change [36][37], and therefore in reducing greenhouse gases, while Krosnick [37] noted that awareness has not declined, but that people were less concerned about climate change than previously. There are thus two different aspects being considered: 1) whether knowledge or awareness of climate change is changing or declining; and 2) whether concern about cli-mate change is changing or declining. The former goes to knowledge, while the latter goes to concern, which eventually translates into public policy. Without concern about climate change, people are less likely to push for public policy to reduce anthropogenic effects on climate [34], and may be more likely to accept adaptation ap-proaches rather than preventive ones.
were different in 2012 and 2014 (before and after Superstorm Sandy). The survey was administered early in 2012 and again in 2014. We test the null hypotheses that there were no differences in perceptions of 1260 people interviewed as a function of year of the survey, age, gender, education, and self-evaluation of science knowledge. Our overall objective was to investigate the relationship between these variables and the ratings or perceptions of climate change and sea level rise and ecological degradation, flooding and other damages. While large, public polls, including those by newspapers, can provide information on overall trends, detailed surveys can provide information not only on whether people believe or are concerned about global climate change, but whether they understand the ecological effects. This study partly addresses the latter issue.
2. Methods
The overall protocol was to interview students and others in 2012 and 2014 in central New Jersey, asking them a series of questions about their own knowledge, global climate change and sea level rise, and the possible effects of sea level rise. The study area was centered around Rutgers University in New Brunswick, NJ. All procedures were approved by the Rutgers Human Subjects Review Board. The surveys were voluntary. No individual iden-tifiers were collected on the survey forms, and subjects were informed they could stop the survey at any time. The interview normally required about 10 minutes to complete. The 2012 survey (n = 639) was administered about six months after Hurricane Irene struck New Jersey with heavy rains and flooding and about six months before Superstorm Sandy. The 2014 survey (n = 621) was conducted about 18 months after Sandy.
College students and others were interviewed. Three major aspects were examined: 1) Perceptions about the occurrence of climate change and sea level rise; 2) What factors were causing climate change (e.g. anthropo-genic, natural); 3) Perceptions and concerns about how sea level rise will affect economics, recreational oppor-tunities, flooding, and habitat; and 4) Their self-evaluation of science knowledge, and whether they kept current with news. The overall objective was to understand the factors that affect perceptions about climate change and sea level rise, and to see whether views changed from 2012 to 2014, especially given the severity of the Sandy.
The survey had 25 questions, and subjects rated the questions on a Likert scale of 1 (no concern or no know-ledge) to 5 (major concern or high knowledge level). Questions related to their knowledge base, science base, whether global warming was occurring or not, whether it was caused by human activities or natural factors, whether sea level rise was occurring in New Jersey, and the world, and whether it affected them and other eco-system qualities (bird nesting habitat, fish breeding habitat, crab beds, bathable beaches, etc.). Demographic in-formation included age, sex, education (highest grade level), and whether they were science majors.
Differences among groups (years of education, sex, year of interview) were examined using Kruskal-Wallis non-parametric Analysis of Variance. A P < 0.05 was considered statistically significant. We also used General Linear Models [39] to examine the factors that accounted for variation in the Likert rating for the different ques-tions. Age and education were entered as continuous variables. Education was also analyzed as greater or less than 12 years and greater or less than 16 years.
3. Results
The two year samples were similar in composition with regard to age, sex, and years of education. The 2012 sample (n = 640) was 55% female, average age 29.8 with 15.4 years of education. The 2014 sample (n = 621) was 49% female, average age 31.5, and 14.0 years of education. The sex, age and education were not signifi-cantly different among years.
In 2012, 460 of 639 (72%) rated “global warming occurring” as “certain” (#4) or “very certain” (#5) com-pared with 453 of 621 (73%) in 2014. For “due to human activities” the numbers of “certain” or “very certain” were 71% in 2012 and 67% in 2014 and for sea level rise the numbers were 64% and 70%. There were few be-tween-year differences, so that we conducted combined as well as separate analyses. Self-rating of scientific knowledge was somewhat higher in 2012 than 2014 (mean 3.26 vs 2.99, P < 0.01). For impacts, there were more between year differences (Table 1) with higher ratings in 2012 for 3 outcomes and higher ratings in 2014 for 5 outcomes.
Table 1. Climate survey. Demographics of study population in New Jersey (2012, 2104). Given are overall means ± standard error for age, education, and income (N = 1260). NS = not significant. Rating scale: 1 = not at all, 5 = the most. Edu = edu-cation level. Sci know = Science knowledge.
Age 30.7 ± 0.43
Education
Less than high school 21.1%
In College or College graduate 66.7%
Graduate level education 12.2%
Income (thousands of dollars) 99.8 ± 2.3
Model Parameters in Model
P R-Square F Year Income Age Edu Sex Sci Know
On a scale of 1 - 5 (1 = not at all, 5 = the most)
Do you think global warming is occurring? <0.0001 0.08 13.1 * ***
Do you think it is due to human activities? <0.0001 0.07 10.6 ** ***
Is sea level rise related to global warming? <0.0001 0.08 12.2 ** *** ***
Is sea level rise occurring in the world? <0.0001 0.09 14 * ** ***
Is sea level rise occurring in New Jersey? <0.0001 0.044 6.4 * ***
Are the seasons earlier then they used to be? <0.0001 0.09 14.2 *** * ***
Do you consider yourself current with news? <0.0001 0.21 37.9 *** *** * ***
Was Sandy partly a result of global warming? 0.003 0.05 3.7 ***
Do you think it is due to natural factors? NS 0.01 1.6 *
Is sea level rise affecting NJ people other <0.0001 0.05 6.99 * ***
than those living along the shore?
Is sea level rise affecting your life directly? <0.0001 0.036 5.3 * ***
How will sea level rise affect
Flooding of houses along beach <0.0001 0.07 5.7 ** * *
Number of severe storms 0.0002 0.06 4.9 * **
Number of flood tides <0.0001 0.06 8.2 ***
Spawning areas for fish 0.0003 0.03 4.3 * **
Amount of bathable beaches <0.0001 0.035 5.2 ** * ***
Amount of salt marshes <0.0001 0.08 12.4 * * ***
Amount of crab beds <0.0001 0.05 6.8 * ** ***
Fishing opportunities NS 0.01 1.97 *
Amount of mudflat habitats <0.0001 0.09 13.8 * * * * ***
Road/bridge construction <0.0001 0.05 8.11 * * ***
Nesting success of birds <0.0001 0.04 6.6 * * ***
Nesting areas for birds <0.0001 0.06 8.5 ***
NJ economics <0.0001 0.07 11.3 ** * ** ***
Your economics <0.0001 0.05 6.9 ** *** * **
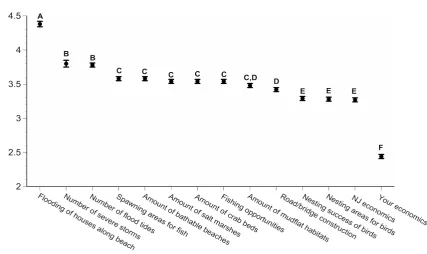
own economics the lowest (Figure 2). Although there were significant differences overall in their rating of other effects, the differences were not great (mean ratings ranged from 3.2 to 3.6).
Figure 1. Ratings of New Jersey residents when asked about science knowledge. Letters shown represent groups with no significant difference between them, determined by Duncan’s Multiple Range Test.
Figure 2. Ratings of New Jersey residents when asked about the effects of sea level rise. Letters shown represent groups
with no significant difference between them, determined by Duncan’s Multiple Range Test.
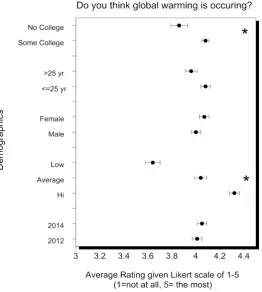
[image:5.595.106.534.408.662.2]Figure 3. Demographic responses of New Jersey Residents when asked whether they think global warming is occurring.
“Low, average, and high” refer to self-assessed knowledge.
year for sea level rise related to global warming. Values and tests are shown in Table 2 and Table 3. For all questions, subjects who rated their own science knowledge above average rated every question higher (except for whether global warming was due to natural causes, which was not significant). The differences as a function of year (2012 vs 2014) were few, small, and not always in the same direction.
While self-evaluation of science was significantly correlated with all variables, the correlations among va-riables were not high (R2 of 0.06 to 0.15). Thus education itself did not account for the self-evaluation of science level by subjects. The highest associations were between sea level rise and effects variables including directly affecting personal economics (R2 0.40, P < 0.0001).
4. Discussion
Since the 1980s, studies in different parts of the world have shown the growing complexity of public and official understanding of climate change, and its causes and impacts, despite a growing scientific certainty about anth-ropogenic climate change [34][36]. Krosnick [38] argued that although awareness has not declined, people are less concerned about climate change and greenhouse gases. We are apprehensive that the public discourse has shifted from slowing or preventing anthropogenic climate change (reducing greenhouse gases) to adaptation. In the present study, subjects rated the occurrence of global warming the highest, followed by the occurrence of sea level rise and its relationship to human activities. Thus, we identify four key issues: 1) the public’s awareness of global warming and sea level rise; 2) the public’s knowledge that it is a function of anthropogenic factors; 3) the public’s concern about global climate change; and 4) the public’s understanding or concern about potential ef-fects from global climate change and sea level rise. In addition, temporal aspects also affect public policy. This study, however, examined a population in and around a university community, and was not state-wide or larger. As with all surveys, it reflects the views of the subjects, but there is no reason to assume there were biases in the sampling.
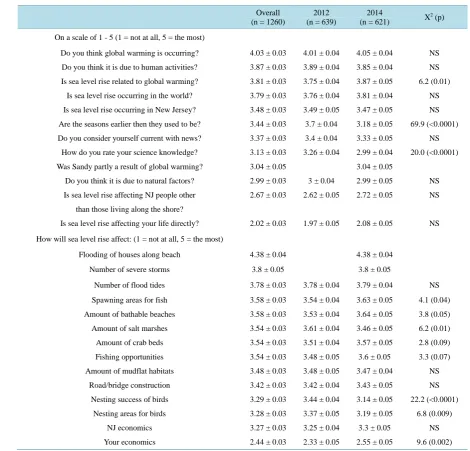
Table 2. Climate Survey. Given are means ± standard error and Kruskal-Wallis X2 (p).
Overall (n = 1260)
2012 (n = 639)
2014
(n = 621) X
2 (p)
On a scale of 1 - 5 (1 = not at all, 5 = the most)
Do you think global warming is occurring? 4.03 ± 0.03 4.01 ± 0.04 4.05 ± 0.04 NS
Do you think it is due to human activities? 3.87 ± 0.03 3.89 ± 0.04 3.85 ± 0.04 NS
Is sea level rise related to global warming? 3.81 ± 0.03 3.75 ± 0.04 3.87 ± 0.05 6.2 (0.01)
Is sea level rise occurring in the world? 3.79 ± 0.03 3.76 ± 0.04 3.81 ± 0.04 NS
Is sea level rise occurring in New Jersey? 3.48 ± 0.03 3.49 ± 0.05 3.47 ± 0.05 NS
Are the seasons earlier then they used to be? 3.44 ± 0.03 3.7 ± 0.04 3.18 ± 0.05 69.9 (<0.0001)
Do you consider yourself current with news? 3.37 ± 0.03 3.4 ± 0.04 3.33 ± 0.05 NS
How do you rate your science knowledge? 3.13 ± 0.03 3.26 ± 0.04 2.99 ± 0.04 20.0 (<0.0001)
Was Sandy partly a result of global warming? 3.04 ± 0.05 3.04 ± 0.05
Do you think it is due to natural factors? 2.99 ± 0.03 3 ± 0.04 2.99 ± 0.05 NS
Is sea level rise affecting NJ people other 2.67 ± 0.03 2.62 ± 0.05 2.72 ± 0.05 NS
than those living along the shore?
Is sea level rise affecting your life directly? 2.02 ± 0.03 1.97 ± 0.05 2.08 ± 0.05 NS
How will sea level rise affect: (1 = not at all, 5 = the most)
Flooding of houses along beach 4.38 ± 0.04 4.38 ± 0.04
Number of severe storms 3.8 ± 0.05 3.8 ± 0.05
Number of flood tides 3.78 ± 0.03 3.78 ± 0.04 3.79 ± 0.04 NS
Spawning areas for fish 3.58 ± 0.03 3.54 ± 0.04 3.63 ± 0.05 4.1 (0.04)
Amount of bathable beaches 3.58 ± 0.03 3.53 ± 0.04 3.64 ± 0.05 3.8 (0.05)
Amount of salt marshes 3.54 ± 0.03 3.61 ± 0.04 3.46 ± 0.05 6.2 (0.01)
Amount of crab beds 3.54 ± 0.03 3.51 ± 0.04 3.57 ± 0.05 2.8 (0.09)
Fishing opportunities 3.54 ± 0.03 3.48 ± 0.05 3.6 ± 0.05 3.3 (0.07)
Amount of mudflat habitats 3.48 ± 0.03 3.48 ± 0.05 3.47 ± 0.04 NS
Road/bridge construction 3.42 ± 0.03 3.42 ± 0.04 3.43 ± 0.05 NS
Nesting success of birds 3.29 ± 0.03 3.44 ± 0.04 3.14 ± 0.05 22.2 (<0.0001)
Nesting areas for birds 3.28 ± 0.03 3.37 ± 0.05 3.19 ± 0.05 6.8 (0.009)
NJ economics 3.27 ± 0.03 3.25 ± 0.04 3.3 ± 0.05 NS
Your economics 2.44 ± 0.03 2.33 ± 0.05 2.55 ± 0.05 9.6 (0.002)
Care should be taken in generalizing more broadly. The US Census Bureau provides data on educational attain-ment, most recently from a 2009 survey [40]. In the US 85% had a least a high school diploma (12 yrs. of edu-cation) and 28% had a bachelors (16 yrs.) or higher. For New Jersey the numbers are 87% and 35%.
4.1. Public Awareness of Climate Change and Sea Level Rise
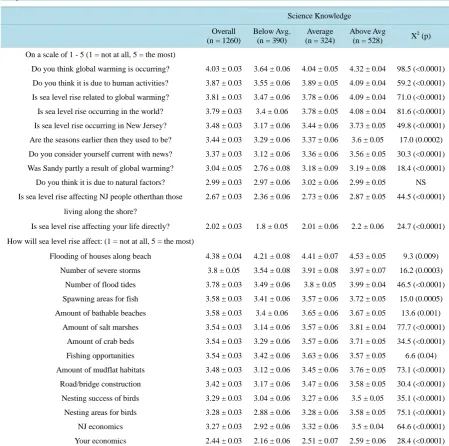
Table 3. Climate Survey. Rating scale: 1 = not at all, 5 = the most. Given are means ± standard error and Kruskal-Wallis
X2 (p).
Science Knowledge
Overall (n = 1260)
Below Avg. (n = 390)
Average (n = 324)
Above Avg
(n = 528) X
2 (p)
On a scale of 1 - 5 (1 = not at all, 5 = the most)
Do you think global warming is occurring? 4.03 ± 0.03 3.64 ± 0.06 4.04 ± 0.05 4.32 ± 0.04 98.5 (<0.0001)
Do you think it is due to human activities? 3.87 ± 0.03 3.55 ± 0.06 3.89 ± 0.05 4.09 ± 0.04 59.2 (<0.0001)
Is sea level rise related to global warming? 3.81 ± 0.03 3.47 ± 0.06 3.78 ± 0.06 4.09 ± 0.04 71.0 (<0.0001)
Is sea level rise occurring in the world? 3.79 ± 0.03 3.4 ± 0.06 3.78 ± 0.05 4.08 ± 0.04 81.6 (<0.0001)
Is sea level rise occurring in New Jersey? 3.48 ± 0.03 3.17 ± 0.06 3.44 ± 0.06 3.73 ± 0.05 49.8 (<0.0001)
Are the seasons earlier then they used to be? 3.44 ± 0.03 3.29 ± 0.06 3.37 ± 0.06 3.6 ± 0.05 17.0 (0.0002)
Do you consider yourself current with news? 3.37 ± 0.03 3.12 ± 0.06 3.36 ± 0.06 3.56 ± 0.05 30.3 (<0.0001)
Was Sandy partly a result of global warming? 3.04 ± 0.05 2.76 ± 0.08 3.18 ± 0.09 3.19 ± 0.08 18.4 (<0.0001)
Do you think it is due to natural factors? 2.99 ± 0.03 2.97 ± 0.06 3.02 ± 0.06 2.99 ± 0.05 NS
Is sea level rise affecting NJ people otherthan those 2.67 ± 0.03 2.36 ± 0.06 2.73 ± 0.06 2.87 ± 0.05 44.5 (<0.0001)
living along the shore?
Is sea level rise affecting your life directly? 2.02 ± 0.03 1.8 ± 0.05 2.01 ± 0.06 2.2 ± 0.06 24.7 (<0.0001)
How will sea level rise affect: (1 = not at all, 5 = the most)
Flooding of houses along beach 4.38 ± 0.04 4.21 ± 0.08 4.41 ± 0.07 4.53 ± 0.05 9.3 (0.009)
Number of severe storms 3.8 ± 0.05 3.54 ± 0.08 3.91 ± 0.08 3.97 ± 0.07 16.2 (0.0003)
Number of flood tides 3.78 ± 0.03 3.49 ± 0.06 3.8 ± 0.05 3.99 ± 0.04 46.5 (<0.0001)
Spawning areas for fish 3.58 ± 0.03 3.41 ± 0.06 3.57 ± 0.06 3.72 ± 0.05 15.0 (0.0005)
Amount of bathable beaches 3.58 ± 0.03 3.4 ± 0.06 3.65 ± 0.06 3.67 ± 0.05 13.6 (0.001)
Amount of salt marshes 3.54 ± 0.03 3.14 ± 0.06 3.57 ± 0.06 3.81 ± 0.04 77.7 (<0.0001)
Amount of crab beds 3.54 ± 0.03 3.29 ± 0.06 3.57 ± 0.06 3.71 ± 0.05 34.5 (<0.0001)
Fishing opportunities 3.54 ± 0.03 3.42 ± 0.06 3.63 ± 0.06 3.57 ± 0.05 6.6 (0.04)
Amount of mudflat habitats 3.48 ± 0.03 3.12 ± 0.06 3.45 ± 0.06 3.76 ± 0.05 73.1 (<0.0001)
Road/bridge construction 3.42 ± 0.03 3.17 ± 0.06 3.47 ± 0.06 3.58 ± 0.05 30.4 (<0.0001)
Nesting success of birds 3.29 ± 0.03 3.04 ± 0.06 3.27 ± 0.06 3.5 ± 0.05 35.1 (<0.0001)
Nesting areas for birds 3.28 ± 0.03 2.88 ± 0.06 3.28 ± 0.06 3.58 ± 0.05 75.1 (<0.0001)
NJ economics 3.27 ± 0.03 2.92 ± 0.06 3.32 ± 0.06 3.5 ± 0.04 64.6 (<0.0001)
Your economics 2.44 ± 0.03 2.16 ± 0.06 2.51 ± 0.07 2.59 ± 0.06 28.4 (<0.0001)
The strong relationship with self-perceived knowledge is consistent with the growing certainty in the under-lying scientific understanding of climate. One could argue that people who think global warming and sea level rise are occurring, as well as those who feel they are not occurring, or are not important or are of no concern, would both feel they had a high degree of scientific knowledge. The correlations between self-knowledge and the other variables were significant, but low (R2 of 0.06 to 0.15), indicating that self-knowledge was related to ratings for sea level rise and global warming, but not necessarily to the individual effects for either (e.g. loss of coastal habitats, spawning areas for fish).
4.2. Public Knowledge of the Anthropogenic Factors in Global Climate
Overall rating for human activities causing global warming was high (mean of 3.9 ± 0.03) compared to climate change being related to natural causes (mean of 2.99 ± 0.03). This difference is fairly great. For both responses there was no difference between 2012 and 2014. The significant difference in ratings was a function of self- evaluation of science knowledge. Those with higher self-evaluation rated each higher. This argues for a sound energy development policy by governmental officials.
4.3. Public Concern about Climate Change and Sea Level Rise
The present study did not ask subjects directly whether they were concerned about global warming, but rather asked whether sea level rise was affecting their life directly, and whether it affected their economics. The lowest mean ratings of the entire survey were given to these two questions (e.g. mean of 2.0 and 2.4 respectively, see Figure 1 and Figure 2), and the average ratings were way below the other ratings. Ratings for awareness of global warming and sea level rise were high, but their concern for themselves was low. This was surprising giv-en that they rated ecological effects much higher (e.g. means of 3.2 to 3.8). Thus, it appears that the subjects in-terviewed believe there is global warming and sea level rise, that it is due to human activities, and that it affects ecological habitats, but that it does not affect them directly. The latter may account for a general lack of interest in public policy or pressuring the government to do something about greenhouse gases and global warming.
4.4. Public Understanding of How Sea Level Rise (or Climate Change) Affects Them
While the subjects did not rate the impact of global warming and sea level rise high for themselves, they did rate the effects on ecosystems and habitats higher. That is, they rated the effect of sea level rise high on the number of storms and floods, and on habitat. Habitat included spawning areas for fish, amount of beaches and salt marshes, amount of crab beds and mudflats, and nesting areas for birds. Thus, the subjects interviewed did not believe the effects of global warming and sea level rise were personal, except for the fishing opportunities and number of floods.
The findings from the present study are in agreement with Carlton and Jacobson [35], who reported that risks to the physical environment were of greater concern than economic risks. Further, Lieske et al. [8] reported that although subjects in focus groups were very concerned about climate change (81%), far fewer (36%) considered themselves to be personally at risk. Partly this represents optimistic bias, the belief by individuals that their situ-ation is always better than that of others in general [43], or that the effects will happen to geographically or temporally distant people and places [2]. This view has been termed “remote indifference” (attributed to poverty reformer Jacob Riis, by Johnson [44]). Lieske et al. [8], however, found that these concerns were somewhat re-lated to age, education and gender, but they did not examine self-evaluation of science knowledge (as we did in this study).
4.5. Temporal Aspects
There is considerable discussion about whether knowledge and concerns about global warming are increasing or decreasing [8][34][45][46]. Partly the issue revolves around whether there are long-term changes in perception, and whether perceptions change with events or climate anomalies [41]. Public perceptions influence public pol-icy [34], making it important to determine if perceptions are changing. Borick and Rabe [47] reported a re-bounding in public opinion in the US about climate change, but longer term trends are still to be shown.
Although year was significant for the ratings of some variables the ratings were higher in 2012 for some and higher in 2014 for others. We had predicted that ratings would be higher in 2014 due to the severity of supers-torm Sandy, which devastated New Jersey, causing deaths, billions of dollars in damage, power outages, and disruptions for several months to years [40][50]. Few New Jerseyians escaped direct impacts of that storm. And it engendered predictions of more storms in the future. However, year entered only about half of the variables examined, and was highly significant only for “are the seasons earlier”. Similarly, education (college vs no col-lege) entered only 12 variables as a significant variable.
4.6. Public Policy Implications
in perception of climate change are permanent or change with weather anomalies [41]. Changing public policy with respect to a topic such as greenhouse gases and other anthropogenic causes of climate change, is difficult when the causal steps are removed from the general public. The expense required to curb greenhouse gases by governments’ means that such fundamental changes will not occur without public support [34]. The public has a critical role to play, for example in energy conservation, and must be willing to make major behavioral and economic changes. To some extent the doomsday predictions may actually lower public concern or initiative or self-efficacy, while increasing knowledge. The role of self-evaluation of science knowledge is important for educators, managers, and public policy makers because it suggests that providing sufficient information, making information available in different forms of social media as well as educational institutions, and developing in-formative as well as entertaining social media vehicles is critical to advancing awareness of global warming, sea level rise, and the consequences of both. Appealing to self-evaluation of science knowledge may provide a me-thod of providing scientific information about global warming and sea level rise. In other words, improving how a person views their knowledge about science may have a positive effect on the recognition of global warming, on potential impacts, and on self-interest.
The lack of an age effect for many of the variables suggests that it is not a matter of just reaching out to col-lege-age students, to middle-age people in the work force, or to retirees. Educational materials that capture the interest of viewers should address the entire spectrum of people, which suggests targeted devices for different age groups, both in terms of the message and the means of communication (TV, newspapers, brochures, and so-cial media).
Finding solutions to climate change may be a global, inter-governmental issue [3], but dealing with local flooding and storm damage from sea level rise and climate change is not. Suggesting managed retreat of local communities in response to projected sea level rise requires a sophisticated knowledge of sea level rise and fu-ture projections [48]-[51]. Perceptions of sea level rise projections and risk strongly influences willingness to engage in community options, such as managed retreat [52] or construction of storm worthy dune systems or dikes [53].
5. Conclusion
Overall, the results of this study show an awareness and belief in global change and sea level rise, and in the po-tential physical and ecological consequences of them. However, subjects rated the effect of climate change and sea level rise on themselves markedly lower than other effects. This may partly explain a lack of public pressure on officials to deal with greenhouse gases. Thus, self-interest is not yet a motivating factor for their other ratings. We suggest that it is critical to increase both knowledge (which in turn will improve their self-evaluation of science knowledge) of climate change and sea level rise, and increasing awareness of the connections between physical/ecological effects and their own well-being. Accomplishing this will require a multi-dimensional, mul-ti-media approach that targets different age groups. This is not because their views differ, but because they use different media to seek knowledge.
Acknowledgements
We thank the many people who participated in these interviews, including particularly Nick Pollock and Natalie Lemanski. The work was supported by the NIEHS under grant P30ES005022. The views are those of the au-thors and do not represent those of the funding agency.
References
[1] Intergovernmental Panel on Climate Change (IPCC). Climate Change 2007: Synthesis Report. Contribution of Work-ing Groups I, II and III to the Fourth Assessment Report of the Intergovernmental Panel on Climate Change. Geneva, 2007. https://www.ipcc.ch/pdf/assessment-report/ar4/syr/ar4_syr_frontmatter.pdf
[2] Leiserowitz, A.A. (2005) American Risk Perceptions: Is Climate Change Dangerous? Risk Analysis, 25, 1433-1442. http://dx.doi.org/10.1111/j.1540-6261.2005.00690.x
[3] Intergovernmental Panel on Climate Change (IPCC) (2014) Impacts, Adaptation, and Vulnerability. Copenhagen. http://www.ipcc.ch/report/ar5/wg2/
[5] National Oceanographic and Atmospheric Administration (NOAA) (2013) Communities: the US Population Living in Coastal Watershed Counties. http://stateofthecoast.noaa.gov/population/welcome.html
[6] Crosset, K., Cultiton T., Wiley, P. and Goodspeed, T. (2013) Population Trends along the Coastal United States 1980- 2008. http://oceanservice.noaa.gov/programs/mb/pdfs/coastal_pop_trends_complete.pdf
[7] Lane, L.K., Charles-Guzman, K., Wheeler, Z., Abid, N., Graberm, N. and Mattem, T. (2013) Health Effects of Coastal Storms and Flooding in Urban Areas: A Review and Vulnerability Assessment. Journal of Environmental and Public Health, 2013, Article ID: 913064. http://dx.doi.org/10.1155/2013/913064
[8] Lieske, D.J., Wade, T. and Roness L.A. (2014). Climate Change Awareness and Strategies for Communicating the Risk of Coastal Flooding: A Canadian Maritime Case Example. Estuarine and Coastal Shelf Science, 140, 83-94. http://dx.doi.org/10.1016/j.ecss.2013.04.017
[9] Genovese, E., and. Przyluski, V. (2013) Storm Surge Disaster Risk Management: The Xynthia Case Study in France.
Journal of Risk Research, 316, 825-841. http://dx.doi.org/10.1080/13669877.2012.737826
[10] Hobfoll, S.E., Watson, P. Bell, P.C.C, and Bryant, R.A. (2007) Five Essential Elements of Immediate and Mid-Term Mass Trauma Intervention: Empirical Evidence. Psychiatry, 70, 283-315. http://dx.doi.org/10.1521/psyc.2007.70.4.283 [11] McLaughlin, K.A., Fairbank, J.A., Gruber, M.J., Jones, R.T., Osofsky, J.D., Pfefferbaum, B., Sampson, N.A. and Kessler, R.C. (2010) Trends in Serious Emotional Disturbance among Youths Exposed to Hurricane Katrina. Journal of American Academy of Child and Adolescent Psychiatry, 49, 990-1000. http://dx.doi.org/10.1016/j.jaac.2010.06.012 [12] Shear, M.K., McLaughlin, K.A., Ghesquiere, A., Gruber, M.J., Sampson, N.A. and Kessler, R.C. (2011) Complicated
Grief Associated with Hurricane Katrina. Depression and Anxiety, 28, 648-657. http://dx.doi.org/10.1002/da.20865 [13] North, C.S., Oliver, J. and Pandya, A. (2012) Examining a Comprehensive Model of Disaster-Related Posttraumatic
Stress Disorder in Systematically Studied Survivors of 10 Disasters. American Journal of Public Health, 102, e40-e48. http://dx.doi.org/10.2105/ajph.2012.300689
[14] Shultz, J.M. and Neria, Y. (2013) Trauma Signature Analysis: State of the Art and Evolving Future Directions. Disas-ter Health, 1, 4-8. http://dx.doi.org/10.4161/dish.24011
[15] Sallenger, A.H. (2005) Storm Impact Scale for Barrier Islands. Journal of Coastal Research, 16, 890-895.
[16] Nordstrom, K.F. and Mitteager, W.A. (2001) Perceptions of the Value of Natural and Restored Beach and Dune Cha-racteristics by High School Students in New Jersey, USA. Ocean and Coastal Management, 44, 545-559.
http://dx.doi.org/10.1016/S0964-5691(01)00065-5
[17] Pries, A.J., Miller, D.L. and Branch, L.C. (2008) Identification of Structural Features That Influence Storm-Related Dune Erosion along a Barrier Island Ecosystem in the Gulf of Mexico. Journal of Coastal Research, 24, 168-176. http://dx.doi.org/10.2112/06-0799.1
[18] Houser, C., Hapke, C. and Hamilton, S. (2008) Controls on Coastal Dune Morphology, Shoreline Erosion and Barrier Island Response to Extreme Storms. Geomorphology, 100, 223-240. http://dx.doi.org/10.1016/j.geomorph.2007.12.007 [19] Michener, W.K., Blood, E.R., Bildstein, K.L., Brison, M.M. and Gardner, L.R. (1997) Climate Change, Hurricanes and
Tropical Storms, and Rising Sea Level in Coastal Wetlands. Ecological Applications, 7, 770-801. http://dx.doi.org/10.1890/1051-0761(1997)007[0770:CCHATS]2.0.CO;2
[20] Zhang, K., Doublas, B.C. and Leatherman, S.P. (2004) Global Warming and Coastal Erosion. Climatic Change, 64, 41- 58. http://dx.doi.org/10.1023/B:CLIM.0000024690.32682.48
[21] Galbraith, H., DesRochers, D.W., Brown, S. and Reed, J.M. (2014) Predicting Vulnerabilities of North American Sho-rebirds to Climate Change. PLoS ONE, 9,e108899. http://dx.doi.org/10.1371/journal.pone.0108899
[22] Costanza, R., de Groot, R., Sutton, P., van der Ploeg, S., Anderson, S.J., Kubiszewski, I., Farber, S. and Turner, R.K. (2014) Changes in the Global Value of Ecosystem Services. Global Environmental Change, 26, 152-158.
http://dx.doi.org/10.1016/j.gloenvcha.2014.04.002
[23] Slovic, P. (2001) The Perception of Risk. Earthscan, London.
[24] Priskin, J. (2003) Tourist Perceptions of Degradation Caused by Coastal Nature-Based Recreation. Environmental Management, 32, 189-204. http://dx.doi.org/10.1007/s00267-002-2916-z
[25] Greenberg, M. (2005) Concern about the Environmental Pollution: How Much Difference Do Race and Ethnicity Make?A New Jersey Case Study. Environmental Health Perspectives, 113, 369-374.
http://dx.doi.org/10.1289/ehp.7611
[26] Burger, J. and Greenberg, M. (2006) Ethnic Differences in Ecological Concerns: Spanish-Speaking Hispanics Are More Concerned than Others. Environmental Research, 102, 36-45. http://dx.doi.org/10.1016/j.envres.2005.12.009 [27] Burger, J. (2011) Valuation of Environmental Quality and Eco-Cultural Attributes in Northwestern Idaho: Native
[28] Burger, J., Roush, D.E., Ramon, R. and Gochfeld, M. (2000) Risk Concerns, Land Use, Stewardship, and the Idaho National Engineering and Environmental Laboratory: Attitudes of the Shoshone-Bannock and Other American Indians.
Environmental Research, 83, 298-310. http://dx.doi.org/10.1006/enrs.2000.4055
[29] Burger, J., Sanchez, J., Roush, D. and Gochfeld, M. (2001) Risk Perception, Future Land Use and Stewardship: Com-parison of Attitudes about Hanford Site and Idaho National Engineering and Environmental Laboratory. Journal of Environmental Management, 61, 265-280. http://dx.doi.org/10.1006/jema.2000.0402
[30] Burger, J. (2005) Assessing Environmental Attitudes and Concerns about a Contaminated Site in a Densely Populate Suburban Environment. Environmental Monitoring and Assessment, 101, 147-165.
[31] Myatt-Bell, L.B., Scrimshaw, M.D., Lester, J.N. and Potts, J.S. (2002) Public Perception of Managed Realignment: Brancaster West Marsh, North Norfolk, UK. Marine Policy, 26, 45-57.
[32] Burger, J. (2003) Assessing Perceptions about Ecosystem Health and Restoration Option in Three East Coast Estuaries.
Environmental Monitoring and Assessment, 83, 145-162. http://dx.doi.org/10.1023/A:1022505300319
[33] Burger, J. (2003) Consistency among Methods of Assessing Concerns about the Los Alamos National Laboratory.
Journal of Toxicology and Environmental Health, Part A: Current Issues, 66, 199-210. http://dx.doi.org/10.1080/15287390306404
[34] Pidgeon, N. (2012) Climate Change Risk Perception and Communication: Addressing a Critical Moment? Risk Analy-sis, 32, 951-956. http://dx.doi.org/10.1111/j.1539-6924.2012.01856.x
[35] Carlton, S.J. and Jacobson, S.K. (2013) Climate Change and Coastal Environmental Risk Perceptions in Florida. Jour-nal of Environmental Management, 130, 32-39. http://dx.doi.org/10.1016/j.jenvman.2013.08.038
[36] Ratter, B.M.W., Philipp, K.H.I. and von Storch, H. (2012) Between Hype and Decline: Recent Trends in Public Per-ception of Climate Change. Environmental Science and Policy, 18, 3-8. http://dx.doi.org/10.1016/j.envsci.2011.12.007 [37] Gallup Organization (GO) (2013) Environment. http://gallup.com/poll/1615/environment.aspx
[38] Krosnick, J.A. (2010) The Climate Majority. The New York Times, New York. http://www.nytimes.com/2010/06/09/opinion/09krosnick.html?pagewanted=all
[39] Statistical Analysis Systems (SAS) (2005) Statistical Analysis. SAS, Cary.
[40] Ryan, C.L. and Siebens, J. (2012) Current Population Reports: Educational Attainment in the United States: 2009. U.S. Department of Commerce, U.S. Census Bureau. http://www.census.gov/prod/2012pubs/p20-566.pdf
[41] Hansen, J., Sato, M. and Ruedy, R. (2012) Perception of Climate Change. Proceedings of the National Academy of Sciences of the United States of America, 109, E2415-E2423. http://dx.doi.org/10.1073/pnas.1205276109
[42] Barnegat Bay Beat (BBB) (2012) Special Report: Sandy—A Record-Setting Storm. Barnegat Bay Partnership Quar-terly Publication.
http://bbp.ocean.edu/PDFFiles/BarnegatBay/BBP%20Newsletters%202013/BBP-newsletter1_Apr2013_spring_forWe b%20Final.pdf
[43] Kasperson, R.E. and Kasperson, J.X. (2006) The Social Amplification and Attenuation of Risk. The ANNALS of the American Academy of Political and Social Science, 545, 95-105. http://dx.doi.org/10.1177/0002716296545001010 [44] Johnson, S. (2014) How We Got to Now. Riverhead Books, New York.
[45] Whitmarsh, L. (2011) Skepticism and Uncertainty about Climate Change: Dimensions, Determinants and Change over Time. Global Environmental Change, 21, 690-700. http://dx.doi.org/10.1016/j.gloenvcha.2011.01.016
[46] Brulle, R.J., Carmichael, J. and Jenkins, J.C. (2012) Shifting Public Opinion on Climate Change: An Empirical As-sessment of Factors Influencing Concern over Climate Change in the U.S., 2002-2010. Climatic Change, 114, 169-188. http://dx.doi.org/10.1007/s10584-012-0403-y
[47] Borick, C. and Rabe, B. (2012) Belief in Global Warming on the Rebound: National Survey of American Public Opi-nion on Climate Change. Issues in Governance Studies, 44, 1-8.
[48] Kratovil, C. (2012) Drinking Water Problems Cause Evacuation of Every Dorm in New Brunswick. New Brunswick Today.
http://newbrunswicktoday.com/article/drinking-water-concerns-cause-rutgers-pull-students-out-new-brunswick
[49] Burger, J. and Gochfeld, M. (2014) Perceptions of Personal and Governmental Actions to Improve Responses to Dis-asters such as Superstorm Sandy. Environmental Hazards, 13, 200-210.
http://dx.doi.org/10.1080/17477891.2014.902801
[50] Burger, J. and Gochfeld, M. (2014) Health Concerns and Perceptions of Central and Coastal New Jersey Residents in the 100 Days Following Superstorm Sandy. Science of the Total Environment, 481, 611-618.
http://dx.doi.org/10.1016/j.scitotenv.2014.02.048
Res-ponses to Projected Sea Level Rise. Journal of Environmental Planning and Management, 55, 409-433. http://dx.doi.org/10.1080/09640568.2011.604193
[52] Alexander, K.S., Ryan, A. and Measham, T.G. (2012) Managed Retreat of Coastal Communities: Understanding Res-ponses to Projected Sea Level Rise. Journal of Environmental Planning and Management, 55, 409-433.