http://dx.doi.org/10.4236/jgis.2013.56056
The Application to Evaluate Worship Location Based on
Geospatial Analysis: Case of Indonesia
Cahyo Crysdian
Jurusan Teknik Informatika, Universitas Islam Negeri Maliki Malang, Malang, Indonesia Email: [email protected]
Received July 13, 2013; revised August 13, 2013; accepted August 20,2013
Copyright © 2013 Cahyo Crysdian. This is an open access article distributed under the Creative Commons Attribution License, which permits unrestricted use, distribution, and reproduction in any medium, provided the original work is properly cited.
ABSTRACT
The application of geospatial analysis is a need to respond to the increasing number of social conflicts caused by the existence of public places of worships (PPW) in Indonesia. This conflict eventually becomes endemic among Indone-sian cross-cultural society. Even though the government has produced a regulation-like policy namely SKB 2006 to
manage the establishment of PPW, its contribution to avoiding or reducing the conflicts is in question. Researchers no-tice that the policy is misused in some incidents to even trigger the conflict. It is due to the presence of people participa-tion defined in SKB 2006 particularly to determine the legalization of PPW. Currently there is no exact foundation used
by the government to precisely measure the status of PPW, hence the decision to permit or reject any proposal to estab-lish PPW is determined by the acceptance of surrounding society which in many occasions becomes the cause of the conflict. Therefore the government needs to regain control over the existence of PPW since these types of buildings are public facilities used by people in cross-cultural society. The research is to provide accurate information regarding the existence of PPW and the impact of their presence using geospatial analysis. The objective is to analyze the interaction between PPW and its surrounding objects. The analysis is based on PPW coverage, overlapping and blank spot area. A case study has been conducted to analyze the existence of PPW at Cemorokandang village, a part of Malang city in the province of East Java. The application highlights the issue of overwhelming PPW in the location of analysis.
Keywords: Geospatial Analysis; Spatial Application; Worship Location
1. Introduction
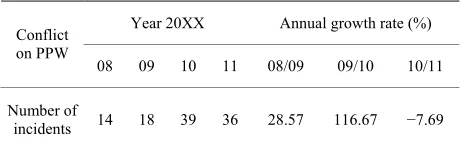
Social conflicts due to the problem for establishing pub-lic places of worships (PPW) such as the mosques and the churches have been causing many incidents in Indo-nesia. Surveys conducted by some independent research group such as Setara Institute [1], Wahid Institute [2], and Center for Religious and Cross-cultural Study [3-6] reveal a phenomenon that the conflicts become endemic among Indonesian society. Statistics obtained from CRCS surveys for the last four years since 2008 to 2011 as depicted in Table 1, show that this conflict is
un-touchable and has even a stable growth from year to year. It seems that the efforts conducted by the government and many local organizations to promote peaceful society that lives in harmony are insignificant to stop or just to reduce this conflict. The authority has actually produced a regulation-like policy to manage the establishment of PPW namely SKB 2006 which stands for Surat Kepu- tusan Bersama 2006/Collaborative Decision Letter 2006
[7]. The policy is the product of collaboration between the Ministry of Interior and the Ministry of Religion, and it has been admitted by all faith communities in Indone-sia to become the only protocol to manage and to settle any dispute regarding the establishment of PPW. Al-though it has been prevailed for a half decade, its impact to reduce or even to stop the conflicts is in question since the number of incidents has increased drastically in the recent years as shown in Table 1. Therefore it is crucial
to develop a new approach to dealing with the existence
Table 1. Number of incidents caused by PPW conflicts.
Year 20XX Annual growth rate (%) Conflict
on PPW
08 09 10 11 08/09 09/10 10/11
Number of
incidents 14 18 39 36 28.57 116.67 −7.69
[image:1.595.308.539.647.722.2]and establishment of PPW in order to deliver an objec-tive perspecobjec-tive on this issue.
As the only policy to govern the establishment of PPW,
SKB 2006 states that the procedure to build PPW is
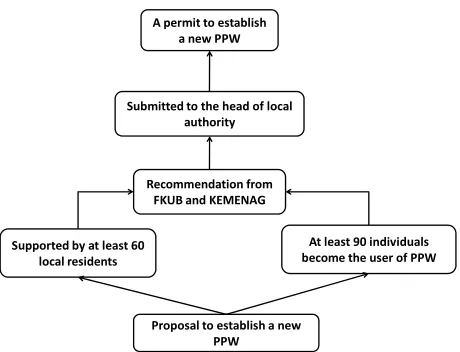
started by fulfilling some prerequisites to obtain legal permit from the authority as depicted in Figure 1. This
procedure states that the effort to build new PPW must be supported by at least 60 local residents and be exhib- ited at least 90 members of a faith group as the user of this facility. This condition is to obtain a letter of recom- mendation from government-based institution which is represented by the district office of the Ministry of Re- ligion (Kantor Kementerian Agama/KEMENAG), and a
recommendation from the community-based organization which is represented by the Forum of Faith Community Members (Forum Kerukunan Umat Beragama/FKUB).
After obtaining letters of recommendation from both
KEMENAG and FKUB, a proposal is then submitted to
the local authority to obtain a permit to establish a new PPW. From this point, the legal status of new PPW has been acknowledged.
Meanwhile according to the survey of CRCS from 2008 to 2011, the causes of PPW conflicts are varied as active PPW was forced to close by a group of local resi-dents, the permit of PPW was withdrawn by local author-ity, the owner of the building where PPW operates changed the function of the building for commercial businesses, and even illegal destruction of PPW facilities was done by some religious fanatics. All of these inci-dents have commonly been assessed by using SKB 2006
regarding their legal aspects and whether the parties in-volved in the conflict had conducted appropriate or inap-propriate action. An example of this practice can be men-tioned as follow. In the incident of PPW at Bogor town which is located about 60 km to the south of Jakarta, a group of local residents launched a demonstration to protest the establishment of a new PPW. They claimed that the permit to establish PPW was not valid since the documents describing the acceptance from at least 60 local residents were fake as admitted by PPW manage-ment in front of legal investigating officer. However, later in the court PPW management stated that they were forced to admit the existence of fake document by local faith group involved in the conflict [6]. Hence, in this case, the truth became unclear and the case has to take a long journey on the court to validate any evident on the legal basis, while the necessity of local residents to wor-ship has to wait until all of this process settled in an un-predictable time. This example shows the difficulty to employ SKB 2006 in practice due to subjective judgment
from each party involved in this conflict. To date, a doz-ens of similar cases have been reported without any clue when thorough solution can be achieved [1,2]. These facts indicate the complexity of employing SKB 2006
At least 90 individuals
become the user of PPW
Proposal to establish a new
PPW Supported by at least 60
local residents
Recommendation from
FKUB and KEMENAG Submitted to the head of local
authority A permit to establish
[image:2.595.309.539.81.257.2]a new PPW
Figure 1. Procedure to legalize PPW based on SKB 2006.
particularly in the point of involving people participation to determine the status of PPW on the legal basis.
Moreover, if the incidents based on PPW conflict are scrutinized, it is apparent that the demand to establish PPW in Indonesia is very high and becomes the obliga-tion of the authority to fulfill it. Since religious life is a sensitive issue among Indonesian cross-cultural society due to the existence of uncontrolled religious fanatics [8], a top-down approach should be employed to avoid sub-jective judgment from local residents to determine the legal status of PPW. This strategy requires the support from spatial data system to achieve accurate decision on establishing PPW among a cross-cultural society. Thus developing correct spatial technology becomes a vital approach towards settling PPW conflict in an objective manner.
2. Related Works
shown by each criterion. They are eventually uncertain on which location PPW need to be established and how to satisfy the need of faith communities.
The only quantitative analysis shown in this field is exhibited by the efforts of Ayhan and Cubukcu [13] and Srirangam and Forsyth [14]. Here Ayhan and Cubukcu study the influence of mosques to the development of surrounding area in Turkey using spatial distribution of mosques and a set of statistical methods. While Sriran-gam and Forsyth study the relationship between Hindu temples and retail activities in Chennai city India. They employ a set of tools namely space syntax, land use and figure-ground study to conduct spatial analysis on the existence of individual temple related to its surrounding. The study delivers a set of typologies exhibiting the in-fluence of each temple to surrounding shopping complex, streets and city landmarks. However since the existence of PPW is in fact not evenly distributed as noted by MSHL [11], it is important to dig up the cause why some area contain more PPW than others and quantitatively measure the effect of this phenomenon. And the fact that PPW is a sensitive issue and has become an area of con-siderable land use conflict [10], hence it is not surprising that the statistics of social conflicts due to PPW in Indo-nesia as documented by CRCS [3-6] is very high. Malay-sia has started to manage this problem by defining and classifying PPW based on the size and their coverage to accommodate worshippers [15], such as Masjid Negara
is a national mosque, Masjid Negeri for state mosques, Masjid Daerah for common public mosques, Masjid Kampung is a mosque resided in every village, and Surau
to accommodate worshippers at a small area such as in organizational offices. Indonesia actually employs a similar PPW classification as Malaysia. Although there is no documentaries or any literatures assigned to classify PPW, it is apparent that Mosque Istiqlal is a national mosque as addressed by some literature [16,17] and there exist of a set of provincial mosques which are called
Masjid Raya that can be regarded as state mosque in
Malaysia. However with the existence of dense popula-tion inside the country particularly in Java island, the number of worshippers far beyond maximum space pro-vided by the organized PPW. This condition triggers the development of many unorganized PPW which in many occasions have been causing social conflicts.
3. System Development
Developing spatial application to analyze the influence of PPW to its surrounding apparently leads to the need of measuring the existence of each PPW as the subject of conflict related to the existence of other spatial objects such as human population, public facilities, and other PPW within a certain area of investigation. Here 3D city model become the correct technology to rely on since it
is capable to present spatial information of a specific object using 3D visualization. Although most efforts on developing 3D city model such as Jutraz et al. [18] and
Pylvanainen et al. [19] utilize the technology to support
only visualization purposes, however in this research the usage of 3D city model is extended to measure the influ-ence of PPW to its surrounding environment using geo-spatial analysis. The purpose of the analysis is to com-pute the interaction between PPW with other objects ex-isted in particular area of investigation. To settle this task, it is important to define to what extend the implementa-tion of 3D city model is desired in order to support geo-spatial analysis in an efficient manner. Therefore it is vital to recognize what data are available and whose par-ties become the user of the implemented system as de-scribed in the following sub-sections.
3.1. Model of Earth Surface
Visualization of earth surface become the foundation to develop 3D city model, therefore the availability of ac-curate data is demanded in the acquisition stage. Here, a set of elevation data obtained from Digital Elevation Model (DEM) is utilized to develop spatial model of earth surface. Since data set from Shuttle Radar Topog-raphic Mission (SRTM) has been recognized as the most accurate DEM available in Internet [20,21], thus it is used as the base to develop 3D model. However this ap-proach is not obstacle free, there are at least two main issues resisting the application of SRTM i.e. elevation
data set contain blank data value and carry low spatial resolution at approximately 90 m for non US region. Al-though the problems of SRTM data set have been ad-dressed by researchers years ago [22,23], however it is worth to briefly describe the approach to counter them. Hence system development can be presented in a com-prehensive manner. The first problem i.e. the existence of
blank data is caused by unsuccessful acquisition of ele-vation data particularly for the area with a steep slope, thus it become the classical problem of SRTM data set. This problem is easy to recognize since the area which contain blank data would carry much higher value i.e.
32,768 than normal elevation data. The highest place on earth namely Mount Everest has elevation only about 8848 meters above sea level. Once the blank data is de-tected, then interpolation is employed to replace it with a predicted elevation value computed from the elevations of its neighboring points.
Second problem i.e. low spatial resolution at
ob-jects is in the range of few meters to maximum 50 meters. Again interpolation is employed to achieve higher reso-lution of elevation data set. Although detail contour of land surface is mostly lost due this approach, however it is still capable of delivering the approximate elevation value of the location of interest besides its main function to determine the exact point where the object sits on earth.
3.2. Model of Road Network
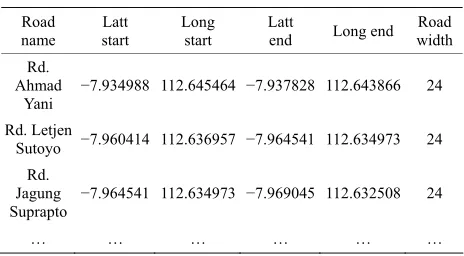
[image:4.595.307.539.98.226.2]Information of road network is important to present the accessibility of PPW to local population living in the visualized region. Data of road network is mainly ob-tained by digitizing satellite photograph. It is worth to note that satellite photograph is the only media found showing a complete network of road in the location being analyzed. Therefore it is utilized to become the only in-put to develop visualization of road network. This deci-sion is considered as a cost-effective approach since sat-ellite photograph is easy to find either from Internet or other data banks such as from local agency of develop-ment planning. To cope with low spatial literacy of the personnel who handle data acquisition, a widely used third party application such as MS Excel can be em-ployed to record the required information as depicted in
Table 2.
Model of road network is then developed by drawing a set of rectangular shapes based on the recorded data in
Table 2, and then lying them on the model of earth
sur-face. Here the edges of each shape representing the road are defined as a 5-tuple (LAS, LOS, LAE, LOE, RW)
which consists of two ordered-pairs i.e. (LAS, LOS) and
(LAE, LOE) that represent geographic coordinate of the
starting and the ending point of a road in latitude and longitude coordinate respectively. Meanwhile a constant
RW denotes a road width. Two simple assumptions are
applied in this approach. First, it is assumed that the width of a road is static, and second it is assumed that a road always creates a straight line from the beginning to the end of the road. Thus to cope with the road that has a bending direction and changing widths, the model is de-veloped by dividing and recording the road into some segments and then the model is built independently for each segment. This approach greatly facilitates the visu-alization of any road condition using a straight line and a static width.
3.3. Model of Building
Actual cities condition in Indonesia consist of many dif-ferent type of buildings such as shopping complex, block offices, hotel, etc. However since the commitment of this project is to analyze the existence of only PPW, hence only PPW buildings are developed to become 3D model.
Table 2. Table to record data of road network.
Road name
Latt start
Long start
Latt
end Long end Road width Rd.
Ahmad Yani
−7.934988 112.645464 −7.937828 112.643866 24
Rd. Letjen
Sutoyo −7.960414 112.636957 −7.964541 112.634973 24 Rd.
Jagung Suprapto
−7.964541 112.634973 −7.969045 112.632508 24
… … … … … …
According to Indonesia Government Regulation No 28 Year 2002 about building construction [24] currently there are six types of PPW building in Indonesia namely
Masjid (Mosque) for Islam, Church for Christian and
Catholic, Pura (Hinduism temple), Vihara (Buddhism
temple), and Litang or Kelenteng (Khonghucu temple).
This setting is accommodated by developing 3D model for each PPW building using polygonal modeling ap-proach. The idea is to visualize the common form of PPW building from each religion using a set of polygons. Therefore it is required to choose common presentation of PPW building from each religion prior to develop 3D model. Detail steps to build 3D model of PPW building are listed as follows:
Identify common form of PPW building from each religion.
List every polygon required to represent each PPW building.
Assemble a set of polygons to become 3D model of PPW building.
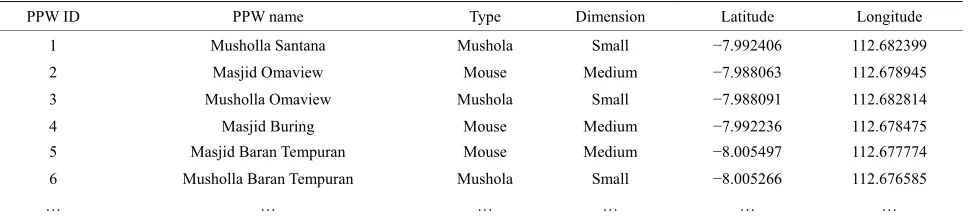
Next step is to locate PPW model on the model of earth surface based on the geographical coordinate of each building. It is necessary to collect data of the loca-tion of each PPW building found in the field, and to put them in a simple structure as shown in Table 3 to
facili-tate 3D model integration.
3.4. Model of Population
Visualization of local population in the area of interest is vital to present the impact of PPW to its surrounding particularly due to the nature of PPW as a public facility for worship activities. Thus it is important to create the model of population to enable the analysis of the interac-tion between PPW and local residents. Common ap-proach to visualize local population usually is accom-plished by developing model of each house such as con-ducted by Burch et al. [25]. This approach however is
Table 3. Table to record data of PPW building.
PPW ID PPW name Type Dimension Latitude Longitude
1 Musholla Santana Mushola Small −7.992406 112.682399 2 Masjid Omaview Mouse Medium −7.988063 112.678945 3 Musholla Omaview Mushola Small −7.988091 112.682814 4 Masjid Buring Mouse Medium −7.992236 112.678475 5 Masjid Baran Tempuran Mouse Medium −8.005497 112.677774 6 Musholla Baran Tempuran Mushola Small −8.005266 112.676585
[image:5.595.308.540.240.300.2]… … … … … …
Table 4. PPW coverage.
housing can be built or removed overnight. Therefore it is important to choose more static data yet adequately represent the distribution of local residents. Rather than recording every house found in the location, it is pre-ferred to record the block of residential housings since these types of data are more static and would not change easily. Furthermore the model of population can easily be implemented using a set of polygons which are drawn on the top of earth surface model.
Size Number of worshippers Radius of coverage
Small <40 100 m
Medium 40 - 100 500 m
Large >100 1000 m
(1) to measure the real coverage of PPW since it requires no overlap among each PPW coverage which is almost impossible to found in reality. The facts even show that the condition of overlapping is spread out and can be found anywhere in the field. Thus it is important to meas-ure the area of overlap between PPW coverage. However it is difficult to compute this area using geometry since there exist various scene of PPW coverage that can be regarded as overlap as shown in Figure 2. In this
re-search set theory is employed to facilitate the formulation of overlap O which is defined as the condition where at
least two PPW coverage occupy the same area based on their geographic coordinate as stated in Equation (2). Here L is a set of geographic coordinate representing the
area of analysis, while cm and cn is the coverage of a
sin-gle m-th and n-th PPW respectively. Hence using a
pre-defined geographic resolution q from the location of
analysis, the area of overlap AO is obtained using
Equa-tion (3).
3.5. Geospatial Analysis
Development of geospatial analysis aims to disclose the influence of PPW to its surrounding and highlight any potential issue causing social conflict. Prior to develop-ing geospatial analysis, the conditions of PPW and its surrounding are visualized in 3D based on the previous developed model. In this stage, the model of earth sur-face become the ground of three other models described in the previous sub section i.e. the reference point where
those models are located in the visualization frame is based on the latitude, longitude, and altitude value of earth surface model. Geospatial analysis is then devel-oped by formulating three basic parameters of PPW as a public facility i.e. the coverage, overlapping and the
blank spot in the area of analysis. The former is defined as the capacity of PPW to accommodate worshippers. Since the fact shows that local residents become major worshippers of PPW, thus definition of coverage be-comes how wide PPW is capable of covering the settle-ment of local residents with respect to the size of PPW and the number of residents living in each residential housing complex that are willing to worship. A field study [26] has been conducted to deliver quantitative measurements on this issue as given in Table 4.
, m n , m , n ,
O i i L i c c c L c L mn (2)
2 11
l
O i
A q
i O (3)Equations (2) and (3) significantly change the compu-tation to derive PPW coverage since there always exist a certain amount of overlapping in every location of analy-sis. Thus by considering the aspect of overlapping, the definition of PPW coverage C become as stated in
Equa-tion (4), while real area of coverage from k number of
PPW is obtained using Equation (5). With the assumption that PPW covers the living area
of worshippers in all direction, the coverage of each PPW has a form of a circle fulfilling the area in which r is the radius of coverage. Thus total area covered
by k number of PPW is derived using Equation (1).
2
πr
1
k
m m
m
C
c c L (4)2 1π
k
C n n
A
r (1) RC 2 l 11i
A q
i C (5)Figure 2. Various scenes of overlapping between PPW cov-erage.
single coverage of PPW can be found in the location of analysis as formulated in Equation (6). Based on the as-sumption that worshippers can live in any part of the location i.e. there is no definition of resident housing, the
area of blank spot AB can simply be obtained by
de-ducting total area of analysis AL by the area of real
PPW coverage as stated in Equation (7). This approach is suitable to analyze the existence of PPW in the location with dense population such as the center of a city, where it is almost impossible to separate residential housing with another land use.
, m, m , 1, ,
B i i L ic c L m k (6)
B L RC
A A A (7)
However if the existence of residential housing can be localized and is considered in the analysis, then the defi-nition of blank spot would slightly change to become as stated in Equation (8). Here the existence of residential housing is represented by a matrix H which consists of a
set of housing block h1, , hq H with hsht in
which st s, 1, , , q t1, , q. Equation (8) high-lights the existence of blank spot only on the area where local residents live in.
, , ,
, 1, ,
m
m
B i i L i H i c H L
c L m k
,
(8)
4. Field Study
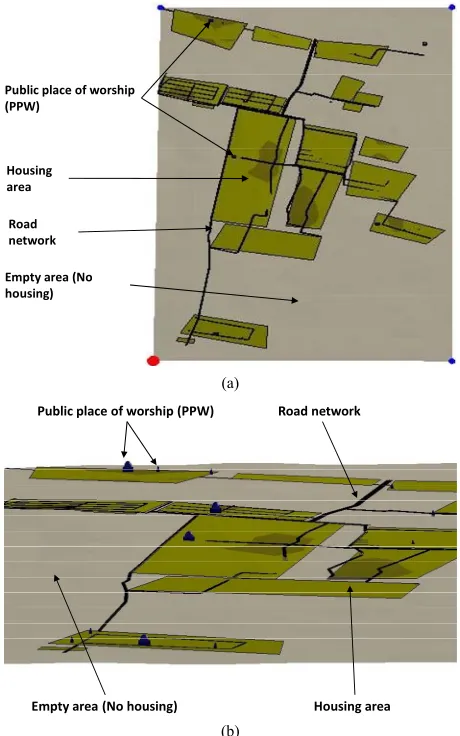
A field study had been conducted to analyze the exis-tence of muslim PPW at Cemorokandang village, an eastern boundary of Malang town at East Java province. This location is preferred to become the study area due to the existence of dense PPW among scattered residential housing block. Currently the village has a total area of approximately about 4 km2 and becomes the host of
about twelve housing blocks, while the number of recog-nized PPW in the entire district is about 18 buildings. It is noteworthy to underline that only muslim PPW can be found in this location, hence the existence of PPW from other religion is not observed. Result of visualizing the spread of housing block as well as the existence of PPW is depicted in Figure 3. Meanwhile result of visualizing
PPW coverage in the study area is shown in Figure 4.
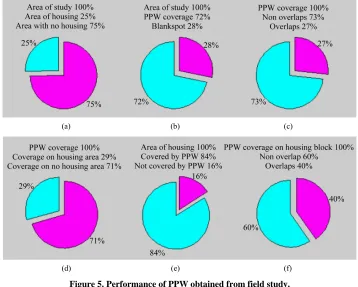
Based on Figure 4, a set of parameters defined in Sub
Section 3.5 are computed and presented in Figure 5.
Housing
area
Empty area (No
housing) Road
network
Public place of worship
(PPW)
(a)
Housing area Empty area (No housing)
Road network Public place of worship (PPW)
(b)
Figure 3. The spread of housing blocks and the existence of PPW in the study area. (a) Top view, (b) View from a cer-tain angle.
Coverage Overlapping
Blankspot
[image:6.595.308.538.84.452.2]PPW Coverage
Figure 4. Visualization of PPW coverage in the study area.
[image:6.595.311.535.505.683.2]which occupies only 25% of total area as shown in Fig-ure 5(a). Meanwhile the coverage of PPW has reached
72% of total area as shown in Figure 5(b), in which 27%
of this coverage overlaps with its other as in Figure 5(c).
However if the coverage is compared against the area of housing, only 29% of PPW coverage is in the housing area while the other 71% covers nothing as shown in
Figure 5(d). Only 84% of housing area is covered by
PPW while the rest 16% of housing become the blank
spot as shown in Figure 5(e). From 84% of the area of
housing which is covered by PPW, 40% of them is cov-ered by more than one PPW as shown in Figure 5(f).
This fact shows excessive number of PPW existed in certain area of residential housing (40%), while on the other hand 16% of housing area is left blank spot.
Further analysis based on the coverage of PPW found in the field are presented in Figures 6(a) and (b)
respec-tively. These figures show the following facts:
(a) (b) (c)
[image:7.595.118.476.206.493.2](d) (e) (f)
Figure 5. Performance of PPW obtained from field study.
[image:7.595.120.475.508.725.2](a) (b)
The area of coverage from all PPW obtained using Equation (1) consists of 59% real coverage delivered by Equation (5) and the rest 41% error as shown in
Figure 6(a). Here the error is composed by the
exis-tence of overlapping among PPW coverage and the existence of coverage which exceeds the boundary of analysis. The last error is due to the placement of PPW that is too close to the edge of the area of analy-sis. Even though the error facilitates neighboring area to have worship facility, however it also shows less contribution of PPW coverage to accommodate wor-shippers in the area where PPW exist.
The majority of PPW coverage is found in the area of no housing (empty area) that reach 51% from total area of study, in which it consists of 40% coverage with no overlaps and 11% with overlaps. This condi-tion is shown in Figure 6(b).
Figure 6(b) also shows that from 25% area of
hous-ing found in the location, only 21% is covered by PPW while the rest 4% is left blank spot.
Based on the above points, it is apparent that the effec-tiveness of PPW coverage to accommodate worshippers in the location of study is relatively low. This condition is proved by the fact that only 59% of real PPW coverage can be established from 100% coverage should be con-structed by all PPW found in the location. It means there exist a total of 41% coverage error. Meanwhile PPW covers empty area with no residential housing as much as 51% from 100% total area of analysis, and on the other hand it left 4% of housing area as blank spot. Thus the existing PPW wastes its coverage to cover nothing rather than removing blank spot contained in residential hous-ing.
The study reveals that overwhelming PPW have been built in the area of study since the ideal coverage i.e. total
area of PPW coverage without considering overlapping is bigger than the whole area of study. However they fail to cover all area of residential housing as shown in Figure 5(e) even though residential housing exist in only the
small part of total area as shown in Figure 5(a). This
phenomenon shows that the establishment of PPW wastes a lot of resources. This phenomenon shows many PPW were built without any awareness that the devel-oped PPW may cover nothing. This fact discloses low concern on developing proper PPW coverage i.e. whether
the coverage really reduces the blank spot on the housing area and minimizes the possibility of overlapping among PPW.
5. Conclusion
Objective perspective can be delivered by geospatial analysis to evaluate the existence of PPW as public facil-ity. The analysis enables the measurement of PPW cov-erage to accommodate worship activities. Moreover it
can be utilized to compute the influence of PPW to other objects existing in the area of study such as a set of resi-dential housings and other neighbouring PPW. The ob-jective of the research is to compute three basic parame-ters derived from the presence of PPW namely the cov-erage of PPW, overlapping between PPW covcov-erage, and the existence of blank spot area. Computation on these parameters is conducted on three different domains i.e.
on the whole area of study, on the housing area, and on the area of PPW coverage. Result of analysis quantita-tively discloses the performance of PPW to become the facility to worship in terms of its coverage. The analysis leads to present the real condition of PPW, for example, whether a group of PPW on a particular area is properly developed, suffering from lack of planning or still re-quiring more building to extend their coverage. It is worth to note that the use of cost-efficient 3D city model greatly facilitates the implementation of the system since it saves the need of resources and simplifies the procedure to develop 3D model. Rather than developing a complex 3D city model that consists of complicated objects, cost-effi- cient approach simplifies the content of 3D city model by summarizing the objects of city environment into a sim-ple model such as individual building house replaced by the model of housing block. Therefore it successfully reduces resources to be deployed in the implementation stage and requires only simple procedure yet it is enough to conduct geospatial analysis.
REFERENCES
[1] SETARA, “Report on Freedom of Religion and Belief in 2012,” 2012. http://www.setara-institute.org
[2] WAHID, “Laporan Akhir Tahun Kebebasan Beragama dan Intoleransi,” 2012. http://www.wahidinstitute.org [3] CRCS, “Laporan Tahunan Kehidupan Keagamaan
Ta-hun,” 2008. http://crcs.ugm.ac.id
[4] CRCS, “Annual Report on Religious Life in Indonesia,” 2009. http://crcs.ugm.ac.id
[5] CRCS, “Laporan Tahunan Kehidupan Keagamaan Ta- hun,” 2010. http://crcs.ugm.ac.id
[6] CRCS, “Laporan Tahunan Kehidupan Keagamaan Ta- hun,” 2011. http://crcs.ugm.ac.id
[7] SKB, “Pedoman Pelaksanaan Tugas Kepala Daerah/ Wakil Kepala Daerah Dalam Pemeliharaan Kerukunan Umat Beragama, Pemberdayaan Forum Kerukunan Umat Beragama, Dan Pendirian Rumah Ibadat,” Peraturan Ber-sama Menteri Agama Dan Menteri Dalam Negeri Nomor 9 Tahun 2006 dan Nomor 8 Tahun 2006.
[8] SETARA, “The Faces of Islam ‘Defenders’,” Pustaka Masyarakat Setara, 2010.
[9] M. M. Pickthall, “The Meaning of the Glorious Qur’an,” Islamic Book Trust, Kuala Lumpur, 2001.
munities,” PhD Thesis, University of Waterloo, 2006. [11] MSHL, “Places of Worship Policy Review,” Prepared for
the City of Brampton for Discussion Purposes, 2008. [12] Oakville, “Town of Oakville: Places of Worship Land
Use Study,” Town of Oakville Planning Services De- partment, 2011.
[13] I. Ayhan and K. M. Cubukcu, “Explaining Historical Urban Development Using the Locations of Mosques: A GIS/Spatial Statistics-Based Approach,” Applied Geog- raphy, Vol. 30, No. 2, 2010, pp. 229-238.
[14] S. Srirangam and W. Forsyth, “Culture and Commerce of Chennay City—A Spatial Analysis of the Relationship between Temples and Retail Activity,” Proceedings of
8th International Space Syntax Symposium, Santiago de
Chile: PUC, 2012.
[15] Malaysia, “Garis Panduan Perancangan Tempat Ibadat Islam. Jabatan Perancangan Bandar dan Desa Semenan- jung Malaysia,” Kementerian Perumahan dan Kerajaan Tempatan Malaysia, 2002.
[16] I. Hasan, “Architecture and the Politics of Identity in Indonesia: A Study of the Cultural History of Aceh,” PhD Thesis, University of Adelaide, 2009.
[17] B. A. Sukada, “The Architecture of Early Independence. Indonesian Heritage: Architecture,” Archipelago Press, Singapore, 1996.
[18] A. Jutraz, A. Voigt and T. Zupanci, “3D City Model as Understandable Design Interfaces for lay Public,” Journal of Society for Development of Teaching and Business Processes in New Net Environment in B&H, Vol. 6, No. 4,
2011, p. 890.
[19] T. Pylvanainen, J. Berclaz, T. Korah, V. Hedau, M. Aan- janeya and R. Grzeszczuk, “3D City Modeling from Street Level Data for Augmented Reality Applications,”
Proceedings of 2012 Second Joint 3DIM/3DPVT Con- ference: 3D Imaging, Modeling, Processing, Visualiza- tion and Transmission, 2012.
[20] C. Huggel, D. Schneider, P. J. Miranda, H. D. Granados and A. Kaab, “Evaluation of ASTER and SRTM DEM Data for Lahar Modeling: A Case Study on Lahars from Popocatepetl Volcano, Mexico,” Journal of Volcanology and Geothermal Research, Vol. 170, No. 1-2, 2008, pp.
99-110.
http://dx.doi.org/10.1016/j.jvolgeores.2007.09.005 [21] E. Suwandana, K. Kawamura, Y. Sakuno, E. Kustiyanto
and B. Raharjo, “Evaluation of ASTER GDEM2 in Com- parison with GDEM1, SRTM DEM and Topographic Map Derived DEM Using Inundation Area Analysis and RTK-dGPS Data,” Journal of Remote Sensing, Vol. 4, No.
8, 2012, pp. 2419-2431.
http://dx.doi.org/10.3390/rs4082419
[22] C. Crysdian, “3D Visualization of Small Scale Spatial Object Based on Digital Elevation Model,” Proceedings of 2nd International Conference on Distributed Frame-works and Application, Yogyakarta, 2010.
[23] T. G. Farr, P. A. Rosen, E. Caro, R. Crippen, R. Duren, S. Hensley, M. Kobrick, M. Paller, et al., “The Shuttle Ra-
dar Topography Mission,” Reviews of Geophysics, Vol. 45, No. 2, 2007.
[24] Indonesia, “Undang-Undang Republik Indonesia Nomor 28 Tahun 2002 Tentang Bangunan Gedung,” Lembaran Negara Republik Indonesia Tahun 2002 Nomor 134. [25] S. Burch, A. Shaw, S. Sheppard and D. Flanders, “Cli-
mate Change Visualization: Using 3D Imagery of Local Places to Build Capacity and Inform Policy,” State of Climate Visualization, CSPR Report, Vol. 4, 2009, pp. 65-73.