http://dx.doi.org/10.4236/ojpm.2016.64013
How to cite this paper: Hamidreza, L., Hossein, K., Motlagh, M.E. and Aminda, A. (2016) The Prevalence of Obesity and Overweight in Children Aged 6 in Iran. Open Journal of Preventive Medicine, 6, 143-147.
http://dx.doi.org/10.4236/ojpm.2016.64013
The Prevalence of Obesity and Overweight
in Children Aged 6 in Iran
Lornezhad Hamidreza1, Kazemeini Hossein2*, Mohammad Esmaeil Motlagh1, Amanollahi Aminda2
1Family and Population Health Office, Ministry of Health and Medical Education, Tehran, Iran 2PHC Center, Ministry of Health and Medical Education, Tehran, Iran
Received 16 February 2016; accepted 25 April 2016; published 28 April 2016
Copyright © 2016 by authors and Scientific Research Publishing Inc.
This work is licensed under the Creative Commons Attribution International License (CC BY).
http://creativecommons.org/licenses/by/4.0/
Abstract
Obesity is one of the most prominent problems imminent among all societies particularly in de-veloping countries. WHO reported in the latest report that obesity was among the 5 causes of death in the world. In 2010, about 43 million under 5 years children were found to be overweight. At present about 35 million kids suffering from obesity live in developing countries and about 7 million overweight kids live in developed countries. Studies in Iran show that the prevalence of obesity is between 7 - 16 percent. According to this study, from 514,963 examined children (261,633 male and 253,330 female), 2.6 percent of children had severe obesity, 60 percent and 40 percent in males and females respectively. This study showed that 3.6 percent were obese, 57.5 and 42.5 in males and females respectively. Also overweight was 8.4 percent, 49.3 and 50.7 per-cent in males and females respectively. Overweight was found to be more common among female participants with 50.7 percent as opposed to 49.3 percent for males. However, obesity and severe obesity were found to be more common among males. Life style change is the best way to prevent obesity and also is the best way to control and treat it by increased activity and low food consump-tion. Because of the importance of nutrition in childhood growth and development and also the effect of childhood malnutrition on adult health, special notice to this issue is necessary.
Keywords
Prevalence, Obesity, 6 Years Old, Iran
1. Introduction
tries. Although this problem is observed in developing countries, it is more serious in industrialized urban dwel-lings.
In 2013 the prevalence of obesity in under 5-year-old children was estimated to be 42 million, among which 31 million were located in developing countries [1]. Additionally, WHO reported in the latest report that obesity is among the 5 causes of death in the world. According to the WHO report, at least 2.8 million deaths occur in adults due to obesity and overweight [1]. Furthermore, 44 percent of diabetes incidents, 23 percent of cardi-ovascular incidents and 7 - 41 percent of cancer incidents are related to obesity and overweight [2]. Additional-ly, in 2008 about 8 billion and 500 million adults suffered from being overweight. In 2010, about 43 million un-der 5 years children were found to be overweight [3]. WHO declared in the past that obesity and overweight were the main problems found in developed countries. This remains to be the case; at present about 35 million kids suffering from obesity live in developing countries and about 7 million overweight kids live in developed countries [4].
In the African continent, stunt is found to be more common than obesity, whereas in developed countries such as USA, about 60 - 70 percent of people are obese or overweight [5]. In our country, the prevalence of obesity is found to be the same, however, obesity is 10 percent lower than that found in developed countries. About one third of our population, that is 25 million people, are obese or overweight in which 43 percent are men and 57 percent are female. Other studies in Iran show that the prevalence of obesity is between 7 - 16 percent. The pre-valence of obesity in populations above the age of 18 was estimated as 21.7% (CI 95%: 18.5% - 25%) and in populations below 18 as 6.1% (CI 95%: 6.8% - 5.4%) [6].
In Maddah et al. study in Zahedan province, the prevalence of overweight and obesity was 8.9 and 10.3 per-cent respectively [7]. In Akbari et al. study, the overall prevalence of obesity was 15 percent [8].
The prevalence of obesity in primary school students of Charmahal province in 2002 was reported to be 9.9 percent [9]. Another study demonstrates that the prevalence of obesity in students of ages 6.5 - 11.5 years in Shiraz (southwest Iran) was 6.1 and 3.3 percent in female and male samples respectively [10]. From 25 million people in Iran who have obesity or overweight, 17 million are considered obese while 8 million are classified as overweight. The prevalence of obesity in cities, however, is significantly different with obesity in Tehran having 60 percent men and 70 percent in women. The prevalence of obesity varies from 3 to 23 percent in various provinces [11].
In Iran’s Northern provinces, the prevalence of obesity was found tone 23 percent, whereas southern provinc-es, such as Sistan Balochestan province, were reported at 3 percent [12].
In the previous 10 years, prevalence of obesity in Tehranian kids, was reported to be 10 percent [12].
Consideration of obesity as a specified disease has grown with an increasing rise in obesity in Iran and in the world. In average, about 6 - 8 hours daily are wasted from children for homework, digital games and TV. This issue is one of the reasons which can be considered directly responsible for obesity in children.
Obesity is caused by varying factors such as genetic and environmental factors. Environmental factors such as low activity and high calorie intake are important contributors in the development of obesity, but without suita-ble environmental factors, genetic factors are not effective in producing obesity alone.
Obesity-induced mortality is 2.5 to 3 percent more than the general population. Till the end of the Second World War, the majority of deaths were due to stunt and the lack of technology and food. Following the war, redevelopment of affected countries through industrialization resulted in food production increases and accessi-bility, as well as a lack of activity, and inadvertently resulted in the increase in obesity.
Communicable diseases controlled via vaccination and health development caused an increase in people’s ages and this caused lack of activity and consequently obesity.
Body Mass Index (BMI) is an indicator for determining overweight and obesity. In this method, if the weight of person is divided by height 2, a normal range would be considered to fall to a value less than 25, while the range from 25 to 30 is considered overweight. This is followed by ranges beyond this range indicating the 1st, 2nd and severe obesity respectively from the following ranges: 30 to 35, 35 to 40 and above 40. The estimation of obesity-induced mortality is not easy because the majority of obesity deaths are due to its disorders such as cardiovascular diseases and diabetes.
2. Methodology
re-lated to adolescence and school service package.
The height of children were measured using a calibrated cm in upright position without shoes and with an ac-curacy of 0.1 centimeter and their weight were measured by digital weighting without shoes and add clothing with 0.1 kg accuracy. Both height and weight were measured by trained persons.
Then each child’s BMI were considered. Body Mass Index (BMI) is a number calculated from a child’s weight and height. BMI is a reliable indicator of body fatness for most children and teens. Although there are many criteria to evaluate body mass index in children and adolescents but in this study the two standards “WHO” (World health organization) and “CDC” (Center of disease control) were used.
After BMI is calculated for children and teens, the BMI number is plotted on the CDC BMI-for-age growth charts (for either girls or boys) to obtain a percentile ranking. Percentiles are the most commonly used indicator to assess the size and growth patterns of individual children in the United States. The percentile indicates the relative position of the child’s BMI number among children of the same sex and age. The growth charts show the weight status categories used with children and teens (underweight, healthy weight, overweight, and ob-ese).Also WHO indicates that a BMI less than 18 is underweight, a BMI between 18 and 25 is normal weight, a BMI greater than or equal to 25 is overweight and a BMI greater than or equal to 30 is obesity.
In this study, 514,963 people took data entry and analysis was performed with SPSS software.
3 Results
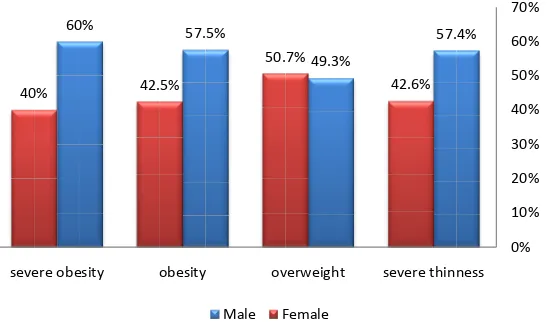
According to this study, from 514,963 examined children (261,633 male and 253,330 female) 2.6 percent (13,442) of children had severe obesity (Figure 1), 60 percent (8066) and 40 percent (5376) in males and fe-males respectively (Figure 2). Additionally, 2.6 percent (13,379) had severe thinness, 57.4 (7673) and 42.6 per-cent (5706) in males and females respectively. This study showed that 3.6 per per-cent (18,300) were obese, 57.5 (10,527) and 42.5 (7773) in males and females respectively. Also overweight was 8.4 percent (43,273), 49.3 (21,326) and 50.7 (21,947) per cent in males and females respectively (Figure 1).
From 514,963 children, 1835 were diabetic, 2334 had convulsion, 5379 had cardiovascular diseases, 11,572 were as thematic, 31,305 had allergy, 744 were hemophilic and 53,000 had thalassemia.
4 Discussions
[image:3.595.179.452.542.706.2]In this study, the prevalence of overweight, obesity and severe obesity in 6-year-old children was 8.4, 3.6 and 2.6 percent respectively. Overweight was found to be more common among female participants with 50.7 per-cent as opposed to 49.3 perper-cent for males. However, obesity and severe obesity were found to be more common among males. This amount is less in the previous studies in female students with 8.6 and 16.5 for obesity and overweight respectively [12]. Also in Hajian et al. study in 2006, the prevalence of overweight and obesity was 5.8 and 12.3 respectively. In a 2004 study in primary school students in Turkey, the prevalence of overweight and obesity was 1.6 and 10.6 respectively [13]. Also in a study in Panjab state India in primary school students in 2005, the prevalence of overweight was 10 percent [14].
Figure 1. Weight conditions of 6 years old children in Iran.
2.6% 8.4%
3.6% 2.6%
0% 1% 2% 3% 4% 5% 6% 7% 8% 9%
severe thinness overweight
obesity severe obesity
Figure 2. Distribution of children gender percent according to the weight condition.
In a 2006 study involving children in China, the prevalence of overweight and obesity was 14.1 and 7.5 re-spectively [15]. In Vietnam in 2015, in preschool children the prevalence of overweight and obesity was 21 and 7.6 percent in urban and rural areas respectively. According to these results it seems that the prevalence of overweight and obesity is higher in other studies [16].
In contrast, our study demonstrates that the prevalence of overweight and obesity in male and female with lit-tle difference is significantly high. One of the reasons for this is lack of activity due to digital games. One of the important findings in our study is the higher prevalence of obesity and severe obesity in male students. Further studies for the reasons for this can be discovered in future studies. The prevalence of thinness and severe thin-ness in our study was 7.4 and 2.6 respectively, which was found to be higher in males in relation to females.
Studies demonstrate that today, overweight and obesity are more fatal than under weight and thinness. As may be known, the main reason of overweight and obesity is the lack of balance between the input and output of energy and calories. We can confront with it in two levels: personal and social. In personal level, limitation of fat consumption and decrease calories intake, safe food regimes and increase body activity are known strategies. In social level, policies for safe food regimes, cooperation of food industries with health organization and safe food regimes are fundamental.
The reason of overweight and obesity is the lack of balance in food regimes. We can control this balance re-gardless of social status or income levels. If we encourage people to omit processed foods from their regime, we can decrease a large amount of obesity as well as overweight risk factors. Then it is necessary to change people’s attitude about their eating habits and their needs and encourage them to buy and consume safe foods with any income.
Life style change is the best way to prevent obesity and also is the best way to control and treat it by increased activity and low food consumption. An important point in childhood obesity is that it can facilitate obesity and its disorders later in life. Governmental efforts to reduce the amount of foods calories such as fast foods and also increase general education about obesity issues can be very instrumental in decreasing obesity and its associated problems.
The overall prevalence of overweight was 4.7%. Both parental overweight and low parental education were significantly higher among overweight than normal-weight children. The total energy intake was significantly higher in overweight than in normal-weight children at 12 - 35 months of age. Compared with normal-weight children, significantly fewer overweight children were breast-fed for at least 4 months. Overweight children were also more likely to have been introduced to infant formula and semi-solid foods during the first 4 months
[15].
Because of the importance of nutrition in childhood growth and development and also the effect of childhood malnutrition on adult health, special notice to this issue is necessary. With this regard, we should consider two issues. First is the role of lack of food in child thinness which cooperative and supportive organizations can help, and the other is mal-nutrition in children due to bad nutritional habits. The role of education in this regards is very important in schools and mass media.
57.4% 49.3%
57.5% 60%
42.6% 50.7%
42.5% 40%
0% 10% 20% 30% 40% 50% 60% 70%
severe thinness overweight
obesity severe obesity
References
[1] (2013) WHO: Obesity and Overweight. Access Date: 3 November 2013.
http://www.who.int/mediacentre/factsheets/fs311/es/
[2] (2015) Ten Facts on Obesity. WHO Fact Sheet Number 311, Updated January 2015.
http://www.who.int/features/factfiles/obesity/en/
[3] Harvard School of Public Heath and World Health Organization (2011) Obesity and Overweight, Fact Sheet Number 311, Accessed January 2012. http://www.who.int/mediacentre/ factsheets/fs311/en/
[4] Onis, M., Blossner, M. and Borghi, E. (2010) Global Prevalence and Trends of Overweight and Obesity among Pre-school Children. The American Journal of Clinical Nutrition, 92, 1257-1264.
http://dx.doi.org/10.3945/ajcn.2010.29786
[5] Martorell, R., Khan, L.K., Hughes, M.L. and Grummer-Strawn, L.M. (2000) Obesity in Women in Developing Coun-tries. European Journal of Clinical Nutrition, 54, 247-252. http://dx.doi.org/10.1038/sj.ejcn.1600931
[6] Rahmani, A., Sayehmiri, K., Asadollahi, K. and Sarokhani, D. (2015) Investigation of the Prevalence of Obesity in Iran: A Systematic Review and Meta-Analysis Study, 53, 596-607.
[7] Maddah, M., Shahraki, T. and Shahraki, M. (2010) Underweight and Overweight among Children in Zahedan, South- East Iran. Public Health Nutrition, 13, 1519-1521. http://dx.doi.org/10.1017/S1368980010000388
[8] Akbari, N., Foruzandeh, N., Delaram, M. and Rahimi, M. (2006) Parent’s Perception of Obesity Their 6-12 Years Old Inobese Child Can Parental Education Be Effective. Iranian Journal of Endocrinology and Metabolism, 8, 241-248. (Persian)
[9] Shahgholian, N., Aein, F. and Deris, F. (2003) The 90th Percentile of Body Mass Index (British Medical Journal) and Some Obesity Risk Factors among 7-12 Years Old School Children. Journal of Sharekord University of Medical Sciences, 5, 42-48. (Persian)
[10] Ayatollahi, M. and Mostajabi, F. (2007) Prevalence of Obesity among School Children in Iran. Obesity Review, 8, 289- 291. http://dx.doi.org/10.1111/j.1467-789X.2006.00299.x
[11] Azizi, F., Rahmani, M., Emami, H. and Madjid, M. (2000) Tehran Lipid and Glucose Study Rationale and Design CVD Prevention. Tehran University Medical Journal, 3, 242-247.
[12] Amanolahi, A., Sohrabi, M.R., Montazeri, A. and Abadi, A.R. (2012) Study of Obesity Levels among School Students.
Payesh Journal, 11, 89-95.
[13] Krassas, G.E., Tsametis, C. and Baleki, V. (2004) Prevalence of Overweight and Obesity among Children and Adoles-centsin Thessaloniki-Greece and Kayseri-Turkey. Pediatric Endocrinology Review, 1, 460-464.
[14] Sidhu, S. and Marwah, G. (2005) Prevalence of Overweight and Obesity among the Affluent Adolescent School Children of Amritsar, Punjab. College of Anthropology, 29, 53-55.
[15] Jiang, J.X., Rosenqvist, U., Wang, H.S., Koletzko, B., Lian, G.L., Huang, J. and Greiner, T. (2009) Risk Factors for Overweight in 2- to 6-Year-Old Children in Beijing. Public Health Nutrition, 12, 973-978.
http://dx.doi.org/10.1017/S1368980008003509