© 2016, IRJET | Impact Factor value: 4.45 | ISO 9001:2008 Certified Journal
| Page 29
Mathematical Modeling of buildings towards the design strategy of the
Green buildings with MATLAB
B.Vikram Anand
1, Asit Kumar Mohanty
2, Soumya Ranjan Mishra
3, Nara Narayan Das
4Satya Gopal Mishra
5Subham Sial
61
Assistnat Professor, Department of Electrical Engineering, GIET, Gunupur, Orissa, INDIA
3,4,5,6
Final Year UG student, Dept. of Electrical Engineering, GIET, Gunupur, Orissa, INDIA
---***---Abstract -
Maintaining of the indoor climate conditions sothat they keep compatible with the occupants comfort is a key issue for control of heating, ventilation along with air conditioning systems (HVAC systems). Computer modelling offer a virtual environment similar to real climatic conditions indoors and outdoors. It aims basically to devise solutions for control of indoor climatic conditions. This process requires understanding of these environments from physical and mathematical perspective, so that physical processes of these environments can be represented using relationships and equations which can reflect the influence of different environmental parameters. Here different physical models associated in the construction of building are modelled and a new control strategy is developed to limit the effect of temperature rise using MATLAB/SIMULINK and the output results are shown which results in better performance.
Key Words: HVAC system, mathematical modeling, temperature, control.
1. INTRODUCTION
It is must to have a better knowledge about the heat, air and moisture balance of the whole building and how the indoor environment is affected due to it. And it in turn impacts the thermal comfort of the occupants which invariably reduces pollution and energy consumption. There is no such tool or computer application in existence which covers these issues. Hence, integrated mathematical models which cover every aspects of building design are required. Modeling is defined as obtaining the mathematical equations which shows the dynamic response of the physical processes. It is basically derived from the known laws. The physical system, once its modeling is completed [1]; it can be simulated by a particular software tool. It just takes few seconds to simulate the process, as compared to the real system as it takes hours. It helps in saving a great deal of money and we can correct the errors before the real system is implemented. For predicting the energy being consumed and what are the indoor climate parameters, some popular methods can be used[2][3]. The results which are obtained from these methods are used to design the buildings, which meets every aspect of the energy consumption and indoor
climate. The principles of energy simulation are to determine the energy flow across the building. Energy flow is found out in terms of heat loss through the building envelopes with also the ventilation system and infiltration. It is quite evident that the actual indoor temperature is the representation of complex interaction between losses and gains. The variables used vary continuously as outdoor temperature, solar heat gain and internal heat gain, vary with time [4].
All the parameters which directly or indirectly affect the energy balance must be included in the model. This in term says that every wall, windows, ventilation system and all the components sub-model must be designed. With so many sub-models being designed come so many factors, which further increase the complexity of the whole model. And with many factors, a detailed result will be obtained. But we may have problems in running it. Accuracy and complexity must be balanced in such way that, we get higher accuracy with less complexity.
The mathematical model is again run in various simulation processes. After the initial implementation of the model, validation of the model is important as to check whether the results obtained are near to real parameters. There is a big advantage of simulation, as we can vary the parameters and can further improve the design of the building [5]. There is only one software that has advanced capabilities for simulation of indoor thermal process, and it is MATLAB.SIMULINK is a software package which is basically used for modeling, simulating and analyzing dynamical systems. Using ordinary differential equations, the indoor environment modeling can be implemented in SIMULINK.
© 2016, IRJET | Impact Factor value: 4.45 | ISO 9001:2008 Certified Journal
| Page 30
Figure 1: External walls
2. MATHEMATICAL MODEL FOR EXTERNAL WALLS
The method used to model the interactions between the instantaneous loads and system models is the method of heat equilibrium, where, it requires solving a set of equations for heat transfer and temperature of the indoor air in order to determine the loads indoors[6]. Where, the indoor temperature can be calculated based on the indoor environmental conditions, such as internal loads, the interactions between the surfaces, infiltration, ventilation, and air handling system. And then, the concept of energy balance is used to for determining the temperature inside at which the indoor space become balanced with the heating or cooling provided by the system, so that can maintain indoor climate conditions comfortable for occupants. Here four different layers are considered to design the model of external walls and temperatures of all four layers is expressed by T1, T2, T3 and T4 which is as shown in figure 2.
Figure 2 Different layers of external walls
Solar radiation plays an important role for the heat transfer through the external walls. The conduction heat transfer through an external wall is given by equation (1) and it is the effect of the convective heat that the surface at each side of
the element is exchanging with the surrounding air. The heat transfer through the building envelopes can be done by taking the mathematical representations of the individual layers and there by investigating the temperatures
Temperature of the wood layer can be calculated from the following equation,
Where,
( ) is the Temperature of wood layer (1st layer inside)
( ) is the Heat transfer co-efficient inside
(m) is the thickness of wood layer (1st layer inside)
( ) is the thermal conductivity of wood layer (1st
layer inside)
is the area of wood layer (1st layer inside)
is the indoor temperature
is thermal conductivity of 1st concrete layer
(2nd layer inside)
is the thickness of the 1st concrete layer (2nd layer
inside)
is the area of the 1st concrete layer (2nd layer inside)
is the temperature of the 1st concrete layer (2nd layer
inside)
is the density of wood layer (1st layer inside)
is the specific heat capacity of wood layer (1st
layer inside)
[image:2.595.39.277.550.686.2]© 2016, IRJET | Impact Factor value: 4.45 | ISO 9001:2008 Certified Journal
| Page 31
Figure 3: Model for the wood layer
Temperature of the first concrete layer is obtained from the following,
= /
Where,
is the thermal conductivity of the brick layer (3rd layer inside)
is the area of the brick layer (3rd layer inside)
is the temperature of the brick layer (3rd layer inside)
is the density of first concrete layer (2nd layer
inside)
is the specific heat capacity of first concrete layer (2nd layer inside)
is the volume of the first concrete layer (2nd layer
[image:3.595.310.561.552.607.2]inside)
Figure 4: Model for the first concrete layer
The following equation gives us the temperature of the brick layer,
= /
…(3)
Where,
is the thermal conductivity of the second concrete layer (4th layer)
is the area of second concrete layer (4th layer)
is the temperature of the second concrete layer (4th
layer)
is the density of brick layer (3rd layer inside)
is the specific heat capacity of brick layer (3rd
layer inside)
is the volume of brick layer (3rd layer inside)
Figure 5: Model for the brick layer
By the equation given below, temperature of the second concrete layer is calculated,
Where,
is the area of outside surface
is the heat transfer co-efficient outside
is the solar air temp for external walls
is the density of second concrete layer (4th layer)
[image:3.595.39.292.596.713.2]© 2016, IRJET | Impact Factor value: 4.45 | ISO 9001:2008 Certified Journal
| Page 32
is the volume of the second concrete layer (4th layer)0.37 volume of conc layer4
920 specific heat of conc layer4
25 heat transfer coefficient outside
2300 density of conc layer 4
1 const5 2 const4 1 const3 14.65 area of layer outside 25
Thickness of conc4 450 Thickness of brick3
1.7 Thermal conductivity of conc layer4
0.8 Thermal conductivity of brick2
35 Temp out
[tempofconc_layer4] Temp of conc layer 4 Scope4 Product33 Product32 Product31 Product30 Product29 Product28 Product27 1 s Integrator3 [Tempofbrick_layer3] From6 Divide18 Divide17 Divide16 Divide15 Divide14 2 Constant5 14.65 Area of conc layer4
Add21
Add20
Add19 Add18
Add17
Figure 6: Model for the second concrete layer
After individually designing each layer, the all four layers are linked together and the designed parameters are shown below
Volume of indoor space – 910
Every wall of the room is covered with wood.
Area of wood covered part – 28.63
Area of concrete part – 14.65
External wall from inside to outside direction Thickness [mm] Thermal conductivity [ ] Specific heat capacity [ ] Density [ ] Wood Layer
5 0.17 2000 700
Concrete layer
25 1.7 920 2300
Brick layer
450 0.8 800 1700
Concrete layer
[image:4.595.41.270.125.232.2]25 1.7 920 2300
Table 1. Dimensions and properties of materials of all layers in external wall
3. MATHEMATICAL MODEL FOR WINDOWS FRAME
Every window in each wall has a steel frame[7].
Area of glass – 9.64
Area of frame – 4.35
Window frame Thermal conductivity in [ ] Specific heat capacity in
[ ]
Density in
[ ]
[image:4.595.302.565.126.201.2]Steel 16 490 7820
Table 2. Properties of window frame
Therefore temperature of the windows frame is calculated from the given equation,
..(5)
0.37 volume of window
490 specific heat of window
25 heat transfer coefficient outside2 5
heat transfer coefficient inside2
7820 density of window
1 const17 2 const16 1 const15 1 const14 2 const13 1 const12 4.35
[image:4.595.31.299.414.658.2]area of window
[Temp_ext]
Total heat transfer through window frame 450
Thickness of window 16
Thermal conduct of window
[Temp_window_frame]
Temp of window frame
0.1
Solar temp windows
Scope8 Scope7 Product49 Product48 Product47 Product46 Product45 Product44 Product43 1 s Integrator5 [new_indoor] From10 Divide38 Divide37 Divide36 Divide35 Divide34 Divide33 Divide32 Divide31 Divide30 Divide29 1 Const8 2 Const7 1 Const6 Add37 Add36 Add35 Add34 Add33 Add32 Add31
Figure7: Model for the window frame
4. MATHEMATICAL MODEL FOR WINDOWS
A part of solar radiation is incident on the glass pane. It increases the temperature of the glass pane, and heat flows in both inside and outside direction.
Heat transferred through the window is expressed as follows, 13.99 Windows area 0.1 Tso windos1 4.11 Solar radiation 1 SC Product42 Product41 [heat_transfer_windows]
HEAT TRANSFER THRO WINDOWS [solar_air_temp] From9 [new_indoor] From8 Add30 Add29
© 2016, IRJET | Impact Factor value: 4.45 | ISO 9001:2008 Certified Journal
| Page 33
5. MATHEMATICAL MODEL FOR ROOF
The following equation gives the temperature of the roof,
3.48 volume of layer
920 specific heat of layer
25 heat transfer coefficient outside1 5
heat transfer coefficient inside1
2300 density of layer
1 const9 1 const8
2 const7 1 const6
1 const11
[image:5.595.308.532.107.231.2] [image:5.595.313.515.358.461.2]2 const10 -C-area of layer
[heat_roof] Total heat loss through roof 150
Thickness of layer 1.7 Thermal conduct of layer
35 Temp out1
[Temp_roof] Temp of roof
Scope6 Scope5
Product40
Product39 Product38
Product37
Product36
Product35
Product34
1 s Integrator4 [new_indoor]
From7
Divide28 Divide27 Divide26 Divide25
Divide24
Divide23 Divide22 Divide21
Divide20 Divide19
1 Const5
2 Const4
1 Const3
Add28 Add27 Add26 Add25
Add24 Add23
Add22
Figure9: Model for the roof
6. MATHEMATICAL MODEL FOR VENTILATION
Ventilation heat loss/gain in calculated from the following,
Where:
[W]: heat loss/gain due to ventilation.
N [1/h]: air change rate = (air change rate due to infiltration + air change rate due to ventilation).
[m3]: indoor space volume.
[J/kg.K]: specific heat capacity of air.
[K]: outdoor temperature.
[K]: indoor temperature.
2 switch ventilation system
0.65 scheduled ventilation
13.64 mass flow of fresh ar
[infiltration] infiltration 910
indoor space volume
[heatloss_ventilation] heat loss/gain due to ventilation [forced]
forced 1.2 density of air1
1.2 density of air 0.21 constant air change
1000 const23 1
const22
1.2 const21 0 const20
0 const19
3600 const18
[const_airflowratr] const air flow rate 1
base rate
35 Temp outside
[tempindoor] T indoor
Switch1 Switch
Product51
Product50
Divide43 Divide42
Divide41
Divide40 Divide39
Add41
Add40
Add39 Add38
Figure 10: Model for the ventilation
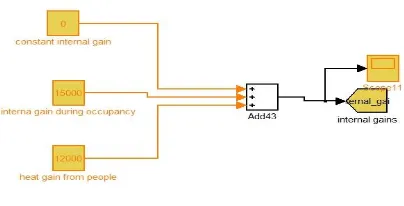
7. MATHEMATICAL MODEL FOR INTERNAL GAINS
Internal gains is basically depends upon the activity inside the room, appliances used and power consumed by each application[8].
Figure 11: Model for the internal gains
8. CONTROL STRATEGY
The control is the method of starting, stopping and regulation of HVAC scheme as well as the implement that can make tools work efficiently, and now and then gives the ability to change their proceedings over time, while conditions and occupancies may modify. Controls are tools that have the ability to observe the inputs and regulate the output of systems. Scheming of HVAC system include measure the variables and obtain data, as well as process the data with other in sequence, then cause a control action[9].
© 2016, IRJET | Impact Factor value: 4.45 | ISO 9001:2008 Certified Journal
| Page 34
4 [image:6.595.44.272.107.238.2] [image:6.595.37.261.385.495.2]mass flow of supply air1 4 mass flow of supply air
[new_indoor] indoor temp3
[temp_signal] indoor temp2
[temp_diff] indoor temp1
12 heater temp1
7 heater temp
1Temp set4 -1Temp set3
20 Temp set2
20 Temp set1 18
Temp set
1000 Temp outdoor2
1000 Temp outdoor1
Scope11
Relay
>= Relational Operator1
< Relational
Operator Product59
Product58 Product57 Product56
Product55 Product54
[temp_signal] From20
[temp_diff] From19
[tempindoor] From18
[tempindoor] From17 [tempindoor]
From16
Add49 Add48 Add47
Add46
Add45
Figure12 control design of Heating/Cooling
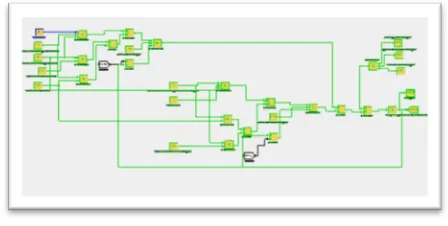
9. SIMULATION RESULTS
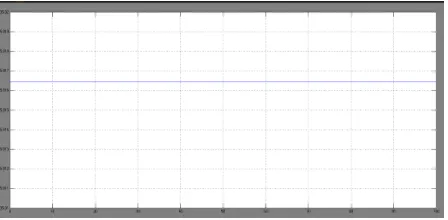
The below shown figures from 12-18 shows the temperature rise at each and every layer of the wall, roof, windows and ventilation. Here a HVAC system is developed with the proper control such that the room temperature is every time adjusted and kept automatically to 18 degrees and the result is shown in figure 13 and figure 14.
Figure 13 Temperature rise due to solar radiation
Figure 14 Total Indoor temperature after controller is placed
3. CONCLUSION
The basic physical process within classrooms with dissimilar sizes of occupancy has been modeled using MATLAB/SIMULINK software. Modeling the indoor temperature is base on the principle of conservation of energy. The main flows of force to and from the building from side to side the envelope has been modeled, captivating
into account the internal thermal loads. Then, control strategy to control temperature using an ON-OFF controller has been planned, so that it works for heating/cooling process, as it is requisite, at the same time. In direct signal, it reins heating process. After reversing of control signal, it controls cooling process, taking into account that the principle to begin to control temperature inside the room are conditions after using supply air, but in absence of heating or cooling.
REFERENCES
1. HOLOPAINEN, Riika. A human thermal model for improved thermal comfort. Ph.D. thesis, VTT Technical Research Centre of Finland, 2012
2. M. Krzaczek and J. Tejchman (2012). Indoor Air Quality and Thermal Comfort in Naturally Ventilated Low-Energy Residential Houses, Air Quality - Monitoring and Modeling, Dr. Sunil Kumar (Ed.), ISBN: 978-953-51-0161-1,
3. SHENDELL, DG., RP. PRILL, WJ. Fisk, MG. Apte, D. Blake and D. Faulkner. Associations between classroom CO2 concentrations and student attendance. Berkeley, CA: E.O. Lawrence Berkeley National Laboratory, August 2003. LBNL–53586.
4. WARGOCKI, P. and D.P. WYON. The effect of moderately raised classroom temperatures and classroom ventilation rate on the performance of schoolwork by children. HVAC&R Research, 2007, 13(2), 193–220. 5. MENDELL, MJ. and GA. Heath. Do indoor pollutants and
thermal conditions in schools Influence student performance? A critical review of the literature. Indoor Air, 2005, 15(1), 27–52.
6. BAKO-BIRO, Zs., N. KOCHLAR, D.J. CLEMENTS-CROOME, H.B AWBI and M. Williams. Ventilation Rates in Schools and Learning Performance. In Proceedings of CLIMA 2007- WellBeing Indoors, the 9th REHVA World Congress. Helsinki, Finland, pp. 1434–1440. 105 7. ASHRAE Standard 62.1–2004, Ventilation for acceptable
indoor air quality, ASHRAE, Atlanta, GA, USA. [16] GODWIN, C. and S. BATTERMAN. Indoor air quality in Michigan schools. Indoor Air, 2007, 17(2), 109–121. 8. ELLIS, M.W. and E.H. MATHEWS. Needs and trends in