© 2016, IRJET ISO 9001:2008 Certified Journal Page 638
A ROBUST METHOD FOR TUBERCULOSIS TRACKING AND SPARSE
CLASSIFICATION OF FEATURES IN CHEST RADIOGRAPH IMAGES
1
Anju Anil .J,
2Mr. Jobin Jose
1
M.Tech, Dept. of Applied electronics and Instrumentation, Lourdes Matha College of Science And Technology,
Kerala, India
2
Assistant Professor, Dept. of Electronics and Communication Engineering, Lourdes Matha college of Science And
Technology, Kerala, India
---***---Abstract
-
Tuberculosis is an infectious disease caused bybacillus Mycobacterium tuberculosis which mainly affects the lungs. Mortality rates of the patients with tuberculosis are high. When left undiagnosed and thus untreated. Standard diagnosis still remains slow and often unreliable. In this paper a new approach is proposed for the detection of tuberculosis. This approach is aimed at finding abnormal signs of a diffuse textural nature, such as they are encountered in mass chest screening against tuberculosis (TB). Before classification, geometric features of tuberculosis cell image are found from its binary image. The geometric features of tuberculosis cell image are extracted using the t-test algorithm. The extracted shape and texture features from test image are compared with the trained features. The sparse classifier classifies whether the case is TB or NON-TB. Results presented for several images show that the sparse classifier classifies the presence of tuberculosis bacteria image accurately. Moreover the classification accuracy and the effectiveness of the proposed approach are validated through MATLAB.
Key Words— classification, chest screening, T-test algorithm, sparse classifier, Tuberculosis
1.
INTRODUCTION
Gliomas are the most frequent primary brain tumors that originate in glial cells. Glial cells are the building-block cells of the connective, or supportive tissue in the central nervous system. According to World Health Organization (WHO), gliomas are classified into four grades that reflect the degree of malignancy. Grades 1 and 2 are considered low-grade and grades 3 and 4 are considered as high-grade. Grades 1 and 2 are the slowest-growing and least malignant; Grade 3 tumors are considered malignant and grow at a moderate rate. Grade 4 tumors, such as Glioblastoma multi for me, are the fastest growing and the most malignant primary brain tumors. Classification of glioma tumors is important for clinical understanding of tumor biology, clinical response and for assessing overall prognosis with brain tumors. Conventional MR imaging is the standard technique for diagnosis, treatment planning, and monitoring of CNS lesions, with superior sensitivity compared to alternative modalities. It is routinely used for the
non-invasive assessment of brain tumors, but its ability to define the tumor type and grade of gliomas is limited.
A biopsy and surgical resection is usually required to establish the diagnosis and subtype of a brain tumor after conventional MR imaging, but variations in tissue sampling may produce erroneous result during biopsy. In this work, only conventional T2-weighted MR images are considered and this modality highlight tissues with higher concentration of water in which border definition and tumor heterogeneity are best observed. Most of the segmentation technique in literature such as fuzzy c-means clustering, Markova random fields, level set method model based techniques are time consuming or complex or need human intervention. Accurate segmentation of glioma is also very important in this work because entire portion of tumor texture is considered for classification of tumor. Hence a new method for accurate detection of glioma tumor is described here.
Texture features have proved useful in differentiating normal and abnormal tissues in different organs using different types of imaging modalities. Texture analysis is very important in the brain tumor detection, as it is difficult to differentiate between various tissues using shape feature alone. 2D textural features have been previously employed for MRI brain tumor characterization and pattern recognition systems. Classification of primary and secondary brain tumors using first and second order statistics from MRIs have also been developed. Statistical analyses of texture from brain CT images for quantifying tumor heterogeneity and thereby differentiate high and low grade glioma are there in literature. Texture analysis using statistical quantification has proposed in literature for differentiating glioneuronal tumors as a subclass of grade III and IV. Malignant gliomas. Gray level co-occurrence (GLCM) based texture analysis is widely used in the detection of breast cancer in mammograms, detection of abnormal liver in CT images and detection of primary and secondary tumor in brain MRIs. Several approaches are developed in the literature for classification and grade detection of glioma tumors.
© 2016, IRJET ISO 9001:2008 Certified Journal Page 639 (ANN) and linear discriminant analysis (LDA) is cited in
literature. The features used for their study were tumor shape, intensity characteristics as well as rotation invariant Gabor texture features. Determination of degree of malignancy of glioma using SVM is also developed in the literature. The degree of malignancy was determined in their work using the features from clinic al data before operation and findings from conventional T1 and T2 weighted MRI such as age, shape, gender etc. The objective of this work is automatic detection and classification of low and high grade glioma from T2 weighted brain MRI. The framework of the method consists of detection of region of interest (ROI) using Adaptive Gray level Algebraic set Segmentation Algorithm (AGASA), feature extraction from detected tumor texture based on first order and GLCM based second order statistics, feature selection using t-test and its corresponding p-value, and classification of low and high grade glioma, based on p -values of selected features, training and performance evaluation of results using receiver operating characteristic curve (ROC).
2. SYSTEM ANALYSIS
[image:2.595.307.556.265.454.2]In this paper a new approach is proposed for the detection of tuberculosis. This approach is aimed at finding abnormal signs of a diffuse textural nature, such as they are encountered in mass chest screening against tuberculosis (TB). We first extract the lung region using a graph cut segmentation method. For this lung region, we compute a set of texture and shape features. Before classification, geometric features of tuberculosis cell image are found from its binary image. The geometric features of tuberculosis cell image are extracted using the t-test algorithm. The extracted shape & texture features from test image are compared with the trained features. The X-rays are classified as normal or abnormal using a sparse classifier. This system provides high accuracy and low feature size. Figure 4 shows the overview of the system.
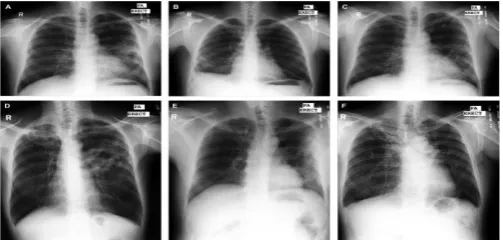
Fig. 1: Examples of abnormal CXRs in the MC dataset.
3. GRAPH CUT SEGMENTATION
[image:2.595.36.288.568.688.2]Lung segmentation is modeled as an optimization problem that takes properties of lung boundary, region and shapes into account. A lung model is to be incorporated that represents the average lung shape. As training mask publicly available JSRT set are used. First, we linearly align all training mask to a given input CXR and compute the intensity projections and measure the similarity between projections of input CXR and the training one, then we use average mask computed on the subset of similar training mask as an lung model. The pixel intensity of the lung model is the probabilities of the pixel being part of the lung field
.
Fig .2: CXR and its lung model
© 2016, IRJET ISO 9001:2008 Certified Journal Page 640 Fig .3: System Overview
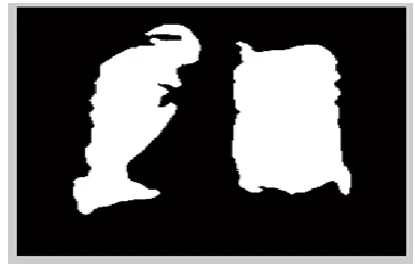
Fig. 4: Segmented lung region
Next employs the graph cut segmentation and formulates the objective function
Image is firstly divided into multiple blocks.
Each block features are calculated.
Each block is considered as a node and features as graph
Assign seeds randomly as source and destination.
Divide into groups based on the weight value.
To formulate the objective function, we define three requirements a lung region has to be satisfied; the lung region should be consistent with typical CXR intensities expected in a lung; neighbouring pixels should have consistent label; the lung region should be similar to the lung
model. Let f = { } be a binary vector
whose component correspond to foreground (lung
region) and background label assignments to pixel p € P, where P is the set of pixels in the CXR, and N is the number of pixels. According to our method, the optimal configuration of is given by the minimization of the objective function. The objective function is given by,
E(f ) =
(f )+ (f ) +
(f ) Where
, ,
and
represent the region, boundary and the lung
model properties of CXR
Fig.5: Segmented CXRs
4. FEATURE EXTRACTION
To describe normal and abnormal patterns in the segmented lung field, different features are to be extracted.
Object Detection Inspired Features
It is a combination of shape, edge and texture descriptor. for each descriptor a histogram that shows the distribution of the different descriptor values across the lung field are computed .Each histogram is a feature and all the descriptor are put together form a feature vector ,that we input to a classifier.
4.1. Intensity Histogram
Graphical representation of the image is the histogram. Histogram is a graph showing the number of pixels in an image at each different intensity value in that image. 4.2. Gradient Magnitude Histogram
First apply the gradient filter to the image (sobel filter) and convolute with the original image .Two images will be obtained g(x) & g(y)
4.3. Shape Descriptor Histogram
© 2016, IRJET ISO 9001:2008 Certified Journal Page 641 g(x)=λ1 & g(y) = λ2
SD= Where λ1 & λ2 are the eigen values of the hessian matrix
with λ1 less than or equal toλ2 Graph λ1 less than or equal to λ2
4.4. Curvature Descriptor Histogram
I(x,y) is the pixel intensity for pixel (x,y). In this Normalization with respect to intensity make the descriptor independent of image brightness.
CD= [(𝜆1∗𝜆1+𝜆2∗𝜆2)] ^0.5 / 1 + I(x,y) ) 4.5 Histogram of Oriented Gradients
HOG is a descriptor for gradient orientation weighed according to gradient magnitude .The image is divided into small connected region and for each region a histogram of gradient direction for the pixel within the region is computed .the combination of these histogram represents the descriptor
4.6. Local Binary Pattern
Local binary pattern is a texture descriptor that codes the intensity difference between neighbouring pixels by a histogram of binary patterns. LBP is thus a histogram method in itself. The binary patterns are generated by thresholding the relative intensity between the central pixel and its neighboring pixels. Because of its computational simplicity and efficiency, LBP is successfully used in various computer vision applications
Fig.6: Feature extracted CXR
5. FEATURE SELECTION
To reduce the feature size, complexities and time consumption after feature extraction feature selection is performed. Here feature selection is accomplished using the t-test algorithm. The most type of t-test is often used to assess whether the means of two classes are statistically different from each other by calculating a ratio between the difference of two class mean and the variability of the two classes. The t-test has been used to rank features for microarray data and for mass spectrometry data. The uses of t-test are limited to two-class problems. For multi-class problems, a t-statistics value is calculated for each gene of each class by evaluating the difference between the mean of one class and the mean of all the classes, where difference is standardized by the within –class standard deviation. T-test is based on a ranking based on the t-score. Here tic is the
t-statistics value for the i-th gene (feature) of the c-th class.
And is the mean of the i-th feature for all classes; xij
refers to the i-th feature of the j-th sample; N is the number of all the samples in the Cclasses and nc is the number of
samples in class c; Si is the within-class standard deviation
and S0 is set to be the median value of Si for all the features
Therefore, we generalize the t-score of each feature as;
suppose the feature set is and
feature i has different nominal values represented as. . Transform each nominal feature value into a vector with the dimension mi.
© 2016, IRJET ISO 9001:2008 Certified Journal Page 642 Feature selection depend on ranking based on a t-score.t-test
calculates the t-value .from this, probability values are assigned by the t-value. T-value obtained by evaluating the difference between the mean of one class and the mean of all the classes, where the difference is standardized by within the class standard deviation. If the difference is relatively small then the corresponding t-score of the feature is small. Hence the feature significant is also less. If the difference is large, then t-score is also high. High t-score indicate that a particular feature is dominant. Then the p values are sorted and selected. From the probability value cumulative distributive function is obtained and a graph is plotted using MATLAB. Indicates feature size decreased.
Fig.7: Graph plotted between cumulative distribution function and the probability value
6. CLASSIFICATION
Next step is the classification of chest X-rays to TB positive case as well as the negative ones. Here for classification a well-known classifier called sparse classifier is being used. The advantage of sparse classifier is that it classifies both linear as well as the non-linear data points. Let define sparse estimate that is degree of sparseness ἀ1 and ß1 as in which irrelevant or redundant components are exactly zero. Sparseness is desirable feature in classifier learning for several reasons namely; sparseness leads to a structural simplification of the estimated function; in kernel classifiers, the generalization performance increases with the degree of sparseness.
Firstly Training is considered and the trained o/p is given as Y = xa + ἀ1 f1(a) + ß1 f2(a), where Y is the training output, x denotes the transpose of the input feature values and a is the weight value. From training weight values and degree of sparseness is obtained. These parameters are applied for the classification of the sparse data. And from the known parameters actual output can be obtained that is TB positive or negative. The actual output is given by
y = xa + ἀ1 f1(a) + ß1 f2(a) 7. RESULTS
The paper proposed a system which efficiently and accurately classifies the chest x-rays to tumor positive as well as negative. The time consumption decreased in a high rate by employing T-test algorithm. T-test algorithm reduces the feature size thereby decrease the time consumption and complexities. The sparse classifier which classifies both linear as well as the non-linear data enhances the system accuracy. Existing system employs graph segmentation and classification using SVM which are being modified using t-test and the sparse classifier. Time consumption comparison graph of modified system with the existing one is being shown below
Fig.9: Time consumption graph
8. CONCLUSION
© 2016, IRJET ISO 9001:2008 Certified Journal Page 643 derived from the training set .Then computing a set of shape,
edge and texture features. Then the feature complexities and size is reduced by feature selection using t-test. Statistical significance of these features for low and high grade TB was determined using t-test and corresponding P-vale is computed, and then input to a classifier called sparse classifier which classify linear as well non-linear data points. Efficient and accurate TB detection and classification can be obtained.
REFERENCES
[1] E. Mandonnet, capelle .L. and U.Duffau. ‘Extension of paralimbic low grade gliomas : toward an anatomical detection based on white matter invasion patterns;. Journal of Neuro-oncology, Vol.78 No.2 , 2006, pp.179-185
[2] D.Schiff. ‘Low grade Astrocytomas’ 2007 , An article in American Brain Tumour Association.
[3] A.Michotte, B.Neyns, C.Chaskis, et.al, ‘Neuropathological and molecular aspects of low-grade and high grade gliomas’, Acta nuerol. beig.,Vol. 104 , 2004, pp.148-153.
[4] M. Essig, N. Anzalone ,S .E.Combs , et .al (2012) ‘Imaging of Neoplastic Central Nervous system Lesions : Review and Recommendation for current Practice’, American Journal of Neuroradiology Vol.33 , pp. 803-17.
[5] W.Bian, S.K Inas , M. L. Janine et.al ‘Multiparametric Characterization of Grade 2 Giloma using magnetic resonance Spectroscopic , Perfusion and Diffusion Imaging ‘.Translational Oncology. Vol 2 No .4. 2009, pp.271-280. [6] E .I . Zacharaki, S. Wang, S Chawla . et.al Classification of brain tumor type and grade using MRI texture and shape in a machine learning schme . Magn Reson. Med . Vol.62 , 2009 , pp. 1609 -1618.
[7] S.Cha, ‘ update on Brain Tumor Imaging : from Anatomy to Physiology’. American Journal of Neuroradiology Vol.27, 2006 , pp.475-87.
[8] D.L Pham, and J.L Prince,.’ An Adaptive Fuzzy C-Means Algorithm for Image Segmentation in the Pressence of Intensity In-homogeneties’, Patterns Recognition Letters,Vol .20 ,1998, pp. 57-68.
[9] A. Kouhi, H. Seyedaradi, A. Aghagolzadeh, ‘A Modified FCM Clustering Algorithm for MRI brain image Segmentation’. Proceedings of Machine Vision and Image Processing 2011, pp.1-5.
[10] R. S Alomari, K.Suyaprakash. C.Vipin, ‘Segmentation Of the Liver From Abdominal CT using Markov Random Field Model and GVT Snakes , International Conference on
Complex ‘. Intelligent and Software Intensive Systems IEEE Computer Society 2008, pp . 293-298
[11] A. Hoog, H. Meme, H. van Deutekom, A. Mithika, C. Olunga, F.Onyino, and M. Borgdorff, “High sensitivity of chest radiograph reading by clinical officers in a tuberculosis prevalence survey,” Int. J.Tuberculosis Lung Disease, vol. 15, no. 10, pp. 1308–1314, 2011.
[12] P. Maduskar, L. Hogeweg, H. Ayles, and B. van Ginneken, “Performance evaluation of automatic chest radiograph reading for detection of tuberculosis (TB): A comparative study with clinical officers and certified readers on TB suspects in sub-Saharan Africa,” in Eur. Congr.Radiol., 2013. [13] D. Beard, “Firefly—Web-based interactive tool for the visualization and validation of image processing algorithms,” M.S. thesis, Univ. Missouri, Columbia, 2009.
[14] P. Howarth and S. Rüger, “Robust texture features for still-image retrieval,” IEE Proc. Vis., Image Signal Process., vol. 152, no. 6, pp. 868–874, 2005.
[15] S. Chatzichristofis and Y. Boutalis, “CEDD: Color and edge directivity descriptor: A compact descriptor for image indexing and retrieval,” Comput. Vis. Syst., pp. 312–322, 2008. [16] S. Chatzichristofis and Y. Boutalis, “FCTH: Fuzzy color and texture histogram—A low level feature for accurate image retrieval,” in Proc. Int. Workshop IImage Anal.