cellular kinetics of chronic lymphocytic
leukemia B cells
Bradley T. Messmer, … , Marc K. Hellerstein, Nicholas
Chiorazzi
J Clin Invest.
2005;115(3):755-764. https://doi.org/10.1172/JCI23409.
Due to its relatively slow clinical progression, B cell chronic lymphocytic leukemia (B-CLL)
is classically described as a disease of accumulation rather than proliferation. However,
evidence for various forms of clonal evolution suggests that B-CLL clones may be more
dynamic than previously assumed. We used a nonradioactive, stable isotopic labeling
method to measure B-CLL cell kinetics in vivo. Nineteen patients drank an aliquot of
deuterated water (
2H
2
O) daily for 84 days, and
2H incorporation into the deoxyribose moiety
of DNA of newly divided B-CLL cells was measured by gas chromatography/mass
spectrometry, during and after the labeling period. Birth rates were calculated from the
kinetic profiles. Death rates were defined as the difference between calculated birth and
growth rates. These analyses demonstrated that the leukemic cells of each patient had
definable and often substantial birth rates, varying from 0.1% to greater than 1.0% of the
entire clone per day. Those patients with birth rates greater than 0.35% per day were much
more likely to exhibit active or to develop progressive disease than those with lower birth
rates Thus, B-CLL is not a static disease that results simply from accumulation of long-lived
lymphocytes. Rather, it is a dynamic process composed also of cells that proliferate and die,
often at appreciable levels. The extent to which this turnover occurs has not been previously
[…]
Article
Hematology
Find the latest version:
Research article
In vivo measurements document the
dynamic cellular kinetics of chronic
lymphocytic leukemia B cells
Bradley T. Messmer,1 Davorka Messmer,1 Steven L. Allen,1,2,3 Jonathan E. Kolitz,1,2,3
Prasad Kudalkar,2,3 Denise Cesar,4 Elizabeth J. Murphy,5 Prasad Koduru,6,7
Manlio Ferrarini,8 Simona Zupo,8 Giovanna Cutrona,8 Rajendra N. Damle,1,2,3
Tarun Wasil,9,10 Kanti R. Rai,1,9,10 Marc K. Hellerstein,4,11 and Nicholas Chiorazzi1,2,3
1Institute for Medical Research, North Shore–LIJResearch Institute, Manhasset, New York, USA. 2Department of Medicine, North Shore University Hospital,
Manhasset, New York, USA. 3Department of Medicine, New York University School of Medicine, New York, New York, USA. 4Department of Nutritional
Sciences, University of California, Berkeley, California, USA. 5KineMed Inc., Emeryville, California, USA. 6Department of Laboratories, North Shore University
Hospital, Manhasset, New York, USA. 7Department of Pathology, New York University School of Medicine, New York, New York, USA. 8Division of Medical
Oncology C, Istituto Nazionale per la Ricerca sul Cancro, Genova, and Dipartimento di Oncologia Clinica e Sperimentale, Universitá di Genova, Genova, Italy.
9Department of Medicine, Long Island Jewish Medical Center, New Hyde Park, New York, USA. 10Department of Medicine, Albert Einstein College of Medicine,
Bronx, New York, USA. 11Department of Medicine, University of California and San Francisco General Hospital, San Francisco, California, USA.
Due to its relatively slow clinical progression, B cell chronic lymphocytic leukemia (B-CLL) is classically
described as a disease of accumulation rather than proliferation. However, evidence for various forms of clonal
evolution suggests that B-CLL clones may be more dynamic than previously assumed. We used a
nonradioac-tive, stable isotopic labeling method to measure B-CLL cell kinetics in vivo. Nineteen patients drank an
ali-quot of deuterated water (
2H
2O) daily for 84 days, and
2H incorporation into the deoxyribose moiety of DNA
of newly divided B-CLL cells was measured by gas chromatography/mass spectrometry, during and after the
labeling period. Birth rates were calculated from the kinetic profiles. Death rates were defined as the difference
between calculated birth and growth rates. These analyses demonstrated that the leukemic cells of each patient
had definable and often substantial birth rates, varying from 0.1% to greater than 1.0% of the entire clone per
day. Those patients with birth rates greater than 0.35% per day were much more likely to exhibit active or to
develop progressive disease than those with lower birth rates Thus, B-CLL is not a static disease that results
simply from accumulation of long-lived lymphocytes. Rather, it is a dynamic process composed also of cells
that proliferate and die, often at appreciable levels. The extent to which this turnover occurs has not been
pre-viously appreciated. A correlation between birth rates and disease activity and progression appears to exist,
which may help identify patients at risk for worsening disease in advance of clinical deterioration.
Introduction
B cell chronic lymphocytic leukemia (B-CLL) is characterized by a lymphocytosis of mature-appearing clonal CD5+ B lymphocytes
(1). B-CLL cells arise from the bone marrow and infiltrate lym-phoid tissues such as lymph nodes and the spleen. All of these are sites of leukemic cell proliferation (2, 3), as very few dividing cells are observed in the blood (4). The prevailing view of B-CLL is that it is an accumulative disease (5). However, the inability to precisely define an underlying defect in apoptosis in the leukemic clone (6) and evidence supporting clonal evolution (7) suggest that this view may be too simplistic.
The clinical course of B-CLL patients varies widely. Patients can have stable disease, in terms of leukemic cell load and clini-cal symptoms, for a decade or longer (8). Several molecular
corre-lates of poor clinical outcome have emerged in recent years. The absence of mutations in the Ig variable region genes of B-CLL clones has significant prognostic value, correlating with a poor outcome (9, 10). Expression of ζ chain–associated protein 70 kDa (ZAP-70) mRNA or protein (11, 12) and the presence of CD38 on the leukemic cell surface also presage poor outcome (9, 13–16). Several cytogenetic abnormalities (in particular, dele-tions at 17p13 and 11q22–23) are associated with unfavorable clinical courses, whereas a deletion at 13q14, in the absence of other abnormalities, bodes a slightly better clinical outcome (17). Finally, the doubling time of circulating B-CLL cells has prognostic value (18, 19) that may be applied in a clinically use-ful proliferation index (20, 21).
The kinetics at which B-CLL cells are produced, are anatomi-cally exchanged, and die has been an area of interest for several decades (22). A variety of approaches, including infusion of chro-mium-labeled leukemic cells (23), in vivo labeling with thymidine and other nucleic acid precursors (24), and the extracorporeal irradiation of blood (ECIB) (25), have been used to address these issues. However, these early studies were limited by small patient numbers, short labeling and observation times, limited computing power to fit models, and difficulty in obtaining highly enriched leukemic cells. There has not been a kinetic study using modern technologies informed by current molecular markers.
Nonstandard abbreviations used: B-CLL, B cell chronic lymphocytic leukemia; ECIB, extracorporeal irradiation of blood; GC/MS, gas chromatography/mass spec-trometry; 2H
2O, deuterated “heavy” water; PMNL, polymorphonuclear leukocyte; WBC, white blood cell; ZAP-70, ζ chain–associated protein 70 kDa.
Conflict of interest: M. Hellerstein, in conjunction with the University of California, holds a patent on the use of the deuterium labeling technique used to determine the kinetics of cell replication in vivo. This patent is currently licensed to KineMed Inc., a for-profit company of which M. Hellerstein is a cofounder and shareholder. E. Mur-phy is an employee of KineMed Inc.
This study used deuterium, a nonradioactive isotope detect-able by mass spectrometry, that was administered in the form of deuterated “heavy” water (2H2O), to label newly synthesized
DNA of dividing cells in vivo (26). The kinetic profiles identi-fied for many patients fit first-order assumptions, although in other patients more complexity was observed and the use of a 2-compartment model and important analytical corrections were required. The data demonstrate that B-CLL cells prolifer-ate at definable and, in some cases, substantial rprolifer-ates (about 0.1% to greater than 1.0% of the clone per day). In most instances, patients whose clonal birth rates exceeded 0.35% per day had symptoms or signs of active or progressive B-CLL. Thus, these studies highlight the dynamic nature of B-CLL clones and define sizeable rates of birth and death that were previously unappre-ciated. The rates of daily clonal turnover may serve as an addi-tional indicator of patients at risk for more aggressive forms of this currently incurable disease.
Results
Measurement of 2H2O enrichment in vivo. Nineteen patients were
enrolled in the current study (Table 1). Patients daily drank suf-ficient 2H
2O (approximately 60 ml/d) to reach a systemic level
of 2H2O of approximately 1–2% of total body water. This dose
is diluted into the body water pool — whose size, as a fraction of body weight, was estimated from the rate of 2H loss after the 2H
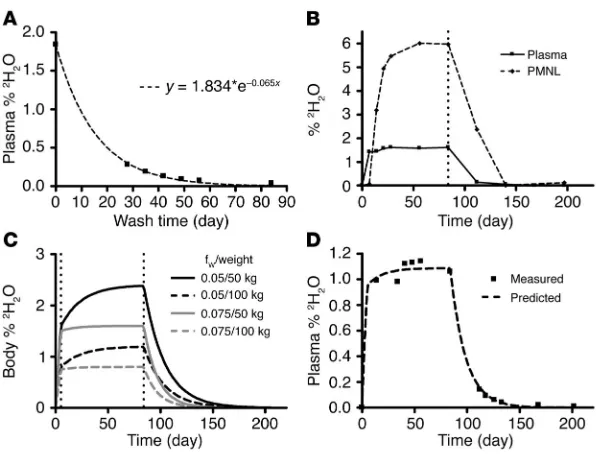
2O intake period (see Methods and Figure 1A). Figure 1B
illustrates 2H2O enrichments achieved in the aqueous fraction of
plasma and in DNA of polymorphonuclear leukocytes (PMNLs)
from patient CLL165 after an 84-day labeling phase and a 104-day washout period. These data are typical for other patients in the study. Note that PMNLs with 2H-marked DNA were
identi-fied in the blood approximately 7 days after the patient began imbibing 2H2O. Peak enrichment for these cells was reached by
14 days and was maintained until cessation of 2H
2O intake, at
which time marked cells began to decline. The results obtained for PMNLs provided a kinetic comparison of a normal and rap-idly-turning-over cell population with the leukemic B lympho-cytes of each patient.
Maximum levels of 2H2O were detected in the plasma of this and
other patients at the time of the first blood drawing, day 7 (Figure 1B). This equilibrium level was maintained throughout the 84-day labeling period and then decreased after 2H
2O intake ceased. Close
inspection of the washout phase revealed that it could take more than 2 weeks for the body 2H
2O levels to drop to 50% and over 5
weeks for them to drop to 10% of equilibrium values (Figure 1B). To account for this persistence and to assure that residual 2H
pres-ent during the washout phase did not skew interpretation of sub-sequent data points, an exponential model for body 2H
2O levels
was developed (see Methods). The body 2H2O model predicted that
the uncorrected skewing could be significant for certain subjects; in particular, those individuals whose daily water exchange rates (fw) were low (Figure 1C). This was the case for several patients in
[image:3.585.55.526.112.380.2]this study (see Supplemental Table 1; supplemental material avail-able online with this article; doi:10.1172/JCI200523409DS1) and is not surprising since B-CLL patients are often elderly and less active. The model accurately predicted the measured levels of body
Table 1
Clinical and laboratory features of the B-CLL patients enrolled in this study
Patient Age Sex Rai Years Active or Treatment VH mutation CD38 ZAP-70 Cytogenetic abnormalities Birth
stage since progressive (years)A status (% cells) protein (% cells) rateC
diagnosis disease (% difference)B Δ11q22 Tri12 Δ13q14 Δ17p23 (%/day)
CLL107 60 M 0 8.25 – – 6.9 1 – ND <5 21.1 <5 0.23
CLL109 76 F 0/I 9.0 – – 7.1 21 – ND 59.7 <5 <5 0.11
CLL165 64 M 0 5.5 – – 5 2 – 38.3 <5 96 <5 0.14
CLL169 40 M I 6.0 + Post 2 yr 5.1 5 – ND <5 90.9 <5 0.49
CLL189 58 M IV 5.0 + Pre 1 yr/ 0.3, 6.8 4 – <5 <5 70 <5 0.81
Post 0.3 yr
CLL280 63 M 0 3.25 – – ND 1 + <5 <5 98.6 <5 0.22
CLL282 65 M II 2.0 + Pre 1.5 yr/ 2.4 0 + ND 100 <5 <5 0.39
Post 1.5 yr
CLL321 50 M 0 5.0 – – 0.3 6 ++ <5 58.9 <5 <5 0.29
CLL331 71 M 0 0.75 – – 3.7 1 – <5 <5 <5 <5 0.24
CLL332 46 M I 0.5 + Post 1 yr 1 57 + ND <5 93.5 <5 0.24
CLL336 74 F IV 4.75 + Post 2 yr 2 2 – ND <5 89.5 <5 0.41
CLL355 71 M I 5.0 + – 0 24 – 68.4 <5 25 <5 0.45
CLL360 60 M 0/I 2.0 – – 0.3 32 ++ ND 7.5 7.5 <5 0.48
CLL394 55 M I/II 1.0 – – 0 72 ++ 76.2 <5 55.6 <5 0.18
CLL400 63 M I 1.0 + Pre 1 yr/ 0 5 ++ <5 <5 <5 <5 1.76
Post 0.5 yr
CLL403 49 M II 2.5 + Post 0.25 yr 0 68 + 90.5 <5 11.3 <5 0.39
CLL408 63 M I At diagnosis – – 0.3 98 + <5 <5 23.3 <5 1.09
CLL418 67 M 0 0.25 – – 4 17 – ND 47.4 45.6 <5 –
CLL472 67 M 0 0.25 + – 0 9 ++ <5 40 <5 <5 0.54
ATemporal relationship, in years, between treatment initiation and current study. BPercent difference from most similar germ-line gene. DNA sequences at
least 2% different from the most similar germ-line counterpart were considered mutated. CPercent values apply to the current study. ND, not determined; pre,
research article
2H
2O in the subjects studied (Figure 1D). Therefore, we
incorpo-rated this 2H2O function into the models used (Figure 2) for
esti-mating cell kinetics during the washout phase.
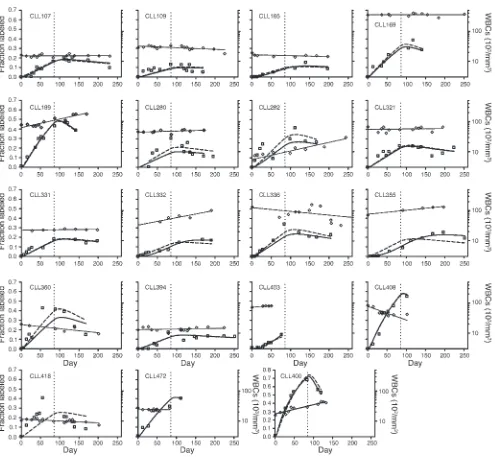
[image:4.585.43.341.79.306.2]Kinetic patterns of leukemic B lymphocytes in individual B-CLL patients. The fraction of labeled B-CLL cells for the 19 patients at each time point of their involvement in the study is shown in
Figure 3. White blood cell (WBC) counts are also plotted for each patient during the study period. It is noteworthy that the patterns of appearance and disappearance of 2H-marked cells varied
among patients, although shared qualitative fea-tures were apparent.
First, patients could be divided as having high birth rates, with fractions of labeled cells exceed-ing 0.35 at the peak (patients CLL169, CLL189, CLL282, CLL336, CLL355, CLL360, CLL400, CLL403, and CLL472), or low birth rates, with fractions less than this value (Figure 3). Second, in most instances, labeled B-CLL cells appeared in the blood within a few weeks, which indicates that the cells are rapidly released from the site of division following new DNA synthesis and cell division. There were, however, exceptions. In 6 patients (CLL107, CLL165, CLL280, CLL355, CLL394, and CLL403), there was a significant lag between initiation of 2H
2O intake and appearance
of labeled cells in the peripheral blood. In these subjects, enrichment of 2H in cellular DNA
con-tinued to rise after the 84-day 2H2O intake period
was completed. This was most pronounced in patient CLL355 (Figure 3), in whom no marked cells appeared in the blood until 56 days into the labeling period and peak enrichment did not occur until approximately 155 days into the study period (71 days after 2H2O intake ceased).
No changes in lymph node or spleen size were found on physical examination in this patient. Third, the decline phase was quite heterogeneous among patients, with examples of apparent fast (e.g., patients CLL189 and CLL400), slow (e.g., patients CLL107, CLL331, and CLL418), and negligible (e.g., patients CLL165, CLL332, and CLL394) elimination functions (Figure 3).
Birth rates of B-CLL cells in vivo. The qualitative descriptions above are limited in their utility, and more quantitative data were desired. Therefore,
2H enrichment data obtained for each patient’s
CD5+CD19+ B cells were analyzed in 3 ways (Table 2 and
Supple-mental Table 1). First, a minimum rate of cell proliferation in the labeled cell fractions was calculated by division of the peak level
Figure 1
Modeling of the 2H2O levels in patients drinking 2H2O. (A) 2H2O enrichment data from the plasma of a CLL patient, showing that the dilution of 2H2O during the washout phase fits an exponential decay model. For the patient shown (CLL109), the equilibrium 2H2O enrichment was approximately 1.8% during the 2H2O intake period. Therefore, the daily water exchange rate, Wday, for this individual was approximately 2.3 l/d (2H2O intake of 60 ml/d × 70% 2H2O = 42 ml/d, divided by 0.018). The rate of the exponential decay is the fractional daily water exchange rate, fw, and, for the patient shown, was 0.065 per day. The total body water was therefore 35.4 liters (2.3/0.065). This individual weighed 55 kg, so the fraction of body weight due to water was 0.64. This fraction was used for all patients in the study to estimate total body water when a patient’s weight was avail-able. When a patient’s weight was not recorded, an fw value of 6% per day was used. (B) Representative raw data for 2H2O enrichment in plasma and CD5+CD19+ cells from a B-CLL patient (CLL165). PMNL DNA saturates at a stable enrichment related to the 2H2O plasma enrichment. The vertical line at day 84 indicates the time at which the patient ceased intake of 2H2O. (C) Body 2H2O enrichment models for patients of various weights and fractional daily water exchange rates. Patients with high fw equilibrate faster, while
patients with low fwcan deviate substantially from a square pulse. (D) Body 2H2O
[image:4.585.331.510.587.741.2]enrich-ment model derived from a patient’s weight and equilibrium 2H2O enrichment accurately predicts the measured body 2H2O enrichment values.
Figure 2
of the fraction of labeled cells (f) by the duration of water intake. The peak levels of f ranged from 0.13 (patient CLL109) to 0.68 (patient CLL400). These calculations indicated leukemic cell proliferation rates between 0.10% and 0.81% per day (fpeak%/day,
Table 2). Preliminary analyses of peripheral B cells from 3 nor-mal individuals matched for age (50–72 years), who followed the same 2H2O drinking protocol, indicated fpeak%/day values
between 0.1% and 0.3% (data not shown).
Next, we used single-compartment (Figure 2A) and 2-compart-ment (Figure 2B) models to fit to the data. Both approaches take advantage of all the data obtained at each of the multiple time points sampled. The latter approach may have additional merit
since it anticipates that B-CLL cells proliferate in a distinct com-partment, i.e., the solid lymphoid tissues, separated from the sampled blood compartment.
[image:5.585.47.542.77.534.2]Both models were fit to the data of all patients (Figure 3), and the resulting parameter values were determined (Table 2 and Supplemental Table 1). Using these 2 approaches, birth rates of leukemic cells from the 19 patients studied were similar and ranged from 0.12% to 1.08% per day for the single-compartment model and from 0.11% to 1.75% per day for the 2-compartment model. Thus, for most patients, the 2 models did not differ appreciably in quality of fit to the data or in the resulting birth rate estimates, and they were therefore interchangeable (Table 2
Figure 3
research article
and Supplemental Table 1). However, the 2-compartment model fit the data of patients CLL332, CLL355, and CLL403 much more accurately (see r2 values in Supplemental Table 1), and the birth
rate estimates were larger based on the 2-compartment model fits for these 3 patients (0.24 vs. 0.18%/day, 0.45 vs. 0.24%/day, and 0.39 vs. 0.17%/day, respectively). The
data from 4 patients (CLL109, CLL280, CLL282, and CLL418) did not fit well into either model.
Long-term follow-up measurements. Four patients (CLL165, CLL331, CLL336, and CLL355) provided blood samples more than 1 year after the completion of the orig-inal study (624, 519, 666, and 444 days after discontinuing 2H
2O intake, respectively).
When circulating B-CLL cells were isolated, significant levels of 2H were still detectable
in the DNA of the leukemic cells (Figure 4). The 2-compartment models that had been fit to their original data were projected out to the time of the acquisition of these long-term samples, and in each case the labeled cell fractions were quite close to the values expected by the model projections.
Growth and death rates of B-CLL cells in vivo. Clonal growth rates were calculated for each patient by fitting of an exponential curve (Figure 3 and Table 3) to the WBC counts from the beginning to the end of the study period. Five patients (CLL189, CLL332, CLL355, CLL400, and CLL403) had increasing numbers of WBCs and thus positive growth rates, 6 patients (CLL107,
CLL169, CLL321, CLL331, CLL394, and CLL472) had stable WBC levels and essentially zero growth rates, and 4 patients (CLL165, CLL336, CLL360, and CLL408) with falling WBC counts had negative growth rates. By assuming that the rate of change of the peripheral blood WBC count reflects total clonal growth (in the absence of identifiable changes in the size of measurable periph-eral tissues), we calculated a death rate for each patient’s clone as the birth rate minus the growth rate (Table 3).
Interestingly, there was not an obvious correlation between birth rates and growth rates, presumably because of differences in death rates (Figure 5). For example, patient CLL408 had the second highest birth rate of any individual in the study (1.09% per day), although the WBC number actually fell during the course of the study. Patients CLL355 and CLL400 had positive growth rates and increasing WBC counts. For patient CLL355, the birth rate was approximately equal to the growth rate, suggesting little death, whereas patient CLL400 had a birth rate that exceeded the growth rate, suggesting significant cell death.
Relationship between in vivo B-CLL cell kinetics and disease activity and progression. Of the 19 patients enrolled in this study, 10 had B-CLL cell birth rates greater than 0.35% of the clone per day (Table 2). Of these patients, 8 were designated as having active or progressive disease based on criteria defined by the National Cancer Institute (Table 1) (27). In contrast, for those 9 patients whose leukemic cells had birth rates less than 0.35%, only 1 was classified as hav-ing active or progressive disease. Thus there appears to be a direct and statistically significant (P = 0.0055 by Fisher’s exact test) rela-tionship between leukemic cell birth rates and a patient’s clinical course. Nevertheless, a statistically significant correlation between the in vivo kinetic data and differences in Ig VH gene mutation
[image:6.585.52.276.114.344.2]status, ZAP-70 or CD38 expression, and cytogenetic abnormalities was not defined (Tables 1 and 2).
Table 2
Kinetic and model parameters
Patient fpeak% fpeak%/day Single- Two-
compartment compartment model, b%/dayA model, B%/dayA
CLL107 20.7 0.25 0.22 0.23
CLL109 13.1 0.16 0.12 0.11
CLL165 15.2 0.18 0.13 0.14
CLL169 38.6 0.46 0.49 0.49
CLL189 43.1 0.51 0.80 0.81
CLL280 30.4 0.36 0.22 0.22
CLL282 41.3 0.49 0.55 0.39
CLL321 22.5 0.27 0.30 0.29
CLL331 18.2 0.22 0.24 0.24
CLL332 17.6 0.21 0.18 0.24
CLL336 34.0 0.40 0.40 0.41
CLL355 25.1 0.30 0.24 0.45
CLL360 41.4 0.49 0.66 0.48
CLL394 19.9 0.24 0.17 0.18
CLL400 68.1 0.81 1.73 1.76
CLL403 14.6 0.17 0.17 0.39
CLL408 54.8 0.65 1.08 1.09
CLL418 40.7 0.48 0.28 –
CLL472 31.8 0.38 0.53 0.54
AItalicized values indicate poor model fits.
Figure 4
[image:6.585.215.542.458.685.2]Discussion
In this study, we identified newly formed leukemic B cells by using an in vivo stable isotope labeling technique (26). This technique utilizes 2H2O, which is an easily administered, well-tolerated, and
harmless molecule that can be taken for weeks or months. B-CLL cells were analyzed for 2H incorporation into deoxyribose in DNA
in order to measure cell division. From these data, we made several informative observations regarding the birth, growth, and death rates of B-CLL cells in vivo.
Birth rates of B-CLL cells. The leukemic cells of patients with B-CLL do not have inconsequential levels of cell division in vivo, as previ-ously hypothesized (5). Rather, ample cellular proliferation clear-ly occurs within the leukemic clones of all B-CLL patients, and in some patients these levels are quite substantial (Table 2). For example, for subject CLL400, 68.1% of the B-CLL cells were newly synthesized over the 84-day labeling period (fpeak,Table 2). In
con-trast, the leukemic cells of some subjects (e.g., patient CLL109) exhibited much slower, but still significant, levels of cell prolifera-tion, with approximately 13% being born during the same labeling interval (fpeak,Table 2). Presumably, much of the cellular generation
emanated from proliferation centers that are frequently found in lymph nodes and bone marrow of B-CLL patients (3, 28). It has been suggested that the number and size of these structures cor-relate with lymphocyte doubling times (29).
Studies performed over 3 decades ago estimated similar daily proliferation rates (30, 31), although these studies were hindered by difficulties inherent in using radioactive tracers in humans, the need to perform ECIB, and the inability to precisely define leuke-mic lymphocytes within blood mononuclear cell fractions. Nev-ertheless, the fact that these approaches yielded data in line with those reported here supports our findings, since each methodol-ogy is prone to distinct potential artifacts. The method used here, labeling newly synthesized DNA, might be influenced if there were
very substantial levels of DNA synthesis not associated with rep-lication (i.e., DNA repair, sometimes termed “unscheduled DNA synthesis”). However, if this were the case, then the data obtained using ECIB or tracking of chromium-labeled cells, which do not require the incorporation of a label into newly synthesized DNA, would not correlate with our data or the old data generated using the 3H infusion technique that also involves an incorporation
pro-cess. Furthermore, although normal B lymphocytes have a rela-tively high level of ongoing DNA repair (32), there is no clear-cut evidence for increased basal DNA repair activity in B-CLL cells. Finally, if increased unscheduled DNA synthesis were responsi-ble for incorporation of significant amounts of label, one would expect that every subject would show a steady increase in labeled DNA from the beginning of the intake period, which was clearly not the case for several of our subjects.
Variability in patterns of leukemic cell turnover among B-CLL patients. Another intriguing observation is the diversity in the patterns of appearance and disappearance of 2H-marked B-CLL cells in the
blood of different patients. This variability includes a marked lag in appearance of 2H-marked B-CLL cells in the blood for some
sub-jects (Figure 3). As would be expected in these patients, the frac-tion of labeled cells continued to increase for many weeks after the end of the 2H intake phase. Since those cells appearing after intake
must have been produced while 2H was present, they had to have
remained in a separate compartment for some time prior to being released into the blood.
[image:7.585.52.275.117.345.2]The analysis of B-CLL cell kinetics must consider potential trafficking of cells between various body compartments. Several studies have indicated the presence of an extravascular compart-ment that rapidly equilibrates with blood, so that these two can be considered as a single anatomic unit (33). The concept of the existence of a second compartment, engaged in a lesser level of exchange with the peripheral compartment, came from results of studies of ECIB (30) and chromium infusion that suggested that this compartment probably included the spleen (34). Finally, a less exchangeable compartment, probably organized lymphoid tissue and bone marrow, was postulated (30, 34) to contain the vast majority of leukemic cells not accounted for by the other two (35). These compartments were simplistic in biologic terms, and,
Table 3
Growth and death rates
Patient ΔWBC %/day Single-compartment Two-compartment model, death, model, death,
%/dayA %/dayA
CLL107 0.006 0.21 0.22
CLL109 –0.125 0.25 0.24
CLL165 –0.073 0.20 0.21
CLL169 –0.001 0.49 0.49
CLL189 0.656 0.14 0.15
CLL280 0.087 0.13 0.13
CLL282 0.654 –0.10 –0.26
CLL321 0.035 0.27 0.26
CLL331 0.033 0.21 0.21
CLL332 0.567 –0.39 –0.33
CLL336 –0.289 0.69 0.70
CLL355 0.302 –0.06 0.15
CLL360 –0.311 0.97 0.79
CLL394 0.045 0.13 0.14
CLL400 0.712 1.02 1.05
CLL403 0.241 –0.07 0.15
CLL408 –1.052 2.13 2.14
CLL418 –0.141 0.42 –
CLL472 –0.053 0.58 0.59
[image:7.585.301.543.528.628.2]AItalicized values indicate poor model fits.
Figure 5
research article
in addition, their conceptualization led to models of B-CLL kinet-ics that were mathematically complex and difficult to apply to data obtained only from peripheral cells.
Because of such issues (lag in the appearance of labeled cells in the blood and the possibility of trafficking/recirculation com-plexities), we chose to analyze our data using both a 2-compart-ment model, consisting of the sampled blood compart2-compart-ment and a proliferative compartment, and a single-compartment model that combines these 2 sites. The single-compartment model fit many patients as well as the 2-compartment model did, even though the latter was anticipated to more accurately represent the biologic reality. In these cases, the birth rate estimates were similar to the minimal birth rate estimate of the peak f divided by the duration of 2H
2O consumption. Explanations may include a high rate of
exchange, relative to cell birth, between compartments or a very large proliferative compartment relative to the sampled compart-ment. The relative sizes of the compartments (vr) predicted by
the 2-compartment model (Supplemental Table 1) were consis-tent with the accepted notion that the bulk of the leukemic clone resides in solid lymphoid organs. The data from several patients (CLL332, CLL355, and CLL403) were significantly better fit by the 2-compartment model; this justified its use and pointed to variations in the kinetic structure between and possibly within B-CLL clones. Of note, CLL332 was modeled to have a birth rate that was less than the WBC growth rate. This inconsistency sug-gests an additional level of biologic complexity not accounted for in our models, but potentially of physiologic interest.
There are several assumptions implicit in the models we used. The compartments were assumed to be homogeneous and well mixed with no significant subcompartmental sequestering or structure. The 2-compartment model assumes that changes in WBC counts reflect those of the total clone, which may not neces-sarily be the case in every patient. Furthermore, the rates of birth, efflux, and death were assumed to remain constant without bursts of growth or release from the first compartment or sudden die-offs or clearance from the blood. The long-term follow-up data from the 4 patients illustrated in Figure 4 suggest that the measured rates can remain stable, and therefore, at least for these patients, the assumptions were not grossly inaccurate. Considerable devia-tions from these predicted values may be indicative of changes in the kinetic properties of the clone or its members.
Death rates of B-CLL cells. Finally, the proliferation rates that we have documented, particularly in patients with stable WBC counts, suggest that the B-CLL clone is continually dying and replenishing itself. Indeed, we calculated death rates approach-ing or exceedapproach-ing 1% of the entire clone per day in some patients (e.g., CLL336, CLL360, CLL400, CLL408, and CLL472; Table 2 and Figure 5). Thus, in most patients, a significant portion of the clone is not inherently defective in apoptotic potential, since, if such a defect were present in all members of a B-CLL clone, stable WBC counts would not be observed in the presence of cell proliferation. It is interesting that the fastest clonal birth was not always associated with increases in WBC counts, at least dur-ing the study period. For example, patient CLL169 exhibited a massive circulating clonal load (approximately 350,000 cells per cubic millimeter) that remained stable over the 6-month experi-ment, and patient CLL336 exhibited a clonal fall of an appre-ciable degree (134,000 per milliliter to 49,300 per milliliter). Both patients exhibited high fractions of newly divided B-CLL cells (Figure 3 and Table 2), and in each case, there were no
detect-able changes in clinical parameters. These findings emphasize that stability in blood WBC levels does not reflect underlying cellular dynamics; rather, the net effect of clonal turnover at the WBC level reflects a balance between cell birth and death rates. Although in most instances of malignancy a tendency for higher birth or lower death rates is presumably present, there may be times in the evolution of a B-CLL clone when these two are equal or even tipped toward slower growth or faster death, in at least a portion of the clone (Figure 5). Such shifts in net balance may explain the clinical observation that WBC levels can increase over time in a stepwise, as opposed to linear, fashion.
Clinical implications. The measurements presented here provide a foundation for kinetic modeling of this disease, which may predict clonal behavior, explain clinical observations, and suggest thera-peutic approaches. The measurement of clonal birth and death rates may provide another manner by which clinical progression could be defined and even predicted. The correlation between birth rates and disease activity/progression suggests that this may very well be true. Eighty percent of those patients with clonal birth rates in excess of 0.35% per day exhibited evidence for active or progressive disease in the 6-month period preceding the study or in the subsequent follow-up period after leaving the study. Fur-thermore, 5 of the 6 patients that required therapy before, during, or after the study period had birth rates greater than 0.35% per day. Despite this relationship, a significant correlation between the in vivo kinetic data and differences in Ig VH gene mutation status,
ZAP-70 or CD38 expression, cytogenetic abnormalities, or serum lactate dehydrogenase, or differences in findings on physical exam-ination (i.e., lymphadenopathy or splenomegaly), was not identi-fied. However, this may represent the fact that the latter markers portend the eventual clinical outcome for an individual patient, whereas the former measurements are “real-time” estimates of the kinetic activities of the leukemic clones. A larger study will be nec-essary to determine whether these correlations persist.
In addition, the ability to analyze a patient’s 2H-labeled cells a
year or more after the end of the 2H
2O labeling period (Figure 4)
may allow detection of significant kinetic changes in the clone over that period. If the level of enrichment defined at the time of the extended blood sampling were in line with preceding kinetic estimates, then this would suggest a stable clonal structure. How-ever, if the level were significantly lower or higher than predicted, this could reflect either enhanced dilution of the labeled leukemic cells by a faster-growing or slower-dying clonal variant (if lower than predicted) or a deficiency of dilution because of the emer-gence of variants with decreased birth or enhanced death rates (if higher than predicted). The threshold level of label required for accurate quantification is primarily a function of the mass spectrometry, and more sensitive instruments currently avail-able could significantly extend the post–2H2O-drinking period in
which useful data could be obtained.
Finally, a substantial birth rate also enables consideration of models of disease progression that invoke clonal evolution as a significant event. The rate at which a biologic system evolves is determined by the frequency at which variants are produced and their relative selective advantages. For newly generated subclones to become a major proportion of the total population, they must either arise very early in the life of the clone or have a selective advantage over the bulk of the clone. Selective advantage mani-fests as an increased growth rate, which could be due to faster cell division, decreased cell death or clearance, or both. If the B-CLL clone were simply dividing slowly with little loss of cells, it would be difficult for novel variants to catch up with the already massive leukemic burden. However, in the face of substantial proliferation and death of the leukemic cells, novel variants could more quickly expand to a substantial level. Possibly, the growth rate of B-CLL cells may not be as important for prognosis as the birth rate, since proliferation, even if it is counterbalanced by apoptosis, may not result in excessive clonal growth but could facilitate accumulation of new dangerous mutations. The level of B-CLL cell turnover that we have documented, therefore, has important implications for the natural history of an individual patient’s disease progression.
In summary, B-CLL cells proliferate at appreciable rates. This finding is in conflict with the dogma that B-CLL is a disease char-acterized almost exclusively by cell accumulation due to a defect in apoptosis. Indeed, a wide range of cell proliferation and death rates exists among different patients, suggesting that, as in most cancers, the dynamic interplay between these processes may differ among and within patients. The observed interindividual diversity in cellu-lar kinetics suggests that further investigations powered to look for correlations between synthesis rates and clonal biology, subsequent disease progression, and response to therapy are warranted.
Methods
B-CLL patients. Nineteen patients with B-CLL (17 in Rai stages of II or less and 2 in Rai stage IV) diagnosed by established criteria were enrolled in the study after providing informed consent (Table 1). Of the 19 subjects enrolled, 10 had stable disease and 9 active or progressive disease, using established criteria (27). Sixteen patients had never received treatment. Three patients (CLL189, CLL282, and CLL400) had received treatment more than 6 months before entry into the study. Patient CLL403 had to discontinue the study after 12 weeks because of a need to start chemother-apy. Patients CLL189, CLL282, CLL332, CLL336, and CLL400 were treated after the end of the experimental period. Patient CLL472 did not return after 12 weeks into the study for personal reasons. None of the patients in the study exhibited hemodynamic impairment from either cardiac or renal disease. This study was approved by the North Shore–LIJ Health System’s Institutional Review Board and was conducted according to the principles of the World Medical Association Declaration of Helsinki.
Experimental protocol. Patients were given premeasured, individual aliquots of 2H2O (70% enriched; Cambridge Isotope Laboratories Inc.). Patients drank 90 ml of 2H2O twice daily for 5 days (loading) followed by 60 ml once daily for 79 days (maintenance). The goal was to enrich body water to 1–1.5% deuterium. Patients returned at scheduled intervals dur-ing and followdur-ing the labeldur-ing period to donate blood for cell and serum analyses. In addition, all patients kept a daily log of 2H2O intake. These logs were evaluated and discussed with each patient on every visit to the North Shore–LIJ Research Institute’s General Clinical Research Center to assure compliance with the protocol. No major unexpected side effects were encountered, although 3 patients complained of a transient sense of lightheadedness during the loading phase.
Cell isolations. PBMCs were isolated from the blood of B-CLL patients by density gradient centrifugation through a Ficoll-Hypaque cushion (Amersham Biosciences Corp.). CD3+ T cells were removed from these fractions by positive selection using anti-CD3 microbeads (Miltenyi Biotec Inc.) following the manufacturer’s instructions. CD5+ B cells were separated from the CD3– fraction by incubation with anti-CD5 mAb con-jugated with PE (BD Biosciences — Immunocytometry Systems) for 20 minutes at 4°C, washing 4 times in buffer (PBS, 5% BSA, 2 mM EDTA), and subsequent incubation with anti-PE mAb linked to beads (Miltenyi Biotec Inc.). The CD5+ fraction, which contained greater than 95% CD19+ cells as assessed by flow cytometry, was centrifuged into a pellet and stored frozen at –20°C until further use.
PMNLs were separated from the red blood cell fraction after density gra-dient centrifugation of PBMCs (see above). PBS and 3% dextran were added at equal volumes to the red blood cells, and the cells were incubated for 25 minutes at room temperature. The suspension containing PMNLs was col-lected and centrifuged; remaining red blood cells were removed using lysis buffer. PMNLs were stored frozen as dry pellets at –20°C until needed.
Analyses of Ig VH mutation status, expression of ZAP-70 and CD38, and
cytogenetic abnormalities. Ig variable sequences were obtained and ana-lyzed as previously described (36). CD38 surface expression was deter-mined by flow cytometry (9). ZAP-70 protein expression was deterdeter-mined by Western blotting (37) using the anti–human ZAP-70 mAb clone 2F3.2 (Upstate Biotechnology Inc.) or clone 29 (BD). The percentage of T cells or NK cells present in each B-CLL sample was determined by immunofluorescence using anti-CD3 or anti-CD56 mAb (BD). In those samples with greater than 10% contaminating non-B cells, B lymphocytes were purified by positive selection using anti-CD19 microbeads (Miltenyi Biotec Inc.). B-CLL samples were divided into 3 groups of ZAP-70 expression: ++, 40–100% positive cells; +, 20–40%; and –, less than 20%. This percentage was determined by admixture of different concentra-tions of purified T cells with mononuclear cells depleted of T and NK cells from the same healthy donor. Anti-CD3 and anti-CD56 mAb fol-lowed by magnetic beads (goat anti-mouse IgG Dynabeads; Dynal Bio-tech ASA) was used to deplete T and NK cells. Cytogenetic analyses were performed by FISH using the following probes: chromosome 11, LSI ATM at 11q22.3; chromosome 12, CEP-12 centromere; chromosome 13, LSI D13S319 at 13q14.3 and LSI 13q34 at 13q34; and chromosome 17, LSI p53 at 17p13.1 (all probes from Vysis Inc.).
Measurement of body 2H2O enrichment. The enrichment of 2H2O in plasma was measured by gas chromatography/mass spectrometry (GC/MS) as described previously (26). 2H2O enrichment was calculated by comparison with standard curves generated by mixture of 100% 2H2O with natural-abundance H2O in known proportions.
Measurement of stable isotope enrichment in deoxyribose from DNA. Genomic DNA was isolated from B-CLL cells and PMNLs (38) and hydrolyzed to free nucleosides. DNA enrichments were measured by GC/MS. For the majority of samples, free nucleosides were derivatized to a pentane-tetraac-etate derivative for GC/MS analysis as described by Neese et al. (26), using selected ion monitoring of mass to charge (m/z). The isotopic enrichment of [2H]deoxyadenosine was determined by comparison with labeled standards.
research article
The fraction of labeled CD5+CD19+ cells, f, at each sampled time point was calculated as follows (26): f = cellular % 2H enrichment / (equilibrium serum % 2H2O enrichment ×A), where A is an empirically derived factor representing the degree of hydrogen atom exchange into deoxyribose during DNA repli-cation. This value was determined to be 3.5 when the pentane-tetraacetate derivative was used and 3.07 for the PFTA derivative.
2H2O equilibration correction. Total body 2H2O does not immediately reach the stable level maintained during the maintenance phase of the experiment. More significantly, 2H2O does not immediately return to zero during the washout phase. Modeling the body 2H concentration as a function of time, H(t), corrects for these delays. The 2 main physiologic parameters that affect the rate of equilibration and the equilibrium level are the patients’ total body water, Wbody, and the daily water turnover rate, Wday, including metabolic water. Wbody is estimated as 0.7 times the total body weight, as shown in Figure 1A. Wday determines the equilib-rium 2H2O value, since at equilibrium the percentage 2H2O enrichment,
Heq, is equal to the daily incoming percentage 2H2O. Since our protocol calls for the ingestion of 60 ml (0.06 l) of 70% 2H water per day, Heq = (0.06 × 0.7) / Wday. Because Heq was calculated for each subject from the percentage 2H2O enrichment and the 2H2O intake was known, Wday was calculable. The fractional daily water exchange, fw, was fw = Wday / Wbody. For patients whose body weight was not recorded (n = 6), a value of 6% was used (Supplemental Table 1).
For simplicity, a normalized body 2H2O concentration, h, was defined as h(t) = H(t) / Heq. The normalized percentage 2H2O of the loading, hload, maintenance, hmain, and washout, hwash, doses is then 3, 1, and 0, respec-tively, since the loading dose is triple the maintenance dose. The latter established equilibrium. The function h(t) was then modeled for each phase of the experiment using the differential equation for a well-mixed system, where the normalized incoming percentage 2H2O, hin, is 1 of the 3 values above h′(t) = fw(hin – h(t)).
The initial condition for the loading phase is zero, since there is no label at time 0 and the initial conditions for the maintenance and washout phas-es are the solutions to the equation of the previous phase. A reprphas-esentative plot of h(t) modeled from patients’ parameters is shown in Figure 1D.
Single-compartment model. The single-compartment model used to analyze data (26) is diagrammed in Figure 2A. The fractional birth, b, and death,
d, rates (in units of time–1) are assumed to be constant over the course of the study. The degree of cell labeling in newly born cells is equal to the percentage 2H concentration, the normalized units of h(t). Therefore, the rate of change in the number of labeled cells, L(t), is described by the dif-ferential equation L′(t) = h(t)bv(t) – dL(t), where v(t), the compartment size in number of cells, is defined by v′(t) = (b – d)v(t) to account for unequal birth and death rates. The fraction of labeled cells, f(t), is then L(t) divided by v(t), which solves to f(t) = h(t) + (f(0) – h(t))e–bt.
It should be noted that the d terms drop out and the function is therefore solely dependent on b. Because constant fractional birth and death rates are assumed, this equation is independent of any changes in compartment size but does not assume constant compartment size.
Two-compartment model. A 2-compartment mixture model was also devel-oped, as diagrammed in Figure 2B. Since no data were obtained from the nonvascular compartment, a steady-state assumption was made to allow the equations to be solved. All absolute rates are therefore equal. Since b is
defined as the fractional birth rate of the first compartment, the exchange rate will also be b and the death rate from the second compartment will be
b/vr, where vr is the relative sizes of the compartments defined as vr = v2/v1. The first compartment is described by the equations above such that
L1′(t) = h(t)bv1 – bL1(t) and f1(t) = e–bt[f1(0) + h(t)(ebt – 1)]. The change in labeled cells in the second compartment is then L2′(t) = bL1(t) – bL2(t)/vr. The frac-tion of labeled cells in the second compartment, f2(t), is L2(t) divided by v2, which solves to the following:
Equation 1
Since b is a fraction of the first compartment, the total clonal birth rate, B, is b/(1 + vr). The SE of B was calculated from the SEs of the first-compart-ment birth rate and relative compartfirst-compart-ment sizes obtained from the model-fitting software, using the following formula:
Equation 2
Model fitting and statistical analyses. Models were fit to the data using the Levenberg-Marquardt method of nonlinear regression as implemented in OriginPro version 7-SR4 (OriginLab Corp.) and GraphPad Prism version 4.01 (GraphPad Software Inc.). Equations supplied to the curve-fitting algorithm were derived from the equations listed above using Mathematica version 5.0 (Wolfram Research Inc.) and are shown in Supplemental Fig-ure 1. The input values, modeled parameters, and statistical values of the parameters are shown in Supplemental Table 1.
Acknowledgments
We thank Scott Orenstein for technical assistance and Ann Way for patient coordination. These studies were supported in part by the NIH via RO1 grants from the National Cancer Institute (CA81554 and CA87956) and by a General Clinical Research Cen-ter Grant (M01 RR018535) from the National CenCen-ter for Research Resources. The Peter J. Sharp Foundation, the Jean Walton Fund for Lymphoma and Myeloma Research, the Marks Family Founda-tion, the Joseph Eletto Leukemia Research Fund, the Tebil Foun-dation, the Horace W. Goldsmith Foundation Inc., and KineMed Inc., through an unrestricted gift, also provided support.
Received for publication September 20, 2004, and accepted in revised form December 20, 2004.
Address correspondence to: Nicholas Chiorazzi, Institute for Med-ical Research, North Shore–LIJ Health System, 350 Community Drive, Manhasset, New York 11030, USA. Phone: (516) 562-1001; Fax: (516) 562-1022; E-mail: nchizzi@nshs.edu.
1. Caligaris-Cappio, F., and Hamblin, T.J. 1999. B-cell chronic lymphocytic leukemia: a bird of a different feather. J. Clin. Oncol.17:399–408.
2. Granziero, L., et al. 2001. Survivin is expressed on CD40 stimulation and interfaces proliferation and apoptosis in B-cell chronic lymphocytic leukemia. Blood.97:2777–2783.
3. Ghia, P., and Caligaris-Cappio, F. 2000. The
indis-pensable role of microenvironment in the natural history of low-grade B-cell neoplasms. Adv. Cancer Res.79:157–173.
4. Dighiero, G., et al. 1991. B-cell chronic lymphocytic leukemia: present status and future directions. French Cooperative Group on CLL. Blood.78:1901–1914.
5. Dameshek, W. 1967. Chronic lymphocytic leukemia:
an accumulative disease of immunolgically incom-petent lymphocytes. Blood.29(Suppl.):566–584. 6. Chu, P., et al. 2002. Latent sensitivity to
Fas-mediated apoptosis after CD40 ligation may explain activity of CD154 gene therapy in chronic lymphocytic leukemia. Proc. Natl. Acad. Sci. U. S. A.
99:3854–3859.
het-erogeneity of human B-CLL lymphocytes between and within patients. Curr. Top. Microbiol. Immunol.
182:303–311.
8. Rai, K.R., and Patel, D.V. 1995. Chronic lymphocytic leukemia. In Hematology: basic principles and prac-tice. R. Hoffman, E. Benz, and S. Shattil, editors. Churchill Livingstone. New York, New York, USA. 1308–1321.
9. Damle, R.N., et al. 1999. Ig V gene mutation status and CD38 expression as novel prognostic indi-cators in chronic lymphocytic leukemia. Blood.
94:1840–1847.
10. Hamblin, T.J., Davis, Z., Gardiner, A., Oscier, D.G., and Stevenson, F.K. 1999. Unmutated Ig V(H) genes are associated with a more aggressive form of chron-ic lymphocytchron-ic leukemia. Blood.94:1848–1854. 11. Wiestner, A., et al. 2003. ZAP-70 expression
identi-fies a chronic lymphocytic leukemia subtype with unmutated immunoglobulin genes, inferior clini-cal outcome, and distinct gene expression profile. Blood.101:4944–4951.
12. Crespo, M., et al. 2003. ZAP-70 expression as a sur-rogate for immunoglobulin-variable-region muta-tions in chronic lymphocytic leukemia. N. Engl. J. Med.348:1764–1775.
13. Jelinek, D.F., et al. 2001. Analysis of clonal B-cell CD38 and immunoglobulin variable region sequence status in relation to clinical outcome for B-chronic lymphocytic leukaemia. Br. J. Haematol.
115:854–861.
14. Krober, A., et al. 2002. V(H) mutation status, CD38 expression level, genomic aberrations, and survival in chronic lymphocytic leukemia. Blood.
100:1410–1416.
15. Hamblin, T.J., et al. 2002. CD38 expression and immunoglobulin variable region mutations are independent prognostic variables in chronic lymphocytic leukemia, but CD38 expression may vary during the course of the disease. Blood.
99:1023–1029.
16. Ghia, P., et al. 2003. The pattern of CD38 expression defines a distinct subset of chronic lymphocytic leukemia (CLL) patients at risk of disease progres-sion. Blood.101:1262–1269.
17. Dohner, H., et al. 2000. Genomic aberrations and survival in chronic lymphocytic leukemia. N. Engl. J. Med.343:1910–1916.
18. Montserrat, E., Sanchez-Bisono, J., Vinolas, N., and Rozman, C. 1986. Lymphocyte doubling time in chronic lymphocytic leukaemia: analysis of its prog-nostic significance. Br. J. Haematol.62:567–575. 19. Molica, S., and Alberti, A. 1987. Prognostic value
of the lymphocyte doubling time in chronic lymphocytic leukemia. Cancer.60:2712–2716. 20. Simonsson, B., and Nilsson, K. 1980. 3H-thymidine
uptake in chronic lymphocytic leukaemia cells. Scand. J. Haematol.24:169–173.
21. Simonsson, B., Nilsson, K., Terenius, L., and Glime-lius, B. 1978. Biochemical characteristics of chronic lymphocytic leukaemia. Glucocorticoid receptors, B and T lymphocyte surface markers, concanavalin A-induced agglutination and thymidine incorpora-tion. Scand. J. Haematol.21:379–389.
22. Stryckmans, P.A., Debusscher, L., and Collard, E. 1977. Cell kinetics in chronic lymphocytic leukae-mia (CLL). Clin. Haematol.6:159–167.
23. Zimmerman, T.S., Godwin, H.A., and Perry, S. 1968. Studies of leukocyte kinetics in chronic lymphocytic leukemia. Blood.31:277–291. 24. Dormer, P., Theml, H., and Lau, B. 1983. Chronic
lymphocytic leukemia: a proliferative or accumula-tive disorder? Leuk. Res.7:1–10.
25. Schiffer, L.M., et al. 1969. Lymphocyte kinetics in chronic lymphocytic leukaemia (CLL) studied by ECIB. Br. J. Haematol.17:408.
26. Neese, R.A., et al. 2002. Measurement in vivo of proliferation rates of slow turnover cells by 2H2O labeling of the deoxyribose moiety of DNA. Proc. Natl. Acad. Sci. U. S. A.99:15345–15350.
27. Cheson, B.D., et al. 1996. National Cancer
Insti-tute-sponsored Working Group guidelines for chronic lymphocytic leukemia: revised guidelines for diagnosis and treatment. Blood.87:4990–4997. 28. Schmid, C., and Isaacson, P.G. 1994. Prolif-eration centres in B-cell malignant lymphoma, lymphocytic (B-CLL): an immunophenotypic study. Histopathology.24:445–451.
29. Pileri, S.A., et al. 2000. The pathologist’s view point. I. Indolent lymphomas. Haematologica.85:1291–1307. 30. Schiffer, L.M. 1968. Kinetics of chronic lymphocytic
leukemia. Ser. Haematol.1:3–23.
31. Themi, H., Trepel, F., Schick, P., Kaboth, W., and Begemann, H. 1973. Kinetics of lymphocytes in chronic lymphocytic leukemia: studies using con-tinuous 3H-thymidine infusion in two patients. Blood.42:623–636.
32. Plunkett, W., and Saunders, P.P. 1991. Metabolism and action of purine nucleoside analogs. Pharmacol. Ther.49:239–268.
33. Manaster, J., Fruhling, J., and Stryckmans, P. 1973. Kinetics of lymphocytes in chronic lymphocytic leukemia. I. Equilibrium between blood and a “readily accessible pool.” Blood.41:425–438. 34. Bazerbashi, M.B., Reeve, J., and Chanarin, I. 1978.
Studies in chronic lymphocytic leukaemia. The kinetics of 51Cr-labelled lymphocytes. Scand. J. Haematol.20:37–51.
35. Chandra, P., et al. 1979. Correlation of total body potassium and leukemic cell mass in patients with chronic lymphocytic leukemia. Blood.53:594–603. 36. Fais, F., et al. 1998. Chronic lymphocytic leukemia B
cells express restricted sets of mutated and unmutat-ed antigen receptors. J. Clin. Invest.102:1515–1525. 37. Chen, L., et al. 2002. Expression of ZAP-70 is
associat-ed with increasassociat-ed B-cell receptor signaling in chronic lymphocytic leukemia. Blood.100:4609–4614. 38. Macallan, D.C., et al. 1998. Measurement of cell