Essays in Financial Intermediation
by
Kuncheng Zheng
A dissertation submitted in partial fulfillment of the requirements for the degree of
Doctor of Philosophy (Business Administration) in The University of Michigan
2015
Doctoral Committee:
Professor Amiyatosh K. Purnanandam, Chair Professor Sugato Bhattacharyya
Professor Jeremy T. Fox Professor Uday Rajan
c
Kuncheng Zheng 2015
For my parents, Huanwei and Yanwei. This work is made possible by your love,
nurturing and guidance over the years. For my wife, Jia. This work is made possible
by your love, help, tolerance, and unrelenting positivity. For my children, Alexander
ACKNOWLEDGEMENTS
The author is indebted to his committee members Sugato Bhattacharyya, Jeremy
Fox, Uday Rajan, Christopher Williams, and especially Amiyatosh Purnanandam
(Chair) for their invaluable guidance and encouragement. I benefited from
discus-sions with Taylor Begley, Hendrik Bessembinder, Jonathan Carmel, Amy Dittmar,
Robert Dittmar, Stefan Nagel, Paolo Pasquariello, Sahil Raina, Amit Seru, Tyler
Shumway, Jeff Smith, Cindy Soo, Denis Sosyura, and Stefan Zeume. All the usual
disclaimers apply.
Chapter II of this dissertation is co-authored with my adviser, Amiyatosh
Pur-nanandam, and my former colleague in the PhD program, Taylor Begley. I have
benefited tremendously from their expertise.
Chapter III of this dissertation is co-authored with Hendrik Bessembinder and Jia
TABLE OF CONTENTS
DEDICATION . . . ii
ACKNOWLEDGEMENTS . . . iii
LIST OF FIGURES . . . vii
LIST OF TABLES . . . viii
LIST OF APPENDICES . . . ix
ABSTRACT . . . x
CHAPTER I. Bank Equity Capital and Risk-taking Behavior: The Effect of Competition . . . 1
1.1 Introduction . . . 1
1.2 Banking deregulations . . . 7
1.2.1 History of Banking Deregulations . . . 7
1.2.2 Effect of Banking Deregulations . . . 9
1.3 Data . . . 10
1.4 Empirical Results and Discussions . . . 12
1.4.1 Realized and Expected Risk . . . 12
1.4.2 Cause of Risk Reduction: Risk Preference or Lending Size? . . . 16
1.4.3 Lending Interest Rate . . . 19
1.4.4 Survivorship Bias . . . 22
1.5 How to Reduce Risk? . . . 23
1.5.1 Raise More Capital: Large Banks vs. Small Banks . 23 1.5.2 Commercial and Industrial Loans . . . 24
1.5.3 Improve Efficiency . . . 25
1.5.4 Robustness Checks . . . 25
II. The Strategic Under-Reporting of Bank Risk. . . 41
2.1 Introduction . . . 41
2.2 Research Design and Identification Strategy . . . 49
2.3 Data and Sample . . . 57
2.4 Results . . . 60
2.4.1 Value-at-Risk Exceptions Over Time . . . 60
2.4.2 Value-at-Risk Exceptions and Equity Capital . . . . 61
2.4.3 Identification Using the Shape of the Penalty Function 63 2.4.4 Cross-Sectional Variation in the Benefits of Under-Reporting . . . 66
2.4.5 Time Series Variation in the Benefits of Under-Reporting: Systemic Stress . . . 68
2.4.6 Bank Discretion and the Level of Reported Value-at-Risk . . . 70
2.4.7 Alternative Explanations & Robustness Tests . . . . 72
2.5 Conclusion . . . 77
III. Market Making Contracts, Firm Value, and the IPO Decision 90 3.1 Introduction . . . 90
3.2 The Related Literature . . . 94
3.3 The Model . . . 95
3.4 Model Outcomes with a Competitive IPO Market and Com-petitive Market Making . . . 98
3.4.1 Outcomes with Perfect Secondary Market Liquidity 98 3.4.2 Outcomes when the Secondary Market is Illiquid . . 99
3.4.3 Firm Choice and Social Welfare with Competitive Markets . . . 101
3.4.4 Why The Competitive Market Can Fail . . . 102
3.4.5 The Role of a DMM Contract . . . 103
3.4.6 Why the Increase in Value Exceeds the Required Payment . . . 105
3.4.7 Testable Implications and Discussion . . . 106
3.5 Partial Bargaining Power and Noncompetitive Market Making 109 3.5.1 Partial Bargaining Power in the IPO Market . . . . 109
3.5.2 The Effect of Possible Monopoly Power in Liquidity Provision . . . 114
3.6 Conclusion and Extensions . . . 117
APPENDICES . . . 123
A.1 Timing of Banking Deregulations . . . 124
A.2 Endogenous Deregulation? . . . 124
A.3 Variable Definitions . . . 126
LIST OF FIGURES
Figure
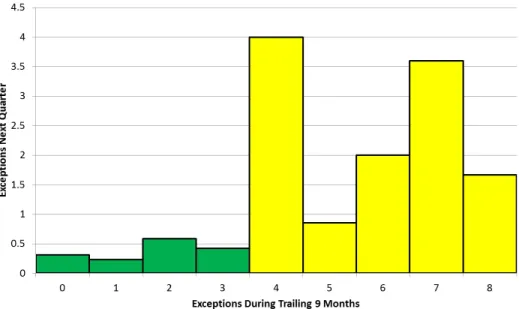
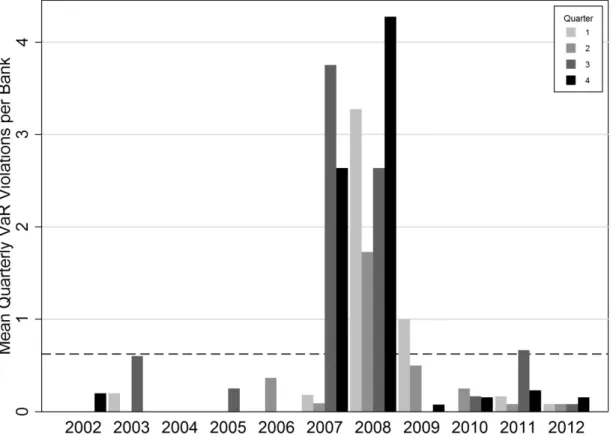
2.1 The Shape of Penalties . . . 54 2.2 Distribution of Value-at-Risk Exceptions . . . 64 2.3 Average Value-at-Risk Exceptions . . . 79 C.1 The Subjective Valuation of the Asset to the Investor at t=1 . . . . 144
LIST OF TABLES
Table
1.1 Summary Statistics . . . 31
1.2 Changes in Expected Lending Risk . . . 32
1.3 Changes in Realized Lending Risk . . . 33
1.4 Changes in Total Lending and Asset Risk . . . 34
1.5 Lending Interest Rate and Bank Performance . . . 35
1.6 Surviving and Failed Low-capital Banks . . . 36
1.7 Comparison of Large Banks to All Others . . . 37
1.8 Commercial and Industry Loans, Real Estate Loans and Operating Expense . . . 38
1.9 Changes in Capital Ratio and Dividend . . . 39
1.10 Changes in Lending Risk (with Determinants of Capital Ratio as Control Variables) . . . 40
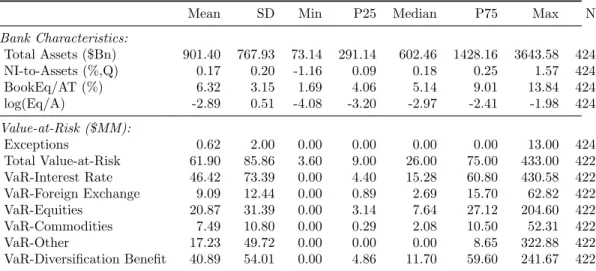
2.1 Base Sample Summary Statistics . . . 80
2.2 Sample Composition and Value-at-Risk Statistics . . . 81
2.3 Equity Ratio and Future Value-at-Risk Exceptions . . . 82
2.4 The Shape of Penalties, Equity Ratio, and Future Violations . . . . 83
2.5 Future Exceptions when VaR is a larger portion of Equity Capital . 84 2.6 Equity Ratio, Recent Returns, and Future Value-at-Risk Exceptions 85 2.7 Equity Ratio and Future Value-at-Risk Exceptions during Stress . . 86
2.8 Explaining the Level of Reported VaR . . . 87
2.9 Stale Model – Omitting Periods and Arellano-Bond Estimates . . . 88
2.10 Robustness Tests . . . 89
3.1 Notation . . . 121
3.2 Key Threshold Levels of δ and β . . . 122
A.1 Deregulation of Restrictions on Geographical Expansion . . . 127
B.1 VaR Exceptions and the Regulatory Multiplier . . . 128
LIST OF APPENDICES
Appendix
A. Bank Equity Capital and Risk-taking Behavior: The Effect of Compe-tition . . . 124
B. The Strategic Under-Reporting of Bank Risk . . . 128
ABSTRACT
Essays in Financial Intermediation
by
Kuncheng Zheng
Chair: Amiyatosh Purnanandam
This dissertation includes three essays about different aspects of financial
intermedi-ation. The first two essays look into bank risk-taking and risk reporting. The third
essay studies the merits of market making contracts.
The first essay examines how banks react differently to an increase in banking
market competition conditional on their ex ante capital ratio. Low equity capital
and credit market competition have been viewed as the main driving factors of bank
risk taking. To understand risk taking by banks, however, we need to understand
the interaction between the competition and the capital ratio. This essay studies the
impact of the capital (leverage) ratio on a bank’s risk-taking behavior. Using
deregu-lation in the 1980s as a shock to competition, I find that low-capital banks, compared
with their high-capital peers, significantly reduce their risk when facing increased
competition. This difference in risk-taking behavior between high- and low-capital
banks is a crucial factor to take into account when considering bank capital
While the first essay focuses on the risk-taking behavior of banks conditional on
their capital ratio, the second one looks into the reporting of risk by financial
insti-tutions. Current financial regulation requires banks to self-report the level of risk,
namely their Value-at-Risk (VaR), in their trading portfolio. This self-reported VaR
is linked to their capital requirements. If banks under-report their risk in the
cur-rent period, they are more likely to violate the self-reported risk levels and face the
penalty of higher capital requirements in future periods. In this essay, we show that
banks significantly under-report the risk in their trading book when they have lower
equity capital. Specifically, a decrease in a bank’s equity capital results in
substan-tially more violations of its self-reported risk levels in the following quarter. The
under-reporting is especially high during the critical periods of high systemic risk
and for banks with larger trading operations. We exploit a discontinuity in the
ex-pected benefit of under-reporting present in Basel regulations to provide a causal link
between capital-saving incentives and under-reporting. Our results provide evidence
that banks’ self-reported risk measures become least informative precisely when they
may matter the most.
Besides banks, market makers are another kind of financial intermediary, which
provide liquidity in the secondary stock market. The third essay uses a simple model
to examine the effects of secondary market liquidity on firm value and the decision
to conduct an Initial Public Offering (IPO). Competitive liquidity provision can lead
to market failure as the IPO either does not occur or its price is discounted to reflect
that some welfare-enhancing secondary trades do not occur. Market failure arises
when uncertainty regarding fundamental value and asymmetric information are both
large. In these cases, firm value and social welfare are improved by a contract where
the firm engages a Designated Market Maker (DMM) to enhance liquidity. Our model
in the IPO market due to information asymmetry in the secondary stock market,
particularly for small growth firms. In contrast, proposals to encourage IPOs by use
CHAPTER I
Bank Equity Capital and Risk-taking Behavior:
The Effect of Competition
1.1
Introduction
How does a bank’s equity capital affect its risk-taking behavior? This is a
fun-damental question in financial economics, with significant implications for ongoing
policy debates.1 It is argued that higher equity capital can limit excessive risk-taking behavior by banks, which in turn can have positive effects on corporate borrowers
and the economy as a whole.2 While a number of research papers in the prior lit-erature investigate the link between equity capital and risk-taking behavior, there is
scant evidence in the literature on how this relationship changes in the presence of
other potential risk-mitigating devices such as increased competition in the banking
industry. Competition, by itself, has been shown to alter the risk-taking behavior of
firms in both banking and non-banking industries. In fact, the role of competition
in banking has been studied extensively by earlier papers.3 But does higher compe-tition attenuate or exacerbate the risk-mitigating effect of higher capital? I answer
this question in my paper.
1SeeAdmati et al.(2011),Thakor (2014), for example.
2SeeBernanke and Blinder (1989) for theoretical evidence, andChava and Purnanandam(2011)
for empirical evidence.
The difficulty of studying the impact of competition on the relationship between
capital ratio and risk-taking is that competition and capital ratio are likely to be
endogenously related (Bolton and Scharfstein (1990)). To avoid this endogeneity
problem, I exploit the plausible exogenous changes in competition in the banking
industry caused by deregulations in the 1980s. I find that increased competition
can dampen the relationship between capital ratio and risk-taking. Said differently,
the negative relationship between capital ratio and risk-taking is weaker when the
banking industry is more competitive. This implies that raising the minimum capital
ratio requirement is more likely to have significant impact on risk-taking behavior in
a concentrated banking market.
Similar to bank capital ratio, competition is one of the important levers that have
been used to regulate the banking industry.4 It has been argued in the literature that higher competition can lead to higher risk-taking by firms. In a competitive banking
market, banks may lose a part of their franchise value, which in turn can increase
their risk-taking incentive (Keeley (1990)). The franchise values can come in the
form of access to subsidized deposits or to profitable lending opportunities. Banks
are more likely to lose these rents in competitive markets, and hence their risk-taking
incentives may be higher. Alternatively, competition may work as a disciplining
de-vice. For example, in a competitive market, banks need to be more prudent in their
risk-taking behavior in order to stay competitive in the long run. In fact,
compe-tition, as shown in Boyd and De Nicolo (2005), reduces the risk-taking incentive of
banks in the presence of agency problems between banks and their borrowers. Thus,
the effect of competition on the bank’s risk-taking behavior remains an empirical issue.
4For example, BASEL I, II, III, and the interstate banking and intrastate branching deregulations
Related to my work, there are a number of earlier theoretical papers that highlight
the intricate connections between competition, corporate leverage, and the firm’s
be-havior in different settings. A general theme of this literature is that the firm’s
prod-uct market strategy is jointly shaped by the competitive environments it faces and
its leverage ratio.5 In a recent paper, directly related to my work, Opp et al. (2014) analyze the efficacy of bank capital regulation in a competitive environment. They
derive predictions relating the level of competition to the effect of capital structure
on a bank’s risk-taking behavior. They show that it is not obvious that higher capital
requirements will limit the risk-taking behavior of banks. Depending on the nature of
competition the effect of capital structure on risk-taking behavior can go either way.
They argue that increased competition not only renders previously optimal bank
cap-ital regulations ineffective but also implies that, over some ranges, increases in capcap-ital
requirements cause more banks in the economy to engage in value-destroying
risk-shifting.
Overall, it can be argued that higher competition can work as either a substitute
or a complement for bank capital. Which force is at play and how much does it
matter? To answer this question, I empirically analyze the effect of equity capital
on risk-taking behavior of banks subsequent to the changes in the level of product
market competition in the 1980s. My empirical setting is based on the exogenous
variation in competition created by interstate and intrastate banking deregulations.
It is important to note the identification challenge faced by a study of this type.
Bank capital is likely to be determined jointly with the level of competition they face.
Hence my setting, which exploits a reasonable exogenous variation in competition,
5For example,Maksimovic(1988) shows that high leverage leads to more aggressive competition
in the product market, which is in line with the risk-shifting argument by Jensen and Meckling
(1976). In contrast,Bolton and Scharfstein (1990) argue that low leverage firms, with their “deep
pockets”, are the ones who compete more aggressively (high production and low markup) to deter entry.
provides several advantages for identification.
The banking deregulations that occurred between 1977 and 1994 significantly
en-hanced the openness and competitiveness of the banking market (Black and Strahan
(2002)). For example, after these deregulations, there were significant entries into
local banking markets (Amel and Liang (1992)), which led to a sharp increase (from
2% to 28% in a typical state) in the percentage of deposits held by subsidiaries of
out-of-state bank holding companies (Berger et al.(1995)). Besides leading to
reason-able exogenous change in competition, staggered implementation of deregulation in
different states in different years implies a reduced likelihood that comparisons before
and after deregulation are influenced by contemporaneous changes in market-wide
factors affecting the inferences of the relationship between the variables that I study.
Under the assumption that deregulation causes an exogenous change in
compe-tition, I analyze the dynamics of bank risk-taking. More specifically, I focus on the
risk on the asset side, of which lending risk is the main component.6 Following the literature, I use loan loss provision, charge-off, and non-performing loan ratios
as lending risk measures. I first confirm that, on average, lending risk significantly
decreases after deregulation, consistent with Jayaratne and Strahan (1998). I then
show that low-capital banks, compared with their high-capital peers, significantly
lower their lending risk after deregulation. They do so primarily by shifting to loans
with lower risk. This difference between high- and low-capital banks in risk-taking
behavior cannot be explained by pre-existing trends, geographical location, or other
bank characteristics, such as size, that may influence bank risk-taking. This result is
consistent with the argument that increased competition makes banks more prudent
in risk-taking. When competition is increased by the deregulation, the smaller capital
6The median ratio of total lending to total assets in my sample is 60%. The remaining 40% is
buffer makes low-capital banks more likely to fail compared with their high-capital
peers. To stay alive, one effective strategy is to reduce risk.
Instead of low-capital banks being prudent in a competitive environment, an
al-ternative explanation of their larger reduction in risk could be that low-capital banks
are out-competed by high-capital banks in the high risk lending market after
dereg-ulation. Hence, the larger reduction in risk by low-capital banks results from their
larger loss in lending market share. To rule out this possibility, I look into the
dy-namics of total lending volume and the ratio of total lending to total assets. I find
that changes in the total lending of low-capital banks are not significantly different
from those of high-capital banks. I also find, after controlling for the change in the
ratio of total lending to total assets, low-capital banks still have larger reductions
in risk. Hence, my results cannot be explained by changes in total lending or asset
re-allocation across loans and other assets.
To verify the robustness of my empirical finding, I use lending interest rate as an
alternative measure of risk. One of the important components of the lending interest
rate is the underlying project risk. If low-capital banks have a larger reduction in
lending risk, they should also have a larger reduction in the lending interest rate,
which is exactly what I find when analyzing the changes in lending interest rates.
Further, to rule out another potential alternative explanation that the larger
reduc-tion in risk is driven by low-capital banks’ underestimareduc-tion of lending risk, I show
low-capital banks have larger improvements in future performance relative to their
high-capital peers.
In summary, the overall decrease in risk-taking documented in this paper suggests
that high competition in the banking industry makes banks more prudent in their
risk-taking behavior. More notably, the larger reductions in risk-taking by low-capital
banks when facing increased competition suggest that competition can dampen the
relationship between bank capital ratio and risk-taking. This implies that, in a
com-petitive banking environment, the marginal effect of increasing capital ratio
require-ment might be less significant than that in a monopolistic banking environrequire-ment.
Therefore, when considering changes in the capital requirement, regulators should
take into account the competitive landscape in the banking industry.
The empirical findings in this paper also speak to the debate about risk-shifting
versus risk management. On one hand, the theory of asset substitution (Jensen and
Meckling (1976)) suggests that firms with low equity ratios have stronger risk-taking
incentives. On the other hand, it is also argued (Mayers and Smith Jr (1987) and
Froot et al. (1993)) that future funding and investment opportunities give low-equity
firms incentives to engage in risk management and risk reduction. In line with the
risk management argument, I show that low-capital banks reduce their risk-taking
when facing increased competition, suggesting that the incentive of risk management
outweighs that of risk shifting. This finding is consistent with the empirical evidence
documented in Rauh (2009) that firms with poorly-funded pension plans and weak
credit ratings allocate a greater share of pension fund assets to safer securities (see
also Purnanandam (2008)).
While the main analysis focuses on risk on the asset side, I do briefly look into
changes on the liability side. After both interstate and intrastate deregulations, on
average, banks have reductions in their equity ratios. However, these reductions are
mainly driven by banks with high capital before deregulation. Banks with low capital
after deregulation is mainly contributed by low-capital banks, changes in the capital
ratio in high-capital banks are unlikely to be the driving force of this decrease in risk.
The remainder of this chapter is organized into five sections. Section 1.2 reviews
the history of bank deregulations in the 1980s and their effect on local economies and
the banking industry. Section 1.3 describes the data and provides descriptive
statis-tics. Section 1.4 discusses empirical methods and presents empirical results. Section
1.5 discusses how banks reduce their risk when facing increased competition. Section
1.6 concludes.
1.2
Banking deregulations
1.2.1 History of Banking Deregulations
From the 1950s to the early 1970s, state statutes in the United States severely
restricted the ability of banks to expand across state borders or to branch within a
state. Beginning with the 1956 Douglas Amendment to the Bank Holding Company
Act, bank holding companies were prohibited from acquiring banks in other states
unless state regulations permitted such transactions. This amendment effectively
prohibited interstate bank mergers and acquisitions because no state allowed such
cross-state transactions.
Twenty-two years later, in 1978, Maine permitted out-of-state bank holding
com-panies (BHCs) to buy Maine banks. Following Maine, by 1992, all states but Hawaii
(Hawaii opted-in in June, 1997) had entered into interstate banking agreements with
other states. This period comprises the first wave of interstate banking deregulation.
de novo branches (establish new branches) or convert acquired in-state banks into
branches.
Another type of deregulation, intrastate branching deregulation, occurred at about
the same time as the first wave of interstate banking deregulations. In 1970 only 12
states allowed unrestricted intrastate branching. In the other 38 states, banks could
have either only branches within a 100-mile radius from their headquarters or no
branch at all. By 1994, all these 38 states and Washington, D.C. substantially
elim-inated restrictions on intrastate branching. These branching deregulations led to
significant entries into local markets via de novo branching (Amel and Liang (1992),
Calem (1994), andMcLaughlin (1995)).
The second wave of the interstate deregulation was triggered by the Interstate
Banking and Branching Efficiency Act 1994 (IBBEA), which allows banks and BHCs
to (i) acquire out-of-state banks and convert them into branches of the acquiring
bank (rather than holding the out-of-state bank as a separately chartered entity),
(ii) acquire a single branch or portions of an out-of-state institution to convert into
branches of the acquiring bank, and (iii) open de novo branches across state borders.
By the end of 1997 all states allowed interstate banking and branching.
Before IBBEA, most states allowed intrastate branching via merger and
acqui-sition and/or via de novo branch creation. The important change to emerge from
the IBBEA is permission for interstate branching. It is unclear how much marginal
effect is created by this interstate branching deregulation after the first wave of
in-terstate banking deregulation and the intrastate branching deregulation. Adoption
of the interstate branching deregulation occurred in a two-year window (from June
time period. This difference makes it hard to disentangle the impacts of changes in
competition and changes in macroeconomic environments.7 Therefore, in this paper, I do not include the interstate branching deregulation, but focus on the first wave
of interstate banking deregulation and the intrastate branching deregulation in the
period between 1976 and 1994.
The interstate banking and intrastate branching deregulations, as discussed in
Ja-yaratne and Strahan(1996, 1998) andKroszner and Strahan(1999), are mainly driven
by national and local forces. One force is the lobbying pressure from large banks.
These large banks asked for deregulation so that they can compete with national
banks. To mitigate this endogeneity issue and avoid the possible large money-centric
bank effect, I exclude banks in the top 5% of total assets before the deregulations.8
1.2.2 Effect of Banking Deregulations
Deregulating interstate banking, interstate branching, and intrastate branching
leads to significant changes in the banking industry, especially in credit market
com-petition. After deregulation, on one hand high rates of failures and mergers reduced
the number of stand-alone banks and bank holding companies. On the other hand,
high rates ofde novo entries increased the number of local banks. Berger et al.(1999)
document the number of US banks and banking organizations (stand-alone banks and
top-tier BHCs) fell almost 30% between 1988 and 1997. During this period, the share
of total nationwide assets held by the largest eight banking organizations rose from
22.3% to 35.5%. Despite the failures and consolidation activities, the average local
market deposit Herfindahl index (HHI) declined slightly over the period, falling about
4% for MSAs and about 5% for non-MSA counties. Total number of bank offices rose
7However, when using this interstate branching deregulation for robustness checks, I find weaker
but similar results.
8Please see Appendix for more discussion about the possible drivers of the deregulations and
by 16.8%. Similarly, Jayaratne and Strahan (1998) show that banking assets’
con-centration decreased after deregulation.
In terms of the effect of deregulation on the lending market, Black and Strahan
(2002) argue that regulatory changes in the banking industry enhanced the
open-ness and competitiveopen-ness of banking markets, which led to increases in efficiency and
new incorporations in local markets. Supporting this argument, Rice and Strahan
(2010) show stricter branching rules lead to higher lending interest rates.
Further-more, Jayaratne and Strahan (1996) document that although loan growth does not
change after deregulation, loan quality improves. For example, non-performing loans
decrease as much as 38% and as little as 12% of the unconditional mean after the
in-trastate branching deregulation. Similarly, Jayaratne and Strahan (1998) show that,
after the interstate banking is permitted, operating costs significantly decrease. Most
of the reduction in cost is passed along to the borrowers, indicated by a lower lending
interest rate.
In summary, the consensus in the literature is that deregulations led to an increase
in competitiveness within the banking industry. My findings support this consensus.
1.3
Data
The timings of interstate banking and intrastate branching deregulations since
1970 are listed in Table A1.1 in the Appendix.9 As shown in the table, depending on the state, intrastate branching deregulations happened before or after the
inter-state banking deregulations. The gap between the two deregulations varies from zero
(Tennessee) to more than 18 years (Vermont). This makes it possible to disentangle
the effects of the two deregulations.
All financial characteristics of banks in this study are from the Commercial Bank
Reports of Income and Condition (Call Reports). Chartered commercial banks must
file these public reports with bank regulators on a quarterly basis.10 The reports contain bank balance sheets, income statements (including loan loss provisions), and
other information. As mentioned in the last section, I exclude banks with total assets
in the top 5%11 to avoid a possible lobbying effect. By removing these large banks, I also alleviate the concern that large money-centric banks might have a different
business model than regional and local banks. After excluding the top 5% banks, the
full sample contains over 260,000 bank-year observations from 1976 to 1994. Table
1.1 Panel A reports the summary statistics of bank characteristics. The mean
equity-to-asset ratio is 8.12%. The 25th and 75th percentile book equity-equity-to-asset ratios are
7.0% and 9.9%, respectively. Table 1.1 Panel B reports the average risk measures
before and after deregulations. Consistent with Jayaratne and Strahan (1998), the
mean and loan loss ratios after deregulation are about 20% lower than those before
deregulation, while non-performing loan ratios are more than 50% smaller.
Bank Failures and Assistance Transactions (BFAT) data is from the FDIC’s
His-torical Statistics on Banking (HSOB). The HSOB provides bank failures and
assis-tance transactions data including event date, total deposits and total assets prior to
the event date, and estimated loss. Bank merger data is from the Bank Regulatory
Database in WRDS. This database covers all of the historical bank mergers in the US.
It provides not only the information about the surviving and non-surviving entities
of each merger, but also the reason for termination of the non-surviving entity. The
10Since all risk measures are based on variables reported as a year-to-date aggregation, I use
annual data in this study for convenience of analysis.
bank failure and merger data is used in regressions with duration models to address
potential survivorship bias.
I use the state coincident index provided by the Federal Reserve Bank of
Philadel-phia as a measure of the state economic environment in each state.12 The coincident index combines four state-level indicators, which include non-farm payroll
employ-ment, average hours worked in manufacturing, the unemployment rate, and wage and
salary disbursements deflated by the consumer price index (U.S. city average), to
summarize current economic conditions in a single statistic.
1.4
Empirical Results and Discussions
1.4.1 Realized and Expected Risk
In this paper, my main task is to identify the change of the relationship between
bank capital ratio and risk-taking behavior when competition in the banking sector
is increased. The null hypothesis is that there is no interactive effect of bank
capi-tal ratio and competition on the risk-taking behavior of banks. In other words, the
correlation between bank capital ratio and risk-taking should not change when
com-petition in the banking sector changes. My main alternative hypothesis is that the
effect of equity capital on risk-taking behavior changes when competition changes in
the banking market. More specifically, low-capital banks, relative to their high-capital
peers, either decrease or increase risk-taking when facing increased competition. As
mentioned earlier, theoretical models provide arguments for both an increase or a
decrease in risk-taking when facing increased competition.
Since bank capital and competition are likely to be jointly determined, estimates
from a naive regression of risk on the capital ratio, competition, and their interaction
suffer from an endogeneity problem. To properly identify the effect of competition
on the relationship between equity capital and risk-taking, I examine how banks with
different equity capital ratios react to changes in interstate banking and intrastate
branching deregulations by comparing their lending portfolio risk before and after
deregulation. I analyze the data with the following model:
Riskinessi,t =λ P osti,t+γ Equity Ratioi+θ(P osti,t×Equity Ratioi) +β Xi,t+αi+νt+i,t.
(1.1)
The dependent variable of this model,Riskinessi,t, measures the lending risk of bank
iin yeart. I use three measures of lending risk: net charge-offs, non-performing loans, and loan loss provisions scaled by the corresponding total loans and leases.
Charge-offs are the amount of un-collectable debt of a bank due to borrower defaults. This
can be taken as a realized risk measure. Instead of the total level of charge-offs, I use
net charge-offs to reflect the actual loss caused by defaults in a year. Non-performing
loans is also a realized risk measure. It is the sum of borrowed money upon which
the debtor has not made his or her scheduled payments for at least 90 days. In
con-trast, loan loss provisions are the expense set aside as an allowance for expected bad
loans (e.g., customer defaults or renegotiated loan terms). Being set aside, loan loss
provisions can be viewed as the ex ante expected risk of the lending portfolio.13
P osti,t is an indicator variable that equals one for all the years after deregulation of the state in which bank i operates, and zero otherwise. The coefficient on this
13Because the non-performing loan measure is not available before 1983, the discussion in the rest
of the paper will focus on charge-offs and loan loss provisions because they can be dated back to 1977. However, the coefficient estimates (as reported in Table 1.3) from the analysis on non-performing loans are consistent with those from analysis on charge-offs and loan loss provision.
variable, λ, captures the overall difference in bank riskiness before and after deregu-lation. Equity Ratioi is a time-invariant variable that measures the book equity ratio of bank i in the year immediately before the deregulation. This variable is absorbed by the bank fixed effects because there is only one equity ratio before the
deregu-lation for each bank. Equity Ratioi, however, is included in the interaction term
P osti,t ×Equity Ratioi because I am interested in how banks with different equity capital ratios before deregulation react to the deregulation. Using this equity ratio
before deregulation, I avoid the impact from possible endogenous change in current
period lagged equity ratio (equity ratio at the end of period t-1) on the estimates of
the interaction term. However, I do include current period lagged equity ratio as a
control variable (included inXi,t) to capture the effect of lagged equity ratio on risk-taking behavior. The coefficient, θ, on the interaction termP osti,t×Equity Ratioi is the estimate of interest. θ measures the marginal effect of theex ante capital ratio on the ex post change in lending risk. A positive θ indicates that, compared with their high-capital peers, low-capital banks reduce their lending risk after the deregulation.
Besides lagged equity ratio, lagged total assets (logged), and the state coincident
index are also included inXi,t. They account for the impact of bank size and state eco-nomic environment, respectively. αiandνtare bank fixed effects and year fixed effects, respectively. The fixed effects capture the impacts from unobserved time-invariant
firm characteristics and unobserved macroeconomic factors. I also cluster standard
errors at the bank level to address both heteroskedasticity and non-independence of
errors within firms across time.14
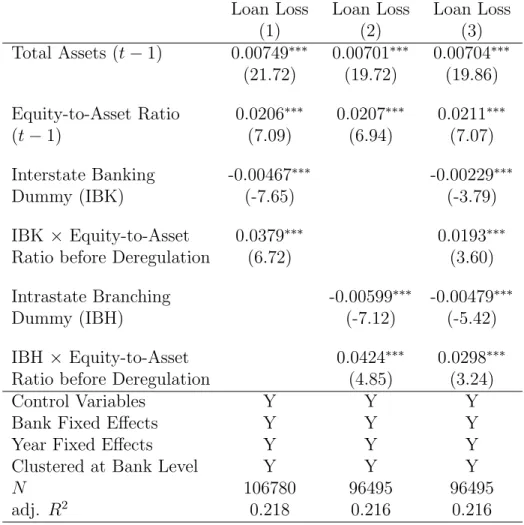
Results are provided in Tables 1.2 and 1.3. The dependent variables in Table
14In an unreported regression, I cluster at the state level to alleviate the concern about
non-independence of errors within states across time. And this state level clustering does not change the results.
1.2 are loan loss provisions to total loans and leases ratio. In models (1) and (2),
I examine the effect of either the interstate banking deregulation or the intrastate
branching deregulation, which means only one deregulation dummy and its
interac-tion with equity ratio before the deregulainterac-tion are included. In model (3), dummies
and their interaction terms of both deregulations are included. The dependent
vari-ables in Table 1.3 are charge-offs to total loans and leases ratio and non-performing
loans to total loans and leases ratio. In Table 1.3, similar to those in Table 1.2, there
is only one deregulation dummy and its interaction term in models (1) to (4), while
both dummies and their interaction terms are included in models (5) and (6).
As shown in Tables 1.2 and 1.3, the coefficient estimates on total assets are
neg-ative, which is consistent with the fact that larger banks are riskier because they
can diversify better. The coefficient estimates on the deregulation dummies are
sig-nificant and negative. This indicates that banks, regardless of their equity capital
ratios, reduce risk after the deregulation. More importantly, I find that the change
in competition has a significant impact on the relationship between a bank’s equity
capital ratio and its risk-taking behavior. In all the regressions reported in Tables 1.2
and 1.3, coefficients on the interaction terms between deregulation and bank equity
ratio are positive and significant, regardless of the choice of risk measure.
The positive significant estimates on the interaction terms, together with the
neg-ative estimates on the dummies, indicate low-capital banks have larger reductions
in lending risk when facing increased competition. This is consistent with the
hy-pothesis that low-capital banks become less risky when facing increased competition.
Besides being statistically significant, these effects are also economically significant.
For example, based on the estimates of the model (3) in Table 1.2, the coefficient
between this dummy and equity capital is 0.0298. This result implies that after the
intrastate branching deregulation, the loan loss ratio decreases by 27 basis points
(34% of the pre-deregulation mean, and 34% of the mean return-on-asset) for a bank
with a capital ratio at the 25th percentile (with capital ratio equal to 0.07), while the
loan loss ratio decreases by only 18 basis points (23% of the pre-deregulation mean,
and 23% of the mean return-on-asset) for a bank with a capital ratio at the 75th
percentile (with capital ratio equals to 0.10). Similarly, a bank with a capital ratio
at the 25th percentile has six basis points (8% of the mean) more decrease in loan
loss ratio than a bank with a capital ratio at the 75th percentile after the interstate
banking deregulation.
Overall, Tables 1.2 and 1.3 show significant reductions in mean charge-off ratio
and mean loan loss ratio after both deregulations; and the decreases are mostly driven
by banks with low capital ratios. For instance, the charge-off ratio and the loan loss
ratio of a bank with a capital ratio at the 25th percentile decrease by 23 and 27
ba-sis points (both are about 34% of their pre-deregulation means) after the intrastate
branching deregulation, respectively. The decrease in lending risk after the interstate
banking deregulation of a 25th-percentile bank is less but remains significant. In
contrast, the behavior of high-capital banks is ambiguous. The charge-off ratio and
loan loss ratio of a bank with capital ratio at the 75th percentile decrease after the
intrastate branching deregulation but remain unchanged after the interstate banking
deregulation.
1.4.2 Cause of Risk Reduction: Risk Preference or Lending Size?
In the previous section, I show the lending risk of low-capital banks, compared
results are consistent with the hypothesis that competition and low capital ratio make
banks less risky, there are a few alternative explanations. One is that the reduction
in risk of low-capital banks results from losing market share when facing increased
competition, as explained in the following paragraph. Another alternative
explana-tion is that banks are just re-allocating their assets into different categories without
changing their risk preference. More specifically, if low-capital banks want to increase
their loan-to-asset ratio while keeping their total asset risk unchanged, they need to
reduce lending risk because most non-loan assets are mainly low-risk assets, e.g. cash
and treasury bills.
To understand the first alternative explanation, let’s assume that banks carry out
their safest projects before moving on to riskier projects. Based on this assumption,
there would be a mechanical effect from change in total lending on lending risk. That
is, the larger the total lending, the higher the charge-off and loan loss ratios would be.
If low-capital banks are doing poorly and losing their shares in the risky loan market
after deregulation (as predicted inAllen et al.(2011)), these low-capital banks should
suffer a reduction in total lending. Because of the reduction in lending, despite
un-changed risk preference of banks, the riskiness still decreases. Therefore, a decrease
in charge-offs or loan loss provisions along with a reduction in total lending could
be the result of a loss in the lending market, and cannot be solely interpreted as a
decrease in risk preference.
To address this concern, I look into the dynamics of total lending of all banks. I
run regressions with the same setup as equation (1) with the level of total lending
and the lending-to-asset ratio as dependent variables. Results are shown in Table 1.4,
columns (1) and (2). The coefficient estimate on the interaction term between the
sig-nificant, implying that low-capital banks have relative increases, instead of decreases,
in their total lending level after the interstate banking deregulation. However, all
other coefficient estimates on the interaction terms suggest that there is no
signifi-cant difference between high- and low-capital banks in their changes of total lending
level and lending to total assets ratio. Therefore, my finding of a larger decrease in
lending risk of low-capital banks cannot be driven by a relative reduction in their
total lending because, as shown in Table 1.4, this relative reduction in lending does
not exist.
The second alternative explanation is that the larger risk reduction by low-capital
banks is driven by asset re-allocation among different asset categories, rather than a
change of their risk preference. If high-capital banks decrease their lending fraction
in total assets but want to maintain the total asset risk at the same level, they can
increase their lending risk. Or, if low-capital banks increase their lending fraction
but want to maintain the same asset risk level, they can reduce lending risk. One
implicit assumption of this alternative explanation is that the risk of the non-loan
assets is less than the loan-and-lease asset. Another assumption is that the risk of
the non-loan assets is more uniform across banks when compared with that of the
loan-and-lease assets. These assumptions are reasonable because cash and treasury
bills are the main components of the non-loan assets and they have low and similar
levels of risk across banks.15
To rule out this alternative explanation, I investigate changes in total asset risk.
If the total asset risk of the low-capital banks does not change or increase after
dereg-ulation, I cannot argue that they reduce their risk-taking. Because the risk of the
non-loan assets is not observable, based on the two implicit assumptions of this
al-15Most of the banks in my sample are small to medium banks that do not have any trading assets,
ternative explanation, I measure total asset risk with charge-off-to-total-asset ratio
and loan-loss-provision-to-total-asset ratio. With these ratios scaled by total assets
as proxies for asset risk, I use equation (1) to measure the changes in total asset risk.
Regression results are presented in Table 1.4, columns (3) and (4), which show that
low-capital banks have a larger reduction in charge-off-to-total-asset ratio and
loan-loss-provision-to-total-asset ratio than high-capital banks after deregulation. This not
only rules out the second alternative explanation, but also suggests that the purpose
of lending risk reduction is to decrease asset risk and improve survival probability.
In summary, regression results in Tables 1.2, 1.3, and 1.4 show that after taking
the dynamics of total lending and lending ratios into account, the risk of low-capital
banks decreases more than that of high-capital banks. I argue that this decrease in
risk can be attributed to a reduction in risk preference of low-capital banks when
facing increased competition.
1.4.3 Lending Interest Rate
In this section, using lending interest rate as an alternative measure of risk, I
pro-vide additional direct epro-vidence in support of the hypothesis that low-capital banks
reduce risk-taking more when facing increased competition. This provides additional
evidence that my results are robust to different measures of risk.
Lending interest rate is defined as a bank’s interest income divided by its total
loans and leases net of its bad loans. I remove the bad loans from total loans and
leases because non-performing loans do not generate interest income.16 Even though
16This method is similar to that used inJayaratne and Strahan (1998), except I remove the
non-performing loans from total loans and leases. However, regression results are similar if I keep the bad loans.
the interest rate is calculated from realized interest income, the interest rate is
de-termined when a bank enters a lending contract with a borrower. A risky borrower
is more likely to get a higher lending interest rate ceteris paribus. Therefore,
simi-lar to loan loss provisions, lending interest rate can be viewed as expected lending risk.
Again, I use equation (1) with lending interest rate as the dependent variable to
examine the ex post change in lending risk, conditional on the ex ante capital ratio.
The result is provided in Table 1.5, column (1). Similar to the main findings in Tables
1.2 and 1.3, there is an overall reduction in lending interest rate. And consistent with
my findings in earlier sections, the reduction is mainly driven by low-capital banks.
For instance, a 25th percentile capital bank, compared with its 75th percentile peer,
lowers its interest rate by 4 basis points more after the interstate banking deregulation.
While the results from the lending interest rate study are consistent with the
hy-pothesis that low-capital banks reduce their risk-taking when faced with increased
competition, perhaps the decrease in the interest rate is a result of an
underestima-tion of lending risk. If a low-capital bank underestimates the risk of its borrowers’
projects, we should observe low loan loss provisions and low interest rates from this
bank. Since the bank underestimates its lending risk, its realized lending risk should
be high unless its true lending risk is lower than that of other banks that do not
underestimate their lending risk. What the data show, however, is that low-capital
banks have larger reductions in both expected risk (loan loss ratio and lending interest
rate) and realized risk (charge-off ratio and non-performing ratio) after deregulation,
suggesting that the reduction in lending interest rate is driven by either a reduction
in risk alone, or a reduction in risk together with an underestimation of lending risk;
both are consistent with the hypothesis that low-capital banks reduce their risk more
To further investigate whether underestimation of risk leads to low interest rates, I
examine the changes in return-on-asset (ROA) and return-on-equity (ROE) of banks.
If a bank routinely underestimates its lending risk, it should have lower ROA and
ROE. When a bank underestimates its lending risk and charges low interest rates,
it is actually taking a lot of negative NPV projects because the risk adjustment is
too small due to the underestimation of risk. Table 1.5, columns (2) and (3)
pro-vide regression results from equation (1) with ROA and ROE as dependent variables.
The negative coefficient estimates on the interaction terms indicate that low-capital
banks have better improvement in performance, compared with high-capital banks,
ruling out the alternative explanation that the larger decrease in loan loss provisions
and lending interest rates of low-capital banks results from underestimation of their
lending risk. To avoid the mechanical effects of loan loss provisions on net income,17 I also examine gross return-on-asset (GROA) and gross return-on-equity (GROE). The
regression results are shown in Table 1.5, columns (4) and (5). Consistent with those
in columns (2) and (3), the coefficient estimates on the interaction terms are negative.
As shown in Table 1.5, there is a relative improvement in performance by the
low-capital banks. At first glance, this seems to contradict the larger reduction in
risk-taking by low-capital banks shown in Tables 1.2 and 1.3. Larger reductions
in risk-taking should also lead to larger reductions in performance ceteris paribus.
However, when a bank is reducing risk to survive, it is likely that this bank is also
taking other actions to improve its survival probability (for example, estimate lending
risk correctly and improve efficiency). These actions could be the drivers of the better
performance of low-capital banks. In fact, in Section 1.5.3, I find that low-capital
banks have a relative improvement in their efficiency.
1.4.4 Survivorship Bias
Based on the evidence presented in Tables 1.2 to 1.5, I argue that low-capital
banks reduce their risk when facing increased competition after deregulation. The
intuition of this argument is that the competition and low capital ratio together lead
to a higher probability of failure for low-capital banks. This threat of failure pressures
bank managers reduce their lending risk, which is a major component of the asset risk,
to increase the probability of survival. This intuition raises a natural concern about
survivorship bias. Because I can observe the behavior only of banks that survive, the
risk measures of both high- and low-capital banks are subject to survivorship bias. If
low-capital banks compared to high-capital banks are more likely to fail because of
their low capital ratio, the observed risk of low-capital banks suffers a more severe
survivorship bias than that of high-capital banks.
The survivorship bias, however, can be either downward or upward. On one hand,
if failed banks increase their risk after deregulation compared to the surviving ones,
actual risk should be higher than observed risk. In this case, survivorship leads to
a downward bias on the risk measures of low-capital banks. With the bias in the
same direction as the results in Tables 1.2 to 1.5, I would not be able to disentangle
the effect of risk reduction and the effect of survivorship bias. On the other hand, if
the failed banks relatively decrease their risk compared with the surviving ones, the
risk measures are biased upward. In this case, the survivorship bias goes against the
results in Tables 1.2 to 1.5.
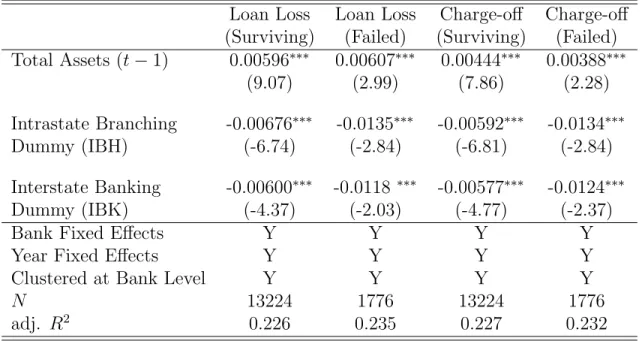
In order to find out the direction of the survivorship bias, I use the following
regression model.
In this model, equity ratio and its interactions with deregulation dummies are
ex-cluded because, as mentioned earlier, I focus on the lowest equity quartile. The
regressions are run separately on the surviving and failed banks to find out whether
their behaviors are different. The estimate of interest is λ. The regression results are presented in Table 1.6, which show that the failed banks do not increase their risk
compared with the surviving banks. This suggests that the survivorship bias is at
least not in the same direction as that of the results shown in Tables 1.2 to 1.5. In
other words, survivorship bias is not the reason we observe a larger reduction in risk
by low-capital banks.
1.5
How to Reduce Risk?
1.5.1 Raise More Capital: Large Banks vs. Small Banks
In previous sections, I show that low-capital banks reduce their lending risk when
competition is intensified after deregulation. I argue that this reduction is to counter
the increase in failure probability due to competition. Besides reducing lending risk,
another way to reduce failure probability is to increase the capital ratio. Even though
the literature documents that bank capital ratios are sticky,18 the ability to raise cap-ital is heterogeneous across banks. It is usually relatively easier for large banks to
raise capital. With better ability to raise capital, large low-capital banks, compared
with small low-capital banks, are less likely to reduce lending risk because they can
raise capital instead, when having the incentive to reduce risk. To demonstrate this
difference, I perform the same risk analysis on the top 5% banks excluded in earlier
analysis. Table 1.7 shows a comparison of changes in lending risk between the top
5% banks (columns (4) to (6)) and all other banks (columns (1) to (3)). The
gression results show that, among large banks, the difference in changes in lending
risk between high- and low-capital banks is not significant. This suggests small- and
medium-sized low-capital banks reduce their lending risk to counter the increase in
failure probability, while large low-capital banks can choose other mechanisms, e.g.,
increasing their capital ratio.
1.5.2 Commercial and Industrial Loans
So far I show that low-capital banks reduce their risk-taking when facing increased
competition. Going forward, it is important to understand how they reduce their risk
and improve their survival probability. I analyze the changes in the ratios of
com-mercial and industrial (C&I) loans and real estate loans to total loans and leases to
examine this problem.
C&I and real estate loans make up the majority (more than 60%) of the total
loans and leases of a bank. C&I loans, in general, are more risky than other loans.
In contrast, real estate loans are less risky because the underlying properties are held
as collateral.19 To analyze the dynamics of these loans, I use equation (1) with C&I loans and real estate loans to total loans and leases ratios as dependent variables. The
regression results are presented in Table 1.8, columns (1) and (2). They show that
low-capital banks reduce their C&I loan fraction but raise their real estate loan
frac-tion; low-capital banks shift their focus toward real estate loans, while high-capital
banks shift toward C&I lending. This difference in changes in lending focus is an
important driver for the larger reduction in lending risk of low-capital banks after
deregulations.
19According to data from Federal Reserve, the aggregate charge-off ratio of C&I loans in the US
is almost twice that of real estate loans during the period from 1985 to 1994 (data from pre-1985 is not available).
1.5.3 Improve Efficiency
Besides looking into changes in lending portfolios, I examine the changes in
ef-ficiency (proxied by expenditure-to-asset ratio). Because improving efef-ficiency is
an-other mechanism to increase probability of survival, I conjecture that low-capital
banks should become relatively more efficient when facing increased competition.
The regression result shown in Table 1.8, column (3) supports this conjecture. For
example, the coefficient estimate on the interaction between equity capital ratio and
the interstate banking deregulation dummy is 0.0762, indicating that the decrease in
the expenditure-to-asset ratio of a bank with a capital ratio at the 25th percentile is
3% (of the mean) more than that of a bank with a 75th percentile capital ratio. And
this 3% is also economically significant because it is equivalent to 28% of the mean
ROA, which explains why low-capital banks have larger improvement in performance
after deregulation as shown in Table 1.5.
1.5.4 Robustness Checks
Two of the risk measures I use in this paper are the charge-off ratio and the
non-performing loan ratio, which are based on the loan defaults in the current year.
Since the defaulted loans can be granted in the previous years, charge-off and
non-performing loan ratios are actually moving averages of the realized risk in all previous
years and the current year, instead of just the current year. Similarly, the loan loss
ratio and the lending interest rate include the risk of all existing loans instead of loans
issued in the current year only. To address this issue, I use bank fixed effects in my
regressions, which gives me changes in risk measures. The changes in risk measures
should be driven predominantly by the loans in the current year, which are better
representatives of the risk in the current year. To further address this problem, I
By creating this two-year gap, I reduce the fraction of risk from the pre-deregulation
period in the post deregulation observations, while keeping the majority (70%) of the
sample. Besides this two-year gap, I also use gaps of zero, one, and three years for
robustness checks. The outcomes remain the same as those with a two-year gap.
When using capital ratio as an independent variable, one assumption I make is
that equity capital cannot be immediately changed in response to the deregulation
shock. For example, let us assume low-capital banks increase their capital ratio and
become high-capital banks in response to deregulation, while high-capital banks do
not change their capital ratio. Following the assumption that high capital banks take
less risk than low-capital banks, we should observe that low-capital banks have a
larger reduction in risk after deregulation, and that the reduction is not driven by
their low capital before deregulation, but by their post-deregulation high capital ratio.
If the increased capital ratio after deregulation is the main driver of my findings,
we should observe a quick increase in the capital ratio of low-capital banks.
How-ever, this kind of rapid change in capital ratio is inconsistent with the empirical facts
documented in the existing literature. For example, Adrian and Shin (2010) and
Gropp and Heider (2010) show that bank capital ratios are sticky, and it is expensive
for banks to raise new capital.20 In addition, with lagged equity ratio as a control variable in the regressions, if my finding is actually driven by post-deregulation high
capital ratio, the estimates on the interactions would not be significant because the
reduction would be captured by the lagged equity ratio.
To further address this concern, I use a difference-in-difference model, similar to
20Various frictions can cause cost associated with raising equity. For example, Gennaioli et al.
(2013), attribute these costs to risk aversion on the part of households (while bankers are
risk-neutral). Baker and Wurgler (2013) find empirical evidence for the high cost of raising equity as
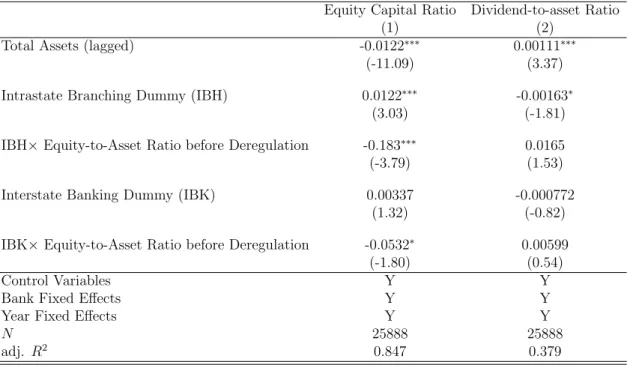
the one in Table 1.2, to determine the change in capital ratios after deregulation.
The dependent variable is equity capital ratio. Besides total assets, other possible
determinants of capital ratio (lagged ROA and collateral) are included as
indepen-dent variables.21 Lagged capital ratio is excluded because it can lead to inconsistent estimates. The regression results are presented in Table 1.9, column (1). The
esti-mates show there is a reduction in capital ratio after the intrastate deregulation. The
mean of the reduction is 0.183×0.0877−0.0122 = 0.0038, where 0.0877 is the mean capital ratio before the intrastate deregulation. However, this reduction is mainly
driven by high-capital banks. A bank with a capital ratio of 10% (75th percentile)
has a reduction of 0.61%, while a bank with a capital ratio of 7% (25 percentile) has a
reduction of 0.06%. Similarly, after the interstate deregulation, a bank with a capital
ratio of 10% (75th percentile) has a reduction of 0.20%, while a bank with a capital
ratio of 7% (25 percentile) has a reduction of 0.04%.
These results suggest that the larger reduction in risk by low-capital banks is
un-likely to be driven by changes in capital ratio, which are economically insignificant.
These results are also consistent with findings in the earlier analysis that low-capital
banks become more conservative than high-capital banks. Table 1.9 column (2) also
presents the regression result with dividend-to-asset ratio as the dependent variable.
Even though most estimates are not significant, the positive estimates on
deregula-tion dummies and negative estimates on the interacderegula-tion dummies suggest there is a
reduction in dividend after both deregulations mainly driven by low-capital banks.22 This, again, suggests that low-capital banks become more conservative after
deregu-lation.
21Possible determinants of capital ratio mentioned in the finance literature include market-to-book
ratio, size, profit, collateral, and dividend (Gropp and Heider (2010)). Since more than 95% of the
banks in my sample are private banks, market-to-book ratio and dividend of these banks are not available. Therefore, I include size, profit (proxied by return on assets), and collateral as control variables in the regressions.
Another robustness check I perform is to examine whether the larger reduction
by low-capital banks is driven by a reduction of capital ratio before deregulation.
If a bank planned to reduce risk-taking after deregulation, it could start lowering
its capital ratio before deregulation because it does not need that much buffer after
deregulation. To rule out this possibility, I redo the analysis with equity ratios two
or three years before the deregulation. I find similar results.
One more robustness check I do is to examine whether the observed larger
reduc-tion in risk-taking by low-capital banks is driven by the interacreduc-tion between
tition and a factor that determines the capital ratio, instead of that between
compe-tition and the capital ratio itself. Due to variable availability mentioned in footnote
21, I include size, profit (proxied by ROA), collateral, and their interactions with
deregulation dummies in my regressions.
The regression results are presented in Table 1.10. With all the possible
determi-nants of capital ratio and their interactions with deregulation dummies, the coefficient
estimates continue to indicate that low-capital banks exhibit a larger reduction in risk
when facing increased competition. In fact, the coefficient estimates on the
interac-tions between the capital ratio and the two deregulation dummies are both positive
and significant, while most of the estimates on other interactions are inconsistent.
For example, the coefficient estimates on the interactions between size and the
dereg-ulation dummies are positive, while only one of them is significant in each regression.
Similarly, the estimates on the interactions between collateral and the deregulation
dummies have opposite signs. The only possible determinant with consistent
esti-mates on both interactions is ROA. The estiesti-mates on the interactions of ROA and
per-formance is good, banks are likely to take on more risk. This, again, is consistent
with the risk management argument in the literature and my argument about why
low-capital banks have larger reduction in risk after deregulation.
One limitation of the analysis in this paper is that it relies on banks’ self-reported
risk measures. The inaccuracy of the risk measures can invalidate interpretation of
the results. For example, a reduction in reported risk from a bank can be due to
the bank’s under-reporting instead of a change in its risk preference. This concern is
mitigated to some extent by the non-performing loan measure, which accounting
liter-ature shows is hard to manipulate. Further, since I am using a difference-in-difference
method, my interpretation that low-capital banks have a larger risk reduction is still
valid unless low-capital banks under-report more than high-capital banks after
dereg-ulation.
Another limitation of this paper is that the analysis focuses on and speaks to
medium and small banks. Large banks (e.g., Citibank, Wells Fargo) not only have
much more complicated asset compositions, but also have different incentives when
facing competition because they are “too-big-to-fail.” However, medium and small
banks account for more than 40% of the assets in the banking industry. Therefore, it
is important to understand their risk-taking behavior.
‘
1.6
Conclusion
A number of theoretical models and empirical papers explore the linkage between
equity capital and risk-taking. It has been argued that lower levels of bank capital
can lead to increased risk-taking behavior (Jensen and Meckling (1976)). However,
risk-mitigating devices (e.g., increased competition in the banking industry) on this
relationship. In this paper, I empirically study how competition alters the
relation-ship between bank capital ratio and risk-taking behavior. By using banking
dereg-ulations in the 1980s as shocks to competition, I document that low-capital banks,
relative to their high-capital peers, significantly reduce their lending risk (reflected
by lower loan loss provision, charge-offs, non-performing loans, and lending interest
rates) when facing increased competition. Based on this empirical evidence, I argue
that high competition in the banking industry induces banks more prudent in their
risk-taking behavior. Low-capital banks engage in more risk reduction than their
high-capital peers because they are more likely to fail (Schmidt (1997)) in a
compet-itive environment.
The empirical evidence presented in this paper shows that low-capital banks take
significantly more risk when competition is absent, which implies competition can be
another mechanism to mitigate risk-taking. The empirical evidence also suggests that
competition can alter the relationship between bank capital ratio and risk-taking.
When regulators consider a higher minimum bank-capital requirement to mitigate
risk-taking, they should take into account the competitiveness of the banking sector
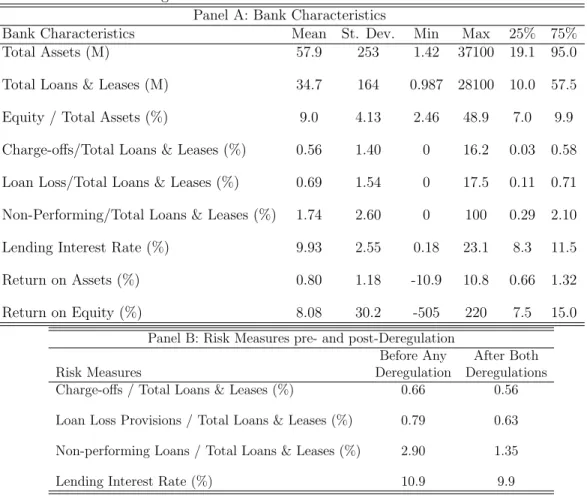
Table 1.1: Summary Statistics
This table presents summary statistics of bank characteristics in the sample. All sum-mary statistics in Panel A are calculated with all bank-year observations available between 1976 and 1994. The risk measures (loan loss provision ratio, charge-off ratio, non-performing loan ratio, and lending interest rate) before any deregulation and after both deregulations are presented in Panel B to show the difference in lending risk before and after the deregulations.
Panel A: Bank Characteristics
Bank Characteristics Mean St. Dev. Min Max 25% 75% Total Assets (M) 57.9 253 1.42 37100 19.1 95.0 Total Loans & Leases (M) 34.7 164 0.987 28100 10.0 57.5 Equity / Total Assets (%) 9.0 4.13 2.46 48.9 7.0 9.9 Charge-offs/Total Loans & Leases (%) 0.56 1.40 0 16.2 0.03 0.58 Loan Loss/Total Loans & Leases (%) 0.69 1.54 0 17.5 0.11 0.71 Non-Performing/Total Loans & Leases (%) 1.74 2.60 0 100 0.29 2.10 Lending Interest Rate (%) 9.93 2.55 0.18 23.1 8.3 11.5 Return on Assets (%) 0.80 1.18 -10.9 10.8 0.66 1.32 Return on Equity (%) 8.08 30.2 -505 220 7.5 15.0
Panel B: Risk Measures pre- and post-Deregulation
Before Any After Both
Risk Measures Deregulation Deregulations
Charge-offs / Total Loans & Leases (%) 0.66 0.56
Loan Loss Provisions / Total Loans & Leases (%) 0.79 0.63
Non-performing Loans / Total Loans & Leases (%) 2.90 1.35
Table 1.2: Changes in Expected Lending Risk
This table presents estimates from a difference-in-difference regression model:
Riskinessi,t =λ P osti,t+γ Equity Ratioi+θ(P osti,t×Equity Ratioi) +
β Xi,t+αi+νt+i,t.
The dependent variable,Riskinessi,t, is lending risk measured by loan loss provisions to total lending ratio, which can be viewed as expected lending risk. Equity Ratioi is a time-invariant variable that measures the equity ratio of bank i in the year before the deregulation. This variable is ab-sorbed by the bank fixed effects because there is only one equity ratio before deregulation for each bank; it is not shown in the table. P osti,t is an indicator variable that equals one for the year after the deregulation of the state where banki is located, and 0 otherwise. P osti,t×Equity Ratioi is the interaction term between deregulation dummy and equity ratio. Xi,t stands for a set of control variables. They include lagged total assets (logged), lagged equity-to-asset ratio, and state coincident index. αi and
νt are bank fixed effects and year fixed effects, respectively. Adjusted R-squared and number of observations are pr