1 Page 1-10 © MAT Journals 2017. All Rights Reserved
Lung Lesion Extraction Using Histogram Binning Based
Automatic Segmentation Approach
K. Vijila Rani, M. Mary Babitha
Department of ECE, Arunachala College of Engineering for women, Tamil Nadu, India E-mail:[email protected]
Abstract
Lung Lesion Extraction becomes the crucial part in the lung cancer diagnosis. The accurate segmentation of lung lesion from computerized axial tomography (CAT) scans is important for lung cancer diagnosis and research. A novel toboggan based growing automatic segmentation approach (TBGA) with a three-step framework is used for lung lesion segmentation. The initial seed point in the lung lesion was first automatically selected using an improved toboggan method for the subsequent 3D lesion segmentation. Then, the lesion was extracted by an automatic growing algorithm with multi constraints. Finally, the segmentation result was optimized by a lung lesion refining method. By using this lung lesion segmentation algorithm better performance will be obtained. The combination of TBGA and adaptive histogram binning, have similar or slightly better accuracy than previously obtained TBGA results on same-center training and evaluation. In conclusion, we believe that the novel HBBAS can achieve robust, efficient and accurate lung lesion segmentation in CT images automatically.
Keywords: Back-off mechanism, computed tomography (CT), lung lesion segmentation, region growing, toboggan, histogram binning.
INTRODUCTION
LUNG cancer is the leading cause of cancer mortality around the world [1]. Up to 10 million patients in the world will die of lung cancer by 2030 in terms of the report from the World Health Organization [2]. Early prevention of lung tumor has an important role for survival benefit improvements. With the hypothesis that deep analysis of radiographic images can inform and quantify the microenvironment and the extent of intra- tumoral heterogeneity for personalized medicine [3], [4], analysis of large numbers of image features extracted from computed tomography (CT) with high throughput can capture spatial and temporal genetic heterogeneity in a non-invasive way, which is better than invasive biopsy based molecular assays. It will be useful for research in medical field, CAD analysis, and surgery outcome evaluations as well. For this purpose, lung lesions accurate segmentation is the pre-requisite. One
method for lung abnormal tissue segmentation is that experts with experience such as delineate radiologists the lesion manually. It is a difficult task to obtain robust and efficient results because it needs human interaction. First, step is the experts may overestimate the lesion volume to enclose the whole lesion in the lung field. Then, the time consumption limits the converting Computed Tomography images to mineable data with high throughput. Therefore urgent requirement of highly robust, efficient and automatic lung lesion segmentation approach. The accurate segmentation of lung lesions by an automatic method is also difficult because the heterogeneity of the lung lesions. As shown in Fig. 1, due to the variation of lung lesions, current segmentation accuracy is not predictable. The lung lesions intensity is sometimes close to the intensity of vessels, fissures or chest wall (Fig. 1 a (1)–a (3)). But other words it is close to the intensity of lung
2 Page 1-10 © MAT Journals 2017. All Rights Reserved field, such as ground-glass opacity (GGO)
(Fig. 1 c(1)–c(3)).Then significant of the noise in CT images inherent .All these facts very challenging to achieve the precise delineation of lung lesions automatically.
Fig.1. Different types of lung lesions: (a1)-(a3): solid nodule, a (1): solitary nodule, a (2): juxta vascular, a(3): juxta-pleural, (b): cavity, (c1)-(c3): GGO. c(1): solitary, c(2): juxta-vascular, c(3): juxta-pleural. Related Work
Intensity-based segmentation [22], [21] is applied to the nodule segmentation problem by using two algorithms; they are local density maximum and thresholding algorithms.
Classes of these algorithms are primarily effective for solitary nodules; however, fail in separating the nodules from juxta posed surrounding structures, such as the pleural wall and Vas-cular, due to their intensities similarity.
For proposed more sophisticated approaches have to incorporate nodule-specific geometrical and morphological constraints issue to address (e.g. [23]– [24]). Abnormal tissue, nodules still remain a challenge because they can violate geometrical assumptions and frequently appear.
In addition, typical dose of low CT (LDCT) scans have low contrast, adding difficulties further to obtaining the nodule precise spatial support or ROI.
LESION SEGMENTATION WITH
MULTI CONSTRAINTS
Seed point is selected automatically in the lung lesion regions we obtained in section
.The multi-constraints are proposed to control the lesion segmentation.
As the intensity of vessels and visceral pleura is close to that of the lung lesion, they are sometimes considered to be part of the adjacent lesions.
In the process of lesion segmentation, a five-dimensional symbol vector is defined to describe the new lesion voxels in each generation (the meaning of the generation is same as that of the degree).
The vector is organized by spatial coordinates, iDegree and iCount of each voxel. As the basic flag of growing segmentation, iDegree describes the generation number during segmentation. The initial seed point is the first generation, where the iDegree is given as 1.
On the basis of the area of the lung lesion we have obtained by the improved toboggan algorithm, a largest distance constraint (LDC) is defined to restrict the growth in each direction during lesion segmentation. Its morphologic meaning is the maximum Euclidean distance between the center point and lesion boundary points. The LDC we use is calculated as follows:
Where is the size of the lung lesion region obtained by the improved toboggan algorithm.
Fig 2. Segmentation by the improved toboggan method, images a to l are solid nodules, and images m to r are
3 Page 1-10 © MAT Journals 2017. All Rights Reserved LUNG LESION REFINEMENT
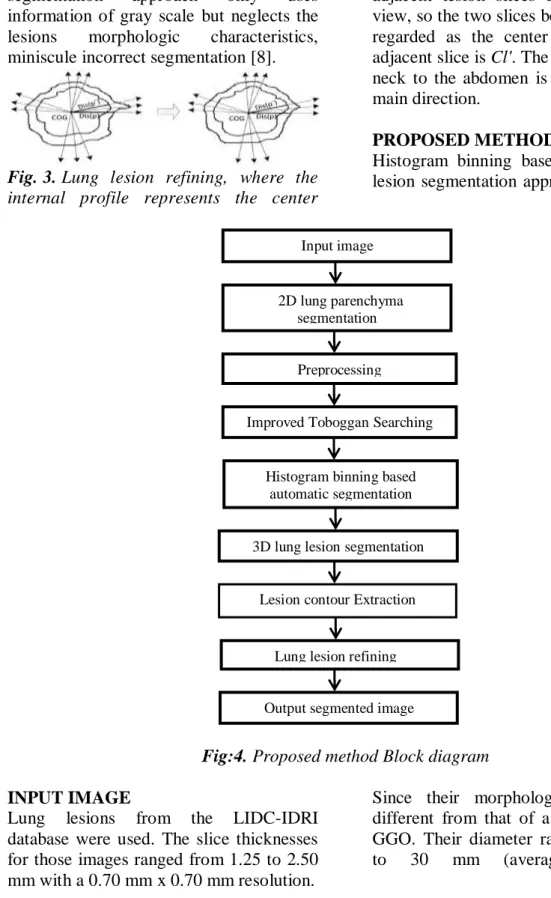
A refining method of lung lesion is used for more accurate boundary definition of lung lesion. Since the iterative growing segmentation approach only uses information of gray scale but neglects the lesions morphologic characteristics, miniscule incorrect segmentation [8].
Fig. 3. Lung lesion refining, where the internal profile represents the center
image, and the external one represents the adjacent slice.
The refining method only works on the adjacent lesion slices in a cross-section view, so the two slices being processed are regarded as the center slice Cl and its adjacent slice is Cl'. The direction from the neck to the abdomen is considered as the main direction.
PROPOSED METHOD
Histogram binning based automatic lung lesion segmentation approach is proposed.
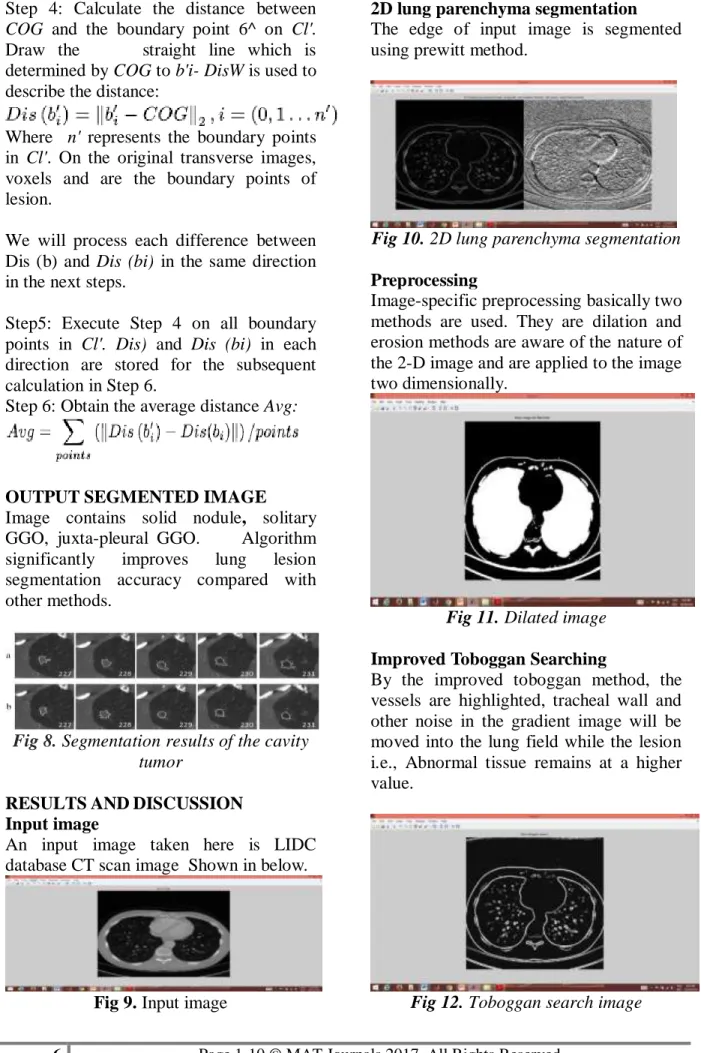
Fig:4. Proposed method Block diagram INPUT IMAGE
Lung lesions from the LIDC-IDRI database were used. The slice thicknesses for those images ranged from 1.25 to 2.50 mm with a 0.70 mm x 0.70 mm resolution.
Since their morphology is completely different from that of a solid nodule and GGO. Their diameter ranged from 3 mm to 30 mm (average 9.80 mm). Input image 22D lung parenchyma segmentation Preprocessing
Improved Toboggan Searching
Histogram binning based automatic segmentation
3D lung lesion segmentation
Lesion contour Extraction
Lung lesion refining
4 Page 1-10 © MAT Journals 2017. All Rights Reserved
Fig 5. LIDC database CT scan image
2D LUNG PARENCHYMA
SEGMENTATION
Process of partitioning a digital image into multiple segments (sets of pixels, also known as super-pixels) is called as image segmentation. The important goal of segmentation is to simplify change the image representation into something that is meaningful more and easier to
analyze.[12] Locate objects
and boundaries (lines, curves, etc.) in images are use the image segmentation.
PREPROCESSING
Image-specific preprocessing methods are aware of nature of the 2-D image and data are applied two-dimensionally. Dilation is the process of a binary (0/1, 'off'/'on') image can be expands in to a contiguous regions of 'on' pixels in an lung image. It examines the pixels neighboring within a 'Window' around each pixel. If specified fraction is more than('Threshold') of neighboring pixels are 'on' then dilation process is turns the pixel 'on'. Pixels which are 'on' already are never altered. The process of erosion of a binary (0/1, 'off'/'on') image contracts regions contiguous of 'on' pixels in an lung image. It examines the pixels neighboring within a specified 'Window'. If specified fraction is more('Threshold') of neighboring pixels are 'off' then turns the erosion of pixel 'off’. Already Pixels which are 'off' are never altered.
IMPROVED TOBOGGAN
SEARCHING
Multi-scale Gaussian convolution could reflect image gradient changes in
different directions. For example, different Gaussian convolution kernels could describe the gradient on each coordinate axis (X-axis, Y-axis or Z-axis) in and The multi-scale Gaussian gradient could also give a more accurate description for the lung image compared with other gradient computation methods. Besides, the highlighted noise would be eliminated by the improved toboggan algorithm after contrast enhancement using multi-scale Gaussian convolution.
Fig 6. Gradient image of lung parenchyma
By the improved toboggan method, the highlighted vessels, tracheal wall and other noise in the gradient image will be moved into the lung field while the lesion remains at a higher value. Therefore, the other tissues would be dimmed and the lesion could be enhanced in the label image for the subsequent automatic seed point selection.
Algorithm:
Step 1: Calculate the gradient image. Step 2: Scan the four neighborhoods (or eight) of each pixel in the gradient image. As one slice is enough for the selection of the lesion seed point.
Step 3: Mark the pixels slide to the local minimum by the same label with the ―minimum‖ pixel.
Step 4: Repeat the process for all pixels. If a pixel is not labeled, its four neighborhoods (or eight) will be searched to find the local minimum. The process is repeated until all pixels in the image are segmented.
5 Page 1-10 © MAT Journals 2017. All Rights Reserved
HISTOGRAM BINNING BASED
AUTOMATIC SEGMENTATION Histogram-based methods are very efficient compared to other segmentation of image methods because they typically require only one pass through the pixels basis. Color or intensity can be used as the measure.
Maintaining their single pass efficiency Histogram-based approaches can also be quickly adapted to apply to multiple frames. The histogram can be done in multiple fashions when multiple frames are considered. The same approach that is taken with one frame can be applied to multiple, and after the results are merged, peaks and valleys that were previously difficult to identify are more likely to be distinguishable. The histogram can also be applied on a per-pixel basis where the resulting information is used to determine the most frequent color for the pixel location. Bin counts, specified as a vector. Use this input to pass bin counts to histogram when the bin counts calculation is performed separately and you do histogram not wants to do any data binning.
The length of counts must be equal to the number of bins.
For numeric histograms, the number of bins is length (edges)-1.
For categorical histograms, the number of bins is equal to the number of categories.
Histogram bins means range interval of image pixel.
3D LUNG LESION SEGMENTATION Assumption that the neighboring pixels within one region have similar values is said to be a region growing algorithm. The common procedure is to compare one pixel with its neighbors.Pixels can be set to belong to the cluster as one or more of its neighbors similarity criterion is satisfied. The selection of the similarity criterion is significant.
LESION CONTOUR EXTRACTION AND LUNG LESION REFINING Abnormal tissue region are extracted.Lung lesion refining method is used for more accurate lesion boundary definition. Since the iterative growing segmentation only uses grayscale information but neglects the morphologic characteristics of the lesion, miniscule incorrect segmentation
Fig 7. The toboggan results for a cavity tumor.
In the two adjacent lesion slices In this section, those mutations will be smoothed for accuracy improvement. Here we use the lesion boundaries in each slice. The refining method in this paper only works on the adjacent lesion slices in a cross-section view, so the two slices being processed are regarded as the center slice Cl and its adjacent slice is Cl'.
The steps of the lung lesion refining method are described as follows:
Step1: Calculate the center of the gravity (COG, or a center point in the lesion) in Cl:
Where denotes the number of lesion pixels in and represents the coordinate of the lesion points.
Step 2: Extract the lesion contour
Step 3: Compute the distance between
COG and the boundary point 6* on Cl: Where \\h - COG\\2 means the two-norms
of (buCOG), and n is the total number of boundary points. Dis(bi) represents the Euclidean distance from bi to COG.
6 Page 1-10 © MAT Journals 2017. All Rights Reserved Step 4: Calculate the distance between
COG and the boundary point 6^ on Cl'. Draw the straight line which is determined by COG to b'i- DisW is used to describe the distance:
Where n' represents the boundary points in Cl'. On the original transverse images, voxels and are the boundary points of lesion.
We will process each difference between Dis (b) and Dis (bi) in the same direction in the next steps.
Step5: Execute Step 4 on all boundary points in Cl'. Dis) and Dis (bi) in each direction are stored for the subsequent calculation in Step 6.
Step 6: Obtain the average distance Avg:
OUTPUT SEGMENTED IMAGE Image contains solid nodule, solitary GGO, juxta-pleural GGO. Algorithm significantly improves lung lesion segmentation accuracy compared with other methods.
Fig 8.Segmentation results of the cavity tumor
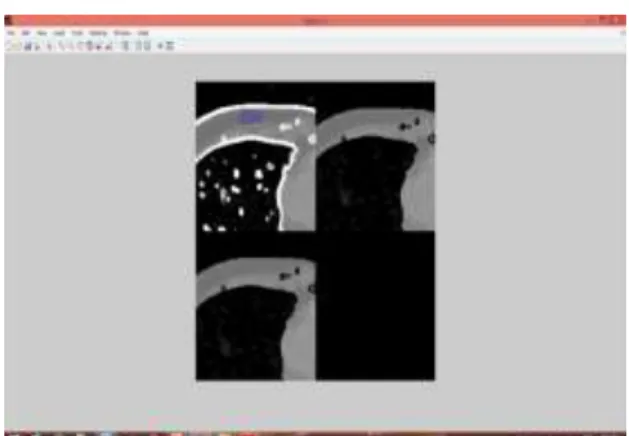
RESULTSANDDISCUSSION Input image
An input image taken here is LIDC database CT scan image Shown in below.
Fig 9. Input image
2D lung parenchyma segmentation The edge of input image is segmented using prewitt method.
Fig 10. 2D lung parenchyma segmentation Preprocessing
Image-specific preprocessing basically two methods are used. They are dilation and erosion methods are aware of the nature of the 2-D image and are applied to the image two dimensionally.
Fig 11. Dilated image Improved Toboggan Searching
By the improved toboggan method, the vessels are highlighted, tracheal wall and other noise in the gradient image will be moved into the lung field while the lesion i.e., Abnormal tissue remains at a higher value.
7 Page 1-10 © MAT Journals 2017. All Rights Reserved Histogram binning based automatic
segmentation
In this technique, a histogram is computed from all of the pixels in the gradient lung image, and the peaks and valleys in the histogram are used to locate the clusters in the image.
Histogram bins means range interval of image pixel.
Fig 13. Histogram bin segmented image
Segmentation single slice image Single slice of sensitive segmented image shown in below
Fig 14. Single slice image
3D lung lesion segmentation
One region growing method is the seeded region growing method. This method takes a set of seeds as input along with the image.
Fig 15.3D lung lesion segmentation image
Lung lesions including solid nodules
Image contains solid nodule, solitary GGO, juxta-pleural GGO.
Fig 16. Different types of lung lesion Lesion region of the cavity tumor
Abnormal tissue of lung is said to be cavity tumor that can be shown in below
Fig 17. Output segmented cavity tumor region
8 Page 1-10 © MAT Journals 2017. All Rights Reserved CONCLUSION
This paper explains about an automatic and quick-response lung lesion segmentation algorithm, which has been tested on the public LIDC database. The initial seed points were first detected using an improved toboggan method for the subsequent histogram binning lesion segmentation. Then, the lesion was extracted by an automatic growing algorithm with multi-constraints. Finally, the segmentation result was optimized by a lung lesion refining method. The important component of this work is that it does not require any training datasets or human interactions for lesion seed point detection, while it could obtain more accurate segmentation results compared with other methods, especially for ground-glass opacities. Better performance was obtained with improved time efficiency by our method.
FUTURE WORK
As the new method has a variety of advantages for the segmentation of lung lesions and can also be applied as a reference for lesion segmentation in other tissues. In the future classification of the lesions into benign and malignant to be done and calculation of the area and the size of the lesions using simpler algorithms will be addressed.
REFERENCES
1. R. Siegel, D. Naishadham, and A. Jemal, ―Cancer statistics, 2013,‖ CA Cancer J Clin, vol. 63, pp. 11-30, Jan. 2013.
2. W. H. Organization, ―Description of the global burden of NCDs, their risk factors and determinants,‖ Geneva, Switzerland: World Health Or-ganization, 2011.
3. H. J. W. L. Alerts, E. R. Velazquez, R. T. H. Leijenaar, C. Parmer, P. Grossmann, S. Cavalho, J. Bussink, R. Monshouwer, B. Haibe-Kains, Rietveld, F. Hoebers, M. M.
Rietbergen, C. R. Leemans, A. Dekker, J. Quackenbush, R. J. Gillies, and P. Lambin, ―Decoding tumour phenotype by noninvasive imaging using a quantitative radiomics approach.,‖Nat. Commun., vol. 5, p. 4006, 2014.
4. J. Song and C. Yang et al., ―A New Quantitative Radiomics Approach for Non-Small Cell Lung Cancer (NSCLC) Prognosis,‖ in presented at the Wind Int. Conf. Radiological Society of North America, Chicago, Illinois, November 29-December 04 2015.
5. M. Nakata, H. Saeki, I. Takata, Y. Segawa, H. Mogami, K. Mandai, and K. Eguchi, ―Focal ground-glass opacity detected by low-dose helical CT,‖ Chest, vol. 121, no. 5, pp. 1464-1467, 2002.
6. David S. Paik, Christopher F. Beaulieu, Geoffrey D. Rubin, Burak Acar, R. Brooke Jeffrey, Jr., Judy Yee,Joyoni Dey, and Sandy Napel“Surface Normal overlap: A Computer-Aided Detection algorithm With Application To Colonic Polyps And Lung Nodules In Helical CT‖, Volume 2, Issue 6, June 2004 , ISSN 2250-3153
7. D. M. Campos, A. Simoes, I. Ramos, and A. Campilho, ―Feature-Based Supervised Lung Nodule Segmentation‖, no. Ci, pp. 23-26, 2014.
8. D. Mahapatra, P. J. Schuf, J. a. W. Tielbeek, J. C. Makanyanga], J. Stoker, S. a Taylor, F. M. Vos, and J. M. Buhmann, ―Automatic Detection And Segmentation Of Crohn ' S Disease Tissues From Abdominal MRI,‖ IEEE Trans. Med. Imaging,vol. 32, no. 12, pp. 2332-2347, 2013.
9. E. M. Van Rikxoort, B. Lassen, M. Schmidt, S. Kerkstra, B. Van Ginneken,and J. M. Kuhnigk, ―Automatic Segmentation Of The
9 Page 1-10 © MAT Journals 2017. All Rights Reserved Pulmonary Lobes From Chest CT
Scans Based On Fissures, Vessels, Bronchi,‖ IEEE Trans. Med. Imaging, vol. 32, no. 2, pp. 210–222, 2013 10. E. a. Hoffman, S. Hu and J. M.
Reinhardt, ―Automatic Lung Segmen-tation For Accurate QuantiSegmen-tation Of Volumetric X-Ray CT Images,‖ IEEE Trans. Med. Imaging, vol. 20, no. 6, pp. 490^98, 2001.
11. Foster A. Mansoor, U. Bagci, Z. Xu, K. N. Olivier, and J. M. Elinoff et al., ―A Generic Approach To Pathological Lung Segmentation,‖ IEEE Trans Med Imaging, vol. 33, pp. 2293– 2310, Dec. 2014.
12. Jungian Song ―Lung Lesion Extraction Using A Toboggan Based Growing Automatic Segmentation Approach,‖ IEEE Trans Med Imaging, vol. 35, No 1,Jan. 2016. 13.J. H. Graham, and A. a Farag, H. E. A.
El Munim ―A Novel Approach For Lung Nodules Segmentation In Chest CT Using Level Sets.,‖ IEEE Trans. Image Process., vol. 22, no. 12, pp. 5202-5213, 2013.
14. J. Cornelis M. Tan, R. Deklerck, B. Jansen, M. Bister, ―A Novel Computer-Aided Lung Nodule Detection System For Ct Images,‖ Med. Phys., vol. 38, no. 10, p. 5630, 2011
15. M. Nakata, H. Saeki, I. Takata, Y. Segawa, H. Mogami, K. Mandai, and K. Eguchi, ―Focal ground-glass opacity detected by low-dose helical CT,‖ Chest, vol. 121, no. 5, pp. 1464-1467, 2002.
16.M. Athelogou, G. Schmidt, A. Schape, M. Baatz, and G. Binnig, ―Cognition Network Technology - A Novel Multimodal Image Analysis Technique for Automatic Identification and Quantification of Biological Image Contents,‖ Imaging Cellular and Molecular Biological Functions, pp. 407-422, 2007.
17.Q. Wang, E. Song, R. Jin, P. Han, X. Wang, Y. Zhou, and J. Zeng, ―Segmentation of lung nodules in computed tomography images using dynamic programming and multidirectional fusion techniques.,‖ Acad. Radiol., vol. 16, no. 6, pp. 678-688, 2009.
18. R. Siegel, D. Naishadham, and A. Jemal, ―Cancer statistics, 2013,‖ CA Cancer J Clin, vol. 63, pp. 11-30, Jan. 2013.
19. S. Candemir, S. Jaeger, K. Palaniappan, J. P. Musco, R. K. Singh, Z. Xue, A. Karargyris, S. Antani, G. Thoma, segmentation in chest radiographs using anatomical atlases with nonrigid registration,‖ IEEE Trans. Med. Imaging, vol. 33, no. 2, pp. 577-590, 2014.
20. S. Diciotti, G. Picozzi, M. Falchini, M. Mascalchi, N. Villari, and G. Valli, ―3-D segmentation algorithm of small lung nodules in spiral CT images.,‖ IEEE Trans. Inf. Technol. Biomed., vol. 12, no. 1, pp. 7-19, 2008.
21.C.Li, R. Huang, Z. Ding, J. C. Gatenby, D. N. Metaxas, and J. C. Gore, ―A Level Set Method For Image Segmentation In The Presence Ofin- Tensity Inhomogeneities With Application To MRI‖ ,IEEE Trans. Image Process., vol. 20, no. 7, pp. 2007-2016, 2011
22.B. Zhao, D. Yankelevitz, A. Reeves, and C. Henschke, ―Two-dimensional multi-criterion segmentation of pulmonary nodules on heli-cal CT images,‖ Med. Phys., vol. 26, no. 6, pp. 889–895, Jun. 1999.
23. W. J. Kostis, D. F. Yankelevitz, I. Henschke, ―Small pulmonary nodules: Reproducibility of three-dimensional volumetric measurement and estimation of time to follow-up,‖ Radiology, Vol. 231, pp. 446–52, May 2004.
10 Page 1-10 © MAT Journals 2017. All Rights Reserved M. Salganicoff, and A. Krishnan,
―Segmentation of pulmonary nodules of various densities with morpho-logical approaches and convexity models,‖ Med. Image Anal., vol. 15, no. 1, pp. 133–154, Feb. 2011.
25.J. P. Ko, H. Rusinek, E. L. Jacobs, J. S. Babb, M. Betke, G. McGuinness, and D. P. Naidich, ―Small pulmonary nodules: Volume measurement at chest CT—Phantom study,‖ Radiology, vol. 228, pp. 864–870, Sep. 2003.
26.S. Diciotti, G. Picozzi, M. Falchini, M. Mascalchi, N. Villari, and Valli, ―3D segmentation algorithm of small lung nodules in spiral CT Images,‖ IEEE Trans. Inf. Technol. Biomed., vol. 12, no. 1, pp. 7–19, Jan. 2008. 27.D. Wu, L. Lu, J. Bi, Y. Shinagawa,
K. Boyer, A. Krishnan, and Salganicoff1, ―Stratified learning of
local anatomical context for lung nodules in CT images,‖ in Proc. IEEE Conf. CVPR, Jun. 2010, pp. 2791– 2798.
28.B. Van Ginneken, ―Supervised probabilistic segmentation of pulmonary nodules in CT scans,‖ in Proc. 9th Int. Conf. MICCAI, Oct. 2006, pp. 912–919.
29.K. Okada, V. Ramesh, A. Krishnan, M. Singh, and U. Akdemir, ―Robust pulmonary nodule segmentation in CT: Improving performance for juxta pleural cases,‖ in Proc. 8th Int. Conf. MICCAI, Oct. 2005, pp. 781–789. 30.J. Dehmeshki, H. Amin, M.
Valdivieso, and X. Ye, ―Segmentation of pulmonary nodules in thoracic CT scans: A region growing approach,‖ IEEE Trans. Med. Imaging, vol. 27, no. 4, pp. 467–480, Apr. 2008.