U.S. Army Corps
of Engineers
Water Resources Support Center Institute for Water Resources
Empirical Studies of the
Effect of Flood Risk on
Housing Prices
The Corps of Engineers Institute for Water Resources (CEWRC-IWR) is part of the Water Resources Support Center in Alexandria Virginia. It was created in 1969 to analyze and anticipate changing water resources management conditions, and to develop planning methods and analytical tools to address economic, social, institutional, and environmental needs in water resources planning and policy. Since its inception, IWR has been a leader in the development of tools and strategies to plan and execute Corps water resources planning.
IWR's program emphasizes planning concepts for use by Corps field offices. Initially, this work relied heavily on the experience of highly respected planners and theorists, gained in the many river basin and multiple purpose studies undertaken in the 1960s. As these concepts matured and became a routine part of Corps planning, the emphasis shifted to developing improved methods for conducting economic, social, environmental, and
institutional analyses. These methods were essential to implementation of the Water Resources Council's (WRC) Principles and Standards (P&S) and later, Principles and Guidelines (P&G) for water resources planning, which required a multi-objective analysis of tradeoffs among national and regional economic development, environmental quality, and social effects.
Increasingly over the years, IWR has also responded to Corps program development needs by studying policy issues resulting from changes in national objectives and priorities. In addition to directly supporting Corps needs, IWR has established an analytic and strategic competence through the direction of such efforts as the National Drought Management Study, National Waterways Studies, the National Wetlands Mitigation Banking Study, the Federal Infrastructure Strategy, and as a lead participant in the development of policy and procedures for environmental planning and management.
Many of these forward-looking policy and strategic studies were accomplished by the Policy and Special Studies Division. The mission of the Division is to support the Director of Civil Works by assessing and evaluating changing national water resources and related public works infrastructure management needs as they affect Corps Civil Works missions, policies, practices, legislative mandates, and executive directives.
The Division supports the Office of the Assistant Secretary of Civil Works [OASA(CW)] and the
Headquarters, U.S. Army Corps of Engineers (HQUSACE) in analyzing current policy issues, and conducting special studies of national and international significance. The Division's work encompasses the following thematic areas:
& Policy Studies • Strategic Studies
& Special Studies • Environmental Studies
For further information related to the program, call either:
Dr. Eugene Stakhiv Mr. Kyle E. Schilling
Chief, Policy and Special Director, Institute for
Studies Division Water Resources
703-428-6370 703-428-8015
Department of the Army Corps of Engineers Water Resources Support Center Casey Building, 7701 Telegraph Road
Alexandria, VA 22315-3868
Reports may be ordered by writing (above address) Arlene Nurthen, IWR Publications, at [email protected] or by fax 703-428-8171.
Empirical Studies of the Effect of Flood Risk on Housing Prices
Institute for Water Resources
U.S. Army Corps of Engineers
Casey Building
Alexandria, VA 22315-3868
Prepared by
Philip T. Chao
James L. Floyd
William Holliday
Preface
The motivation for this study stems from criticism of the Corps of Engineers as being biased against non-structural flood damage reduction measures as opposed to structural measures (e.g., Interagency
Floodplain Management Review Committee, “Galloway Report”, 1994). One possible source of bias may be the inability of the Corps to economically justify permanent evacuation projects under current evaluation procedures given by the Principles and Guidelines for Water and Related Land Resources Implmentation Studies. This issue and the level of Corps involvement in permanent evacuation projects have become policy questions of increasing importance to the Corps.
During the course of this study, Congress enacted the Water Resources Development Act of 1996 (WRDA 96). Section 202(d) of the Act calls for the Secretary of the Army to identify “impediments that may exist to justifying nonstructural flood control measures as alternatives to structural measures.” The findings of this study will contribute to the full review called for in response to Section 202(d).
Acknowledgements
This study was conducted by Philip Chao, James Floyd and William Holliday of the Policy and Special Studies Division of the Institute of Water Resources (IWR). The report was prepared under the general supervision of Eugene Stakhiv, Chief of the Policy and Special Studies Division of IWR. Harry Shoudy and Jan Rasgus, Policy Development Branch, Policy Review and Analysis Division, Headquarters, Directorate of Civil Works, and Bob Daniel, Chief, Formulation and Evaluation Branch, Planning Division, Headquarters, Directorate of Civil Works, all provided valuable insights during the course of the study.
The authors would like to thank the following Corps of Engineers District staff for providing insight and data: Rebecca Griffith, Fort Worth District; Mitchell Laird, Louisville District; and, James Everman, Larry Workman, and Randy Campbell, Huntington District. We also acknowledge the contribution of the students who have worked on this study: Michael Hollar, Thomas Shoudy, and Renée Selinsky.
EXECUTIVE SUMMARY
The Principles and Guidelines for Water and Related Land Resources Implementation Studies (P&G) provide that “[R]eduction of flood damages borne by floodplain activities should not be claimed as a benefit of evacuation or relocation because they are already accounted for in the fair market value of floodplain properties.” The assumption is that primary flood damages are capitalized into the market value of
floodplain properties. Corps guidance for implementing the P&G explains further that “it would be double-counting to also consider the costs of the physical damages.”
The principal question this study addresses is: Can empirical evidence be found that flood damages
borne by flood plain activities are or are not capitalized into the fair market value of floodplain properties? Until now the Corps has not examined the empirical evidence or reviewed the academic
literature to answer this specific question.
Addressing this question is more involved than just comparing the actual price of a floodplain property to a hypothetical, otherwise identical, non-floodplain property. This study defines this difference as the discount for floodplain location. The discount for floodplain location, however, does not necessarily equate to discount for primary flood damages. The location discount represents the net effect of all attributes, positive and negative alike, associated with floodplain location which affect property value. Examples of positive attributes are access to recreational boating and river views. Negative attributes include clean-up costs and loss of income during a flood.
Hedonic price models are used to empirically measure a discount due to primary flood damages, separate from the discount for floodplain location. Hedonic price models describe the contribution of a property attribute to the overall price. The models are empirically assessed with multi-variate regression models where sale price is the dependent variable and the property attributes are the independent variables.
This study reviewed existing academic literature on hedonic price models of the floodplain real estate market. In addition, two hedonic price model cases were studied to answer some of the questions raised in the literature review. The case studies used price data from existing Corps projects in Abilene, Texas and South Frankfort, Kentucky.
Findings
Literature Review
None of the 13 reviewed studies attempted to directly search for evidence of a discount for primary
flood damages. Most of the studies attempted to detect a discount for location in the floodplain.
& Eight of the studies used a model that employed the variable of location in or out of the 100-year floodplain, without regard to where in the 100-year floodplain. Half of the eight studies show a discount for location exists, while half do not. These studies are inconclusive and expected to be so because this model implies that the flood risk is constant across the 100-year floodplain. Flood risk, and therefore any corresponding discount, will vary between properties deep in the floodplain and those just within the 100-year floodplain.
& The capitalized value of flood insurance premiums appears to be discounted from property values. All four studies that examined the effect of flood insurance premiums found property values discounted by the capitalized value of flood insurance premiums if the owners actually purchased
insurance (only about one-fourth actually do). None of these studies distinguished between subsidized and actuarial premiums.
& It is not clear whether consumers are risk averse or risk seeking. One study found that higher-income consumers may be more risk averse than lower-income consumers.
& Two studies addressed the value of positive floodplain attributes. Both found the value of positive attributes to be larger than the value of negative attributes (including the discount for flood damages).
& Three researchers studied property prices in the period following a flood. None found a discount in price over the long-term. One observed a drop in prices followed by a recovery, with the recovery being slower for houses with more frequent flooding.
Case Studies
The literature review suggested several hypotheses to test in the two case studies. However, since the case studies necessarily were limited to sources of available data, not all pertinent issues could be addressed. In particular, the effects of positive attributes could not be measured, and a detailed analysis of flood
insurance effects could not be undertaken.
The Abilene data set was analyzed for floodplain location discount by flood frequency zones (in increments finer than the 100-year zone), and for discount due to flood insurance premiums. Since expected damage data was not available, only the discount for floodplain location (and not for primary flood damges) could be analyzed. The results suggest that:
& Lower-priced houses (less than $50,000) deep in the floodplain (within the 25-year floodplain zone) are discounted. For other floodplain zones and price ranges, evidence of discount for location was weaker, and followed no trend.
& Flood insurance subsidies may lessen the floodplain location discount of lower-valued houses. & Since few higher-priced houses are located in the floodplain, it is unclear whether there is any
discount for such properties, or how flood insurance may influence prices on such houses Although the South Frankfort data set was too small (26 observations) to statistically measure a
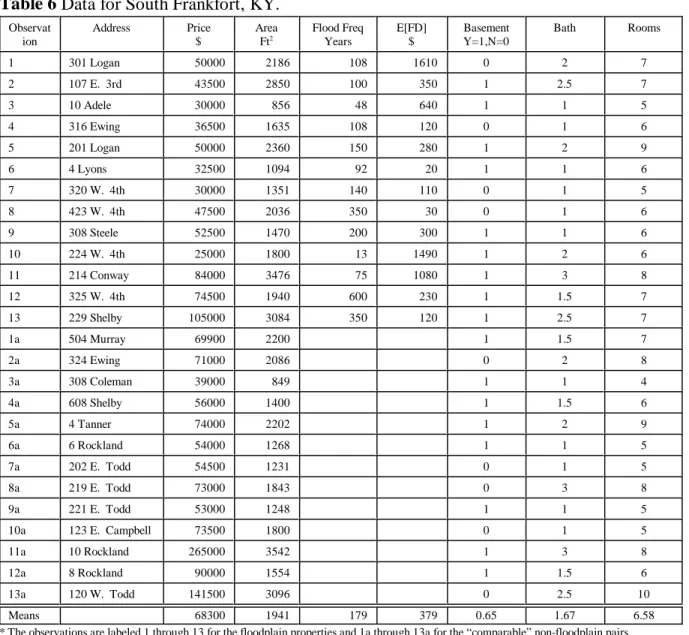
discount for location, data on expected primary damages were available such that a discount for primary flood damages could be analyzed with the hedonic price model. The results show that pricing behavior varies across the floodplain:
& For the three properties within the 100-year floodplain, the discount for location is proportional to, and roughly the same as, the present worth of expected primary damages.
& For the seven properties outside of the 100-year floodplain, but flooded above the first floor in 1978 (a 150-year flood, sales were between 1989 and 1991), the discount for location varied greatly and, was generally greater than expected primary flood damages.
& Three other properties that only had their basements flooded in 1978 showed no discount for location.
A plausible explanation (no insurance data was available) for the difference between the properties within and outside of the 100-year floodplain is that the three homeowners in the 100-year floodplain were required to have flood insurance, and therefore had a clearer understanding of the potential cost of flooding.
Conclusions
The findings from the literature review and the case studies are insufficient to conclude that flood damages borne by floodplain activities either are or are not capitalized into the fair market value of floodplain properties. The existing studies did not seek and the case studies lacked sufficient data to detect a discount for primary flood damages. In some cases a discount for location in the floodplain was not detected. In others, a discount for floodplain location does exist, but varies because of a complex interaction of socio-economic and flood risk factors, such as relative location within the floodplain, flood insurance, flood history and positive floodplain attributes. This complexity limits the possibility of identifying specific conditions for when a discount for primary damages either exists or does not exist.
The variability of these factors across floodplain markets around the country makes the assumption that
all properties are discounted for primary flood damages unreasonable. The assumption that all consumers are
fully aware of the flood risk and are risk neutral is not supported by the findings. Although the simplifying assumptions are meant to facilitate project evaluation, in the cases where there is no discount, the benefits of permanent evacuation projects are underestimated.
Although recommendations to improve hedonic price models to detect a discount for primary flood damages are possible based on the findings, it may not be fruitful to pursue such studies further. The
foremost issue is including positive and negative attributes of floodplain properties in the hedonic price model to separate the discount due to primary flood damages from the discount due to floodplain location.
Identifying and measuring all these floodplain attributes is exceedingly difficult. The researcher is hard pressed to identify all the attributes that property buyers consider when purchasing a floodplain property. Even if all the attributes were identified, they remain to be measured. Since these attributes are not traded explicitly on the market, their value must be indirectly assessed with methods such as hedonic price models or the contingent valuation method. Such studies would be expensive and time-consuming because original data surveys would be required. Even if the attributes were measured, several case studies would have to be conducted to establish general conditions for when there is or is not a discount for primary flood damages. Even if several case studies were conducted, their results still may be inconclusive.
Policy Implications
The findings suggest that greater effort be devoted to analyzing the theoretical and institutional bases for the relevant policies rather than focusing on an empirical basis for justifying the benefits of structural flood protection versus permanent evacuation. The Corps should not expend resources for investigations of the capitalization of flood damages into market values of floodplain properties, either as part of a research project or as part of feasibility studies for flood damage prevention projects.
TABLE OF CONTENTS
Chapter 1 - Introduction . . . 1
1.1. Problem Definition . . . 1
1.2. Study Objective . . . 3
1.3. Study Approach . . . 3
Chapter 2 - Economic Model and Literature Review . . . 5
2.1 Introduction . . . 5
2.2 Hedonic Price Models . . . 6
2.3 Literature Review . . . 9
Chapter 3 - Case Studies . . . 15
3.1 Introduction . . . 15
3.2 Abilene, TX . . . 15
3.3 South Frankfort, KY . . . 24
Chapter 4 - Findings, Conclusions and Policy Implications . . . 31
4.1 Findings . . . 31
4.2 Conclusions . . . 32
4.3 Policy Implications . . . 33
References . . . 35
Appendix A Summaries of Reviewed Literature . . . 37
LIST OF TABLES
1. Guide to Types of Benefits. . . 2
2. Corps Permanent Evacuation Projects (USACE, 1994) . . . 3
3. List of Hedonic Price Studies on Impact of Flood Risk on Floodplain Property Values. . . 10
4. Summary Statistics from Abilene Data. . . 21
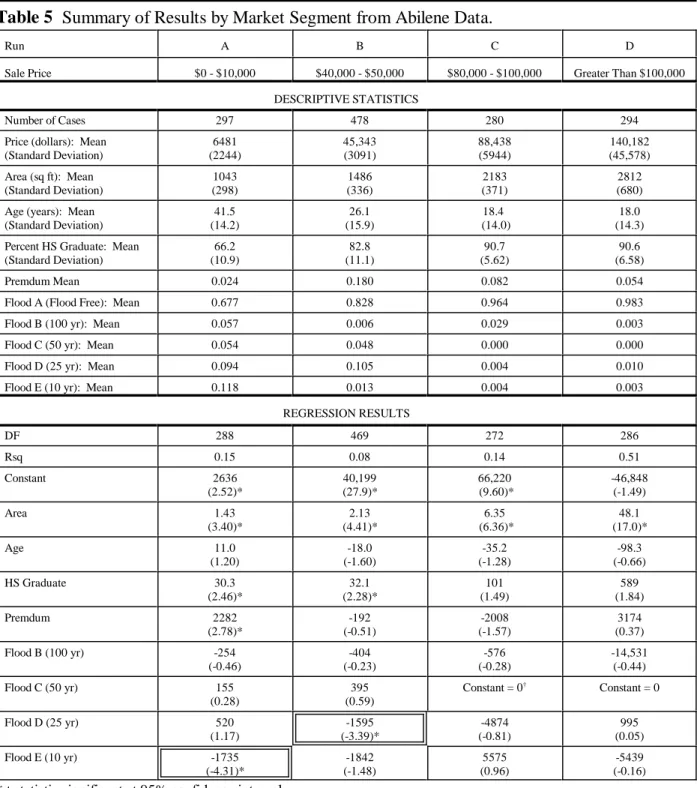
5. Summary of Results by Market Segment from Abilene Data. . . 23
6. Data for South Frankfort, KY. . . 26
LIST OF FIGURES
1. Number of Observations by Floodplain Zones . . . 17
2. Sale Price by Floodplain Zones . . . 18
3. Area by Floodplain Zones . . . 18
4. House Age by Floodplain Zones . . . 19
5. Sale Price by House Age . . . 20
6. Insurance Premium by Age . . . 20 7. Ratio of P to P for South Frankfort, KY . . . 29L D
Chapter 1 - Introduction
1.1. Problem Definition
The Principles and Guidelines for Water and Related Land Resources Implementation Studies (P&G) provide that “[R]eduction of flood damages borne by floodplain activities should not be claimed as a benefit of evacuation or relocation because they are already accounted for in the fair market value of floodplain properties.” The assumption is that primary flood damages are capitalized into the market value of floodplain properties. Corps of Engineers guidance for implementing the P&G explains further that “it would be double-counting to also consider the costs of the physical damages.”
The principal question this study addresses is: Can empirical evidence be found that flood damages
are or are not capitalized into the fair market value of floodplain properties? Until now the Corps has not
examined the empirical evidence or reviewed the academic literature to answer this specific question. The report does not address the corollary question, if in fact expected damages are capitalized into market values, as to whether or not claiming primary damages prevented as benefits of permanent evacuation projects would constitute double counting. The study is limited to review and analysis of existing literature and available data only.
Nonstructural flood damage reduction measures are those which “modify damage susceptibility by altering the ways in which people would otherwise occupy and use floodplain lands and waters” as opposed to structural measures which “modify flood behavior” [ER 1105-2-100]. Nonstructural approaches include:
& permanent evacuation and relocation
& floodproofing (including raising the elevation of the structure) & land use management
& flood warning and preparedness & flood insurance
& emergency flood fighting and financial relief.
This study focuses on permanent evacuation projects. Evacuation is accomplished in a number of ways. The structure can be acquired and razed, with the occupant seeking alternative housing, either through the open market or in a new flood free building built as part of the flood damage reduction project. Alternatively, the structure itself can be moved to a location outside the floodplain. The move can be done by or for the original occupant, or the building may be re-occupied by someone else.
According to the P&G, there are three types of benefits for flood damage reduction projects: i) inundation damage reduction, ii) intensification (of the existing land use), and iii) location (changes in land use). Table 1, which is reproduced from the P&G, lists the types of benefits by type of project, indicating which types are claimable or not claimable. Primary flood damages (expected annual damages),
The P&G says that Table 1 applies generally, but its application may vary in specific cases (p. 38). 1
Some of these projects (for example, Prairie du Chien, completed in 1984) were developed prior to 2
promulgation of the P&G in 1983. Prior to that time there was no exclusion of primary flood damages as a project benefit.
Type of Benefit Structural Floodproofing Evacuation
Inundation:
Incidental flood damages Claimable Claimable Claimable
Primary flood damages Claimable Claimable Not claimable
Floodproofing costs reduced Claimable Not claimable Not claimable Reduction in insurance overhead Claimable Claimable Claimable Restoration of land value Claimable Claimable Not claimable
Intensification Claimable Claimable Not claimable
Location:
Difference in use Claimable Claimable Not claimable
New use Not claimable Not claimable Claimable
Encumbered title Not claimable Not claimable Claimable
Open space Not claimable Not claimable Claimable
Table 1 Guide to Types of Benefits [P&G, Table 2.4.14, p. 38].
floodproofing costs reduced and restoration of land value (lowered land values due to the intangible costs of flood hazard) may not be claimed as benefits of permanent evacuation projects.1
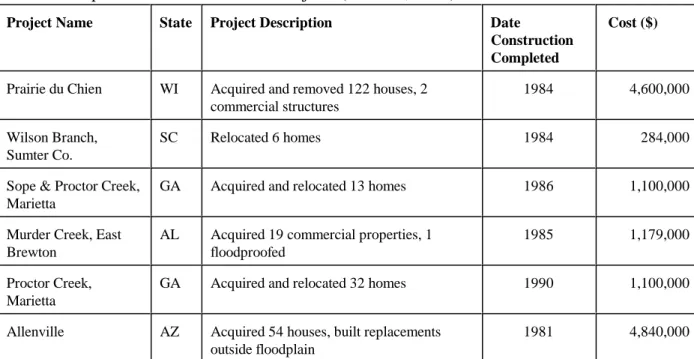
Partly because primary flood damages are excluded as a benefit for evacuation projects, such projects are seldom economically justified based on P&G procedures. The Corps has built hundreds of structural FDP projects, but, as of 1994, had completed only six projects using purely evacuation or using evacuation with other nonstructural measures (Table 2). The Corps has also, on occasion, accomplished permanent2
evacuation as part of structural projects. The scarcity of permanent evacuation projects has been cited as evidence of a bias against them.
Project Name State Project Description Date
Construction Completed
Cost ($)
Prairie du Chien WI Acquired and removed 122 houses, 2 commercial structures
1984 4,600,000
Wilson Branch, Sumter Co.
SC Relocated 6 homes 1984 284,000
Sope & Proctor Creek, Marietta
GA Acquired and relocated 13 homes 1986 1,100,000
Murder Creek, East Brewton
AL Acquired 19 commercial properties, 1 floodproofed
1985 1,179,000
Proctor Creek, Marietta
GA Acquired and relocated 32 homes 1990 1,100,000
Allenville AZ Acquired 54 houses, built replacements outside floodplain
1981 4,840,000
Table 2 Corps Permanent Evacuation Projects (USACE, 1994)
*Note: Does not include projects in the Tug Fork and Upper Cumberland Basins, WV and KY, which are *
being developed under special legislation which waives economic justification
1.2. Study Objective
The objective of this study is limited to a search for evidence that expected annual flood damages borne by flood plain activities are or are not capitalized into the fair market value of floodplain properties. The secondary objective is to identify the conditions under which the discount in market value does not exist, such that at least in those cases it may be justifiable to claim primary flood damages as a benefit in evaluating permanent evacuation projects.
These objectives are approached empirically. A theoretical approach, which would examine the
economic rationale embodied in the P&G, is not used here, as the theory and assumptions of the P&G will be not be challenged directly. If the expected discount cannot be found or is empirically small either in general (applicable in all cases), or under specific, restricted conditions, then a basis for claiming primary damage benefits would have been found. If restricted, primary flood damage benefits could be claimed where those specific conditions exist.
1.3. Study Approach
The first phase of this study reviewed the economic theory underpinning the evaluation of evacuation projects, focusing on hedonic price models, a technique used to implicitly assess the value of property attributes. This technique is employed in a number of studies of the effect of floodplain location on property values. A review of economic theory of the floodplain property market opens Chapter 2.
Chapter 2 continues with the next phase, a literature review of studies found that address the effect of flood risk on property values. It was initially anticipated that the published studies would provide an
adequate basis for meeting the objectives of this study. However, the evidence of whether property values are discounted due to flood risk was inconclusive. Therefore, the final phase proceeded to develop hedonic models based on primary data obtained from related studies ai Abilene, Texas and South Frankfort, Kentucky. These case studies are presented in Chapter 3.
Chapter 2 - Economic Model and Literature Review
The first section of this chapter introduces the economic model that explains why a discount for primary flood damages should be expected. The subsequent section addresses the most widely used method to empirically detect a flood risk discount - hedonic price models. The chapter concludes with a section that reviews existing hedonic price model studies of flood risk discount.
2.1 Economic Model
Project benefits result from increases in consumer’s and producer’s surpluses due to the presence of the project. In the case of flood damage reduction projects, project benefits are due to decreases in flood damage to property within the project area. The P&G, which guides the Corps’ use of benefit-cost analysis to evaluate projects, assumes a partial equilibrium market model for expecting a discount in the value of a floodplain property. Neither the P&G nor the Corps’ implementing guidance specifically discuss the theory of this economic model. However, McDonald et al., [1987] explain the model as follows:
“The estimation of willingness to pay for a reduction in flooding hazard is based on the
relationship between housing price differentials and rational consumer behavior. The consumer will make a location choice which maximizes expected utility. The potential loss associated with flooding hazard forces the consumer to incorporate the hazard into this choice. The rational consumer will be willing to pay an amount, dependent on the perceived loss and its probability of occurring, to locate in an area where the hazard does not exist (or exists with a reduced probability of occurrence). Conversely, the rational consumer will locate within the hazard area only if they are compensated for accepting the potential loss. The willingness to pay (or compensation) should be capitalized into the prices of housing with respect to different probabilities of flooding. Further, if insurance is available, the housing price differentials should reflect the insurance premium differentials which exist for the various probabilities of a flood occurring.”
However, market dynamics are not so simple. Flood damage risk is but one of many factors that
determine property price decisions. Attitudes and perceptions of risk, knowledge of flood risk, expectation of government disaster relief, including recovery assistance, and the rules of the National Flood Insurance Program (NFIP) add to the complexity of market dynamics. Prices of floodplain properties are also affected by other attributes unique to the floodplain. The condition of properties may be poor because post-flood repairs fall short of full restoration, especially for properties subject to frequent flooding. The development of the floodplain may be unique from the rest of the community thus making it a different market. Location in the floodplain also offers benefits (such as access to the water and nice views) which are difficult to separate from flood risk disbenefits when assessing property price decisions.
Because of these complicating factors, there is some question as to whether the P&G assumption that properties are discounted for primary flood damages is correct. In fact the existence of a discount for primary flood damages has never been empirically demonstrated. The methods to empirically measure the
contribution of an attribute to the value of a property include hedonic price models and contingent valuation techniques. The study focuses on hedonic price models because they are more effective in separating out non-mutually exclusive factors.
P
f(a
1,a
2,
à,a
n)
HedonicPrice
0P
0a
iP
c
0c
1a
1c
2a
2àc
na
n(1)
(2)
(3)
2.2 Hedonic Price Models
The price for a property depends upon the attributes of the property. Mathematically this relationship can be written as:
where P is the price of the property, f(·) is an arbitrary function, and a are the attributes of the property. i Attributes include physical aspects of the property (e.g., size, age, and number of rooms) and locational attributes (e.g., school district and proximity to business district). A hedonic price model measures the contribution of each attribute to the value of the property. Mathematically the hedonic price is the partial derivative with respect to the attribute:
The practical approach to empirically calculate a hedonic price is to fit a multi-variate ordinary least squares regression model:
where c is the regression coefficient or hedonic price for attribute a Equation 3 shows a linear relationshipi i.
between price and the attributes, but alternative functional forms (e.g., log-linear and semilog) may be assumed by transforming the variables.
There are three fundamental steps in applying this regression model:
1) Choosing the appropriate variables to represent property attributes, including flood risk. All relevant attributes must be represented as variables in the regression model. If attributes are not represented in the model, changes in price cannot be attributed solely to specific variables unless there is good reason to believe the omitted attributes are uncorrelated with the specific variable. For example, proximity to a shopping district should have little correlation to whether a property owner has or has not flood insurance. Even if all the attributes are identified, a measurable variable that represents that attribute must be identified. For example, the presence of a basement in a house can be represented by a dummy variable, i.e., the variable takes the value of zero if there is no basement, and one if there is one. On the other hand, a representative and measurable variable for the attribute of a nice view of a river is not easily identified.
2) Determining a suitable functional form to represent the relationship between price and the attributes. Because price is determined by the market, the form of the function f(#) in Equation 1 and therefore the hedonic price depends upon the interaction of consumer demand function, producer supply function and
P
LP
outP
inf(a
10,a
2,...,a
n)
f(a
11,a
2,...,a
n)
Halvorsen and Pollakowski promote the use of quadratic Box-Cox regression models to avoid this problem of 3
mis-specification. Box-Cox regression models are generalized regression models, which, based on a likelihood ratio test, will choose an appropriate functional form. The functional forms include linear, log-linear and various quadratic forms.
A note on function form. Although the functional form of a hedonic price model cannot be identified a priori, 4
the coefficients from a log-linear form are easier to interpret than those from a linear model. A log-linear model with dummy variables for location in the floodplain yields the percentage change in price due to floodplain location, rather than the absolute change given by a linear model. If the range of prices in the data set is large, then a non-sensical result can result if the floodplain location discount calculated from a linear model is greater than the absolute value of the property.
(4)
income constraint [Rosen 1974]. As a result, f(#) cannot be determined theoretically. It is also difficult to obtain empirical measures of these functions to generate f(#) from a general equilibrium model. Halvorsen and Pollakowski [1981] point out that because the form of f(#) cannot be specified, models based on linear or log-linear regressions, which are the most commonly used forms, impose too restrictive or incorrect assumptions upon the economic model. On the other hand, the coefficients of3linear or log-linear models are the easiest to interpret. A well-conducted study should explore a variety of functional forms and properly interpret the results given limits of each functional form.
3) Obtaining suitable data. Identifying appropriate variables goes hand-in-hand with obtaining suitable data. A measurable variable may be identified, but it may never have been actually measured in the field. Data may be drawn from existing databases or gathered from surveys. Data collection is limited by time and money. For the case of real estate, much data is available,
specifically from the Multiple Listing Service (MLS). However, most attributes related to flood risk are not available and the research must rely on combining typical MLS data with original surveys.
In forming hedonic price models to assess a discount for primary flood damages, an obvious, simple variable to choose is a dummy variable a (a = 1 for a property in the floodplain and a = 0 for one outside of1 1 1
the floodplain) to represent location in the floodplain. Let the price differential between otherwise identical properties be defined as:
where P is the price of a property not subject to flood risk and P is the price of an otherwise identicalout in property subject to flood risk. Being in or out of the floodplain is equivalent to being exposed or not exposed to flood risk. It does not reflect degree of risk. An alternative to a dummy variable, which better captures the degree of risk, is to use flood frequency to the first floor elevation as the variable.4
In either case, P is the hedonic price (discount) for floodplain location. P is not, however, the sameL L
as the discount for the capitalized value of primary flood damages, defined as P . A change in propertyD value according to floodplain location is due to primary flood damages as well as other negative and positive floodplain attributes. The negative attributes include monetary (e.g., anticipated loss of income, temporary evacuation costs, and condition of houses) and non-monetary damages (e.g., emotional and nuisance factors,
P
LP
DM
ni1
P
iM
mj1
P
jFIRMs are maps which define floodplain zones. The zones determine the type and level of insurance 5
available. FIRMs distinguish to the level of 100-year flood zones, but not to 10, 25 or 50-year flood zones.
(5)
knowledge of or experience with flooding, potential for government flood assistance, effectiveness of floodplain regulations and risk attitudes). Positive attributes include recreational and aesthetic values. P ,L as well as some of the other negative and positive attributes vary, in value across the floodplain. For example, access to waterborne recreation is much greater if a property abuts the river.To distinguish the floodplain attributes let:
where P are the hedonic prices from negative floodplain attributes (other than primary flood damages), andi P are the hedonic prices of positive floodplain attributes. j
Ideally, Equation 5 should be solved for P . P should be compared to the present worth of theD D expected annual flood damage. The hedonic price model should therefore include variables that represent all relevant floodplain attributes. The choice of additional variables, however, is limited because of data
availability and because certain attributes may be unmeasurable or difficult to measure in terms of dollars. If variables are missing, which is likely to be the case, the magnitude of P is uncertain. Furthermore, if theD missing variables are correlated with floodplain location (i.e., vary across the floodplain), then P cannot beD
attributed solely to primary flood damages.
Even if the P ’s and P’s are not measured, measurement of P is still insightful because, if it isi j L shown to be greater than zero, then the sum of P and the hedonic prices for other negative attributes, P ,D i
is at least as large as that for the positive attributes, P . This result would imply that there is a discount forj primary flood damages, although the magnitude of the discount would be unknown. On the other hand, if P is less than or equal to zero, then it cannot be proven that P is zero. As will be shown, the majority ofL D
the existing academic studies do not attempt to separate the negative and positive attributes of floodplain location. They seek only to measure a discount for floodplain location (i.e., P ), and without regard toL
position within the floodplain.
Measuring P is further complicated by flood insurance. Flood insurance changes the risk that theD
consumer must consider [Krutilla 1966, Thampapillai and Musgrave 1986]. The economic model predicts that a consumer should discount for the present worth value of their annual flood insurance premium. Since the monetary risk of flooding is reduced, the intangible costs, P , should also be reduced. However, thei
National Flood Insurance Program (NFIP) and its effects upon property values is complex such that the present worth of annual insurance premiums is substantially different from, and less than, P . NFIPD
requires a minimum standard deductible, a minimum premium, and limits on maximum coverage. Actuarial insurance, which is limited to $150,000 coverage, is only available for houses built after Flood Insurance Rate Maps (FIRM) have been established for a community. Houses built before a FIRM is established for a5
community are eligible for subsidized insurance (limited to $35,000 of subsidized coverage and an additional $115,000 limit of actuarial coverage). Since NFIP requires flood plain zoning regulations to limit post-FIRM development in the floodplain, most floodplain properties are pre-existing and eligible for subsidized
A further complication is that, at least until 1994, mortgagors were not required to maintain flood insurance 6
coverage for the full term of the mortgage, or the life of the property.
For example, grants and low interest loans for rebuilding and repairs. 7
The case study by Babcock and Mitchell was located in Canada and therefore the 100-year flood zone as used 8
in the U.S. by FEMA was not defined. They defined the high and low risk zones, respectively, as the area from the river to the maximum observed flood line and as the area from the high-risk zone to the expected flood line associated with a storm of the magnitude of Hurricane Hazel which traversed Southern Ontario in October 1954. The flood frequency of these zones is undefined in their paper.
insurance. Incorporating the effects of NFIP within the hedonic price model therefore requires more than6
just annual premiums. To distinguish between subsidized and actuarial premiums, the hedonic model should include variables for age of house and date of last sale. Hedonic models should be formed separately for properties less than $35,000, between $35,000 and $115,000 and greater than $115,000 to account for the subsidized coverage limits.
Finally, expectations of recovery assistance are believed to have a substantial influence on risk
perceptions and attitudes. These effects are even more complex and difficult to measure than the effects of7
flood insurance. Two hypotheses can be made. First, property owners are ignorant of flood risk and therefore do not discount. When a flood hits, they determinedly demand flood relief assistance. Second, property owners are aware of flood risk, but do not discount because they expect flood relief assistance. Either hypothesis is difficult to test with a hedonic price model.
2.3 Literature Review
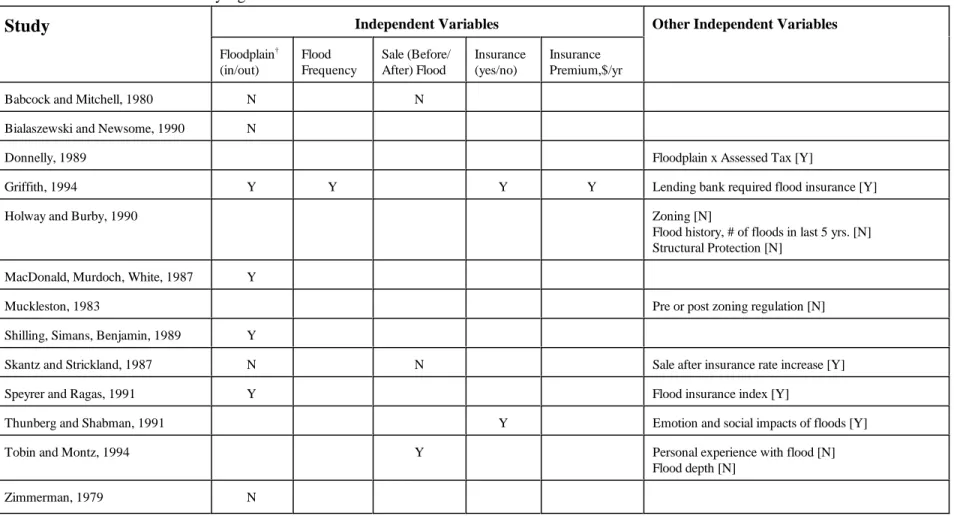
The literature review covers existing studies that attempt to measure a discount for floodplain properties. The studies are listed in Table 3 and each is summarized in Appendix A. This set of studies is fairly
comprehensive. Most use hedonic price modeling, while some use difference in means to measure a discount. The hedonic price model studies assume either a linear or a log-linear function form. All but one attempted to measure P . Only Muckleston, and Speyrer and Ragas attempted to measure the hedonic price of positiveL floodplain attributes. A few other studies were not reviewed in depth because they had poorly specified models, lacked sufficient data, or had different objectives.
Studies with floodplain location as an independent variable
A dummy variable representing whether a property was in or out of the 100-year floodplain zone has been used in several hedonic price studies [Bialaszewski and Newsome 1990, McDonald et al. 1987, Muckleston 1983, Shilling, Simans and Benjamin 1989, Skantz and Strickland 1987, Speyrer and Ragas 1991, and Zimmerman 1979]. Babcock and Mitchell [1980] defined a dummy variable for in and out of high and low risk flood zones. Similarly Donnelly [1989] created a variable that was the product of a dummy8
variable for floodplain location times property tax. These researchers chose the 100-year floodplain zone rather than a finer increment of zones because 100-year floodplain zone data are readily available from flood insurance rate maps (FIRMs). In essence, all these models determine if the mean value of properties in and out of the 100-year floodplain zone is statistically different. Four of the eight studies show a discount for
location exists, while the others do not. These results are inconclusive, and are expected to be so, because
Study
Independent Variables Other Independent Variables Floodplain† (in/out) Flood Frequency Sale (Before/ After) Flood Insurance (yes/no) Insurance Premium,$/yrBabcock and Mitchell, 1980 N N
Bialaszewski and Newsome, 1990 N
Donnelly, 1989 Floodplain x Assessed Tax [Y]
Griffith, 1994 Y Y Y Y Lending bank required flood insurance [Y]
Holway and Burby, 1990 Zoning [N]
Flood history, # of floods in last 5 yrs. [N] Structural Protection [N]
MacDonald, Murdoch, White, 1987 Y
Muckleston, 1983 Pre or post zoning regulation [N]
Shilling, Simans, Benjamin, 1989 Y
Skantz and Strickland, 1987 N N Sale after insurance rate increase [Y]
Speyrer and Ragas, 1991 Y Flood insurance index [Y]
Thunberg and Shabman, 1991 Y Emotion and social impacts of floods [Y]
Tobin and Montz, 1994 Y Personal experience with flood [N]
Flood depth [N]
Zimmerman, 1979 N
† “Floodplain” indicates that a property is within or outside of the 100-year floodplain zone (a 0/1 dummy variable).
Table 3 List of hedonic price studies on impact of flood risk on floodplain property values. “Y” and “N” denote, respectively, that the variable was
The marked increase in insurance rates must be assumed to be an atypical case. 9
A spline regression uses “Bezier Spline” curves to capture locational variation. The regression equation 10
takes the form of a third-order polynomial which is how a spline curve can be defined. The location of each property is denoted by Cartesian coordinates. The purpose of spline regression is to generate a surface which shows where property values are depressed due to some locational factor such as flood risk.
Griffith [1994] recognized this variability and formed a hedonic price model with flood frequency as an independent variable. She tested both linear and log-linear models. The t-statistic for the coefficient for flood frequency was significant to 95% for the log-linear models, but the results are unreliable, since outliers were not appropriately removed. Griffith hypothesizes that P may not increase linearly over the floodplainL
and that it is possible only that those properties deep in the floodplain are discounted. The Abilene case study in Chapter 3 (which draws from the same data set used by Griffith) tests this hypothesis. The case study uses dummy variables for smaller increments of floodplain frequency zones (100, 50, 25 and 10-year zones) rather than the actual flood frequency value as an independent variable because using the actual frequency value as the variable assumes the discount is proportional to the frequency.
Floodplain topography also has been included in hedonic price models. Tobin and Montz [1994] found flood depth was not a statistically significant factor. Depth should not have strong explanatory power, since it alone neither reflects the frequency of the flood depth nor the intrinsic value of the property.
Flood insurance’s influence upon PD
Few researchers have included flood insurance premium as an independent variable in hedonic price models, let alone specify the hedonic model to account for the complexity of NFIP. Shilling, Simans and Benjamin [1989] created a log-linear hedonic price model with insurance premium as an independent variable. The coefficient for this variable was significant and negative as hypothesized. Since they did not report descriptive statistics, it is not possible to determine how much of the insurance was subsidized. Thunberg and Shabman [1991] formed a log-linear model with a dummy variable representing whether a property owner had or did not have flood insurance, and a dependent variable of willingness-to-pay for flood control (rather than property value). Their data were based on contingent valuation. They found the
coefficient for the flood insurance dummy variable to be significant and of the right sign. Based on this result, they suggest that people are willing to purchase flood insurance over flood control. Griffith [1994] found that property values dropped when the requirement to purchase insurance was enforced by the lending institution of the mortgage.
Skantz and Strickland [1987] found with a log-linear model that “when insurance rates increased markedly [400%] approximately one year later [after a flood], the higher rates are capitalized into home values and prices fall.” Prior to the flood, insurance rates were so highly subsidized that the average annual9
premium was only $14 for properties in the flooded neighborhood in question.
Speyrer and Ragas [1991] created a spline regression model that included an insurance cost index (ratio of unit premium/unit price divided by ratio of average premium/average price). A spline regression model addresses the spatial distribution of property values. Through a two-dimensional Cartesian plot of the10
spline model, they identified neighborhoods where house prices were lower due to flood risk. They suggest that the discount was due primarily to capitalization of insurance premiums, but also due to the inconvenience of flooding (intangible risk averse costs).
In summary, these studies generally show insurance premiums are capitalized into property values. However, these studies cannot be used as evidence to support the assumption that there is a discount for primary flood damages. The first reason is only one of them distinguishes between subsidized and actuarial rates. The second reason, and the more important reason, is NFIP participation rates are low nationally, about 25% in 1990 [Holway and Burby 1990]. Further evidence would need to be gathered to demonstrate whether the remaining uninsured floodplain properties discount for flood risk.
The effect of risk attitudes upon PL
A risk averse person would discount more than P because of the anxiety and/or inconvenience causedD by flood hazard. Although information on flood risk may be available to consumers, Thunberg and Shabman [1991], and Griffith [1994] have hypothesized that consumers may have a difficult time assimilating the effect of rare events into their willingness-to-pay. As a result P may be significant for frequently floodedL
areas, on the order of 10 to 25 year flood frequencies, while P may be small for rarer flood events. TheL South Frankfort case study in Chapter 3, which has data on actual sales, expected flood damage, and flood frequency, examines this hypothesis.
MacDonald et al. [1987] found evidence that consumers are risk averse toward flood risk. They carried out a contingent valuation study and found that P was greater than the present worth of actuarial insuranceL
premiums, which generally is equivalent to P . In other words, they concluded that consumers place a costD for flood risk aside from actual expected damages. Their study was based on contingent valuation rather than actual house sales. They also found risk averse attitudes were more pronounced among average to above average priced properties. They hypothesized that owners of above average priced homes value security from floods. Meanwhile, some owners of below average priced homes may be less risk averse, because they may perceive that repairs they can make after a flood event will enhance the value of their homes beyond what it was before the flood. The effect of income levels upon flood risk attitude also is discussed in the Abilene case study in Chapter 3. In addition, Thunberg and Shabman [1991] found with a hedonic price model evidence that individuals are willing to pay for flood protection to reduce expected flood damages and to reduce anxiety and community disruption.
Measuring positive floodplain attributes
Muckleston [1983] hypothesized that the value consumers place on riverine amenities may outweigh that for flood hazard disamenities. With a hedonic model that included proximity to the river as a variable, he found property prices rose faster for riverside properties (after the water quality improved in the river) than for other floodplain properties even as floodplain regulations and the NFIP were making the flood hazard more apparent to consumers.
Speyrer and Ragas [1991] used proximity to a lake as a proxy for lacustrine amenities. Proximity to a lake was found to be a positive amenity and larger than the discount due to flood risk. Proximity is a useful measure, but it is limited in that different consumers may value riverine amenities differently.
The effect of floodplain regulations upon PL
Holway and Burby [1990] examined the effect of floodplain regulations upon undeveloped land values for nine communities across the country. They found land values decrease under zoning regulations requiring low density development and for flood proofing construction requirements. They warn that zoning
Muckleston [1983] found tentative evidence that floodplain regulations do not affect the value of developed property. He found that riverfront properties increased in value even after floodplain regulations were in place. He hypothesized that riverine amenities, which improved after the water quality of the river improved, increase property values more than floodplain regulations decrease them.
Personal experience with floods and PL
Recent homeowner experience with floods has also been hypothesized as a discounting factor. Such studies measure P , the discount for location in the flood plain. Skantz and Strickland [1987], and BabcockL
and Mitchell [1980] looked at house sales before and after a flood. Neither study found statistically
significant differences in house prices. Tobin and Montz [1994] hypothesized and found evidence that prices fall after a flood, but soon recover. They found, for a community with frequent but less severe flooding, prices take longer to recover. Nevertheless, Tobin and Montz’s results do not support the existence of long-term capitalization of expected flood damage into housing prices.
Summary and discussion of factors that affect P D
The important question of whether a discount due to primary flood damage exists could not be answered from the literature review. Most of the existing studies do not attempt to separate the discount due to primary flood damage from the more general discount due to floodplain location. Even then, the studies on a discount for floodplain location, P , are inconclusive. Nevertheless the literature review revealed the complexity ofL
hedonic prices for floodplain properties.
& Eight of the studies used a model that employed the dummy variable of location in or out of the 100-year floodplain. Half of the studies show a discount for location (in the floodplain) exists, and half do not. These studies are inconclusive and expected to be so because this model implies that the flood risk is constant across the 100-year floodplain. Flood risk, and therefore any corresponding discount, will vary among properties deep in the floodplain, say within the 25-year floodplain, and those just within the 100-year floodplain. The case studies in Chapter 3 model floodplain location with finer increments of floodplain zones.
& Four studies examined the effect of flood insurance premiums. All four found property values discounted by the capitalized value of flood insurance premiums (only where premiums actually are paid). However, none of these studies accounted for the complexity of the NFIP, in particular the relative effects of subsidized versus actuarial rates. Only about a fourth of property owners purchase flood insurance, so it cannot be assumed that all property owners discount for primary flood damages. & It is not clear whether consumers are risk averse or risk seeking. Two studies hypothesized that consumers may have a difficult time assimilating the effect of rare events into their willingness-to-pay. A contingent valuation study suggests that higher-income consumers may be more risk averse than lower-income consumers.
& The value of positive floodplain attributes was addressed in two studies. Both found the value of positive attributes, Pj’s, to be larger than the flood hazard disamenities, P and P ’s. No academicD i
studies were found that have data sufficient to separate the discount for flood risk disamenities from riverine amenities. Negative floodplain attributes (e.g., indirect costs, trauma, temporary dislocation and inconvenience) may be even more difficult to measure in dollar terms than positive floodplain attributes. & Three sets of researchers studied property prices in the period following a flood. None found a discount in price over the long-term. One study observed a drop in prices followed by a recovery, with
the recovery being slower for houses with more frequent flooding. None of these studies included data on the physical condition of houses, all of which were damaged and then repaired.
These results show that no existing study comes close to the complex modeling needed to measure a discount for primary flood damages let alone one for floodplain location. The results, however, suggest ways to improve hedonic price models and understanding of the value of floodplain properties. In particular, such studies should address floodplain location at finer increments than the 100-year flood zone, such as the 10, 25, and 50-year flood zones. Hedonic price models based on floodplain location also would need to include positive and negative attributes that may be correlated with floodplain location. If these other attributes were not included, then P could not be measured. The impact of NFIP upon P and P could be addressedD L D
with a carefully formed model and sufficient data on insurance premiums, type of insurance coverage, and age of house. History of flooding or personal experience with flooding would also be required. Last, because utility functions may vary among income groups, models should be formed from relatively homogeneous markets.
Nevertheless improving hedonic price models to detect P would be a considerable task. Data onD
floodplain attributes is limited. Multiple Listing Service databases do not generally include floodplain attributes, such as access to water and floodproofing. Much of the data is subjective or unmeasurable. For example, in measuring nice views of the river, survey takers would have to develop some type of cardinal scale of what are bad, average and good views of the river. It is unlikely that such a subjective scale would be applied consistently across studies let alone within a single study. All the floodplain attributes must be included in the hedonic model. If variables are missing, the magnitude of P will be uncertain. D
Furthermore, if the missing variables are correlated with floodplain location (i.e., vary across the floodplain), then P cannot be attributed solely to primary flood damages. It seems unlikely that survey takers and studyD managers would be able to identify all the floodplain attributes that property owners considered in their purchasing decisions.
The appraisers did not consider explicitly floodplain location when assigning values to the structures. Two 11
other issues make Pike County less than ideal for hedonic price modeling. First, Pike County is a unique market with many of residences remaining within the same family for many generations, such that sales may not reflect true market values. Second, because of the topography of Tug Fork, the market is not fully competitive in that there are few
comparable housing alternatives outside of the floodplain. A further request to Corps Districts and Divisions for data for case study analysis found extremely limited cases that have meaningful data. The available data were found to be lacking in one aspect or another.
Chapter 3 - Case Studies
3.1 Introduction
The literature review failed to disclose whether a discount for primary flood damages either exists or does not exist. However, the understanding gained from analyzing the literature provided a framework to specifically evaluate primary flood damages. Two case studies were analyzed for evidence of discounting for primary flood damages: i) Abilene, Texas and ii) South Frankfort, Kentucky. A third case, discussed in Appendix B, was analyzed for Pike County, Kentucky on the Tug Fork River, which forms the West Virginia and Kentucky border. This case study proved inconclusive because the price data were derived from
appraisals rather than actual sales. 11
As noted in Chapter 2, data indicating simply whether a house is in or out of the 100-year flood frequency zone are insufficient to measure the P , let alone P . The case studies include data on finerL D
increments of flood frequency zones. The Abilene case study also examines the effect of flood insurance and of income upon P . The South Frankfort case study includes data on not only flood frequency but moreL
importantly expected annual flood damages. With the damage data, P could be compared to the presentL
worth of expected annual flood damage, PW(E[FD]).
As will be discussed, even with these case studies, it is not possible to make broad generalizations. These case studies offer a better understanding of hedonic price modeling for flood risk. Nevertheless, it is extremely difficult to gather sufficient and comprehensive sets of data and to form effective hedonic price models to detect P . Because the data were not gathered specifically for this study, they omit importantD information that prevent effective modeling of all the relevant property attributes. In particular, the separation of positive floodplain attributes from negative floodplain attributes, and the effect of subsidized insurance could not be addressed in these case studies.
3.2 Abilene, Texas
Description of the Area and Data Sources
Abilene was selected as a case study because it had been the subject of a prior hedonic modeling study and data appropriate to this study were available. Griffith [1994], in a study entitled “The Impact of
Mandatory Purchase Requirements for Flood Insurance on Real Estate Markets,” compiled data on residential sales prices, house characteristics including floodplain location by frequency zone, flood insurance, and other traits significant to the real estate market. Griffith made the data available for this study.
Abilene is located in north central Texas. The population in 1990 was approximately 105,000. Elm Creek and three of its tributaries, Little Elm Creek, Cat Claw Creek, and Cedar Creek, flow through the city.
Date of sale was also explored. Prices varied in a range of approximately 10% from year to year when 12
looking at the whole data set. When looking at market segments, properties in the same price range, there was little variation from year to year. Hence the subsequent hedonic models do not include year of sale as an independent variable.
These streams are perched, that is, the stream banks are at a higher elevation than the surrounding floodplain. This is an unusual condition under which flooding, when it occurs, becomes widespread, albeit shallow. A number of destructive floods have occurred in the watershed. The flood of record occurred in 1932. The most destructive flood event of the 13 that occurred between 1974 and 1986 came in October 1981. Abilene has participated in the regular phase of the NFIP since 1971, with the effective rate map dated 1984. The Corps of Engineers completed a flood control study of the area in 1990.
Griffith selected Abilene because critical data were available. Due to the high cost of collecting the necessary data, she sought a location in which both a FEMA sponsored floodplain delineation and a Corps flood control study had been recently completed. Additionally, the geographic isolation of Abilene meant the boundaries of the real estate market could be identified.
Griffith obtained real estate data from the Abilene Board of Realtors. For sales made between April 1988 and March 1993, the sales price and house characteristics such as date of closing, square footage, Realtors' neighborhood code, and type of financing were collected. The Flood Insurance Administration (FIA) provided a list identifying each residential flood insurance policy in effect in the City of Abilene. Data obtained from the Corps included flood frequencies, specifically location within zones of probabilities of flooding. The 1990 Census of Population was consulted for data on neighborhood demographic
characteristics. The final data set contained approximately 4700 observations. Griffith calculated her results from about 3700 observations because not all variables were available for all observations.
Exploration of the Data
Prior to formulation of hedonic regression models, trends in the data which might guide model development were explored. Trends relating the following data fields were examined:
• sale price (dollars) • house area (square feet)
• age of house (in 1993) or year of construction (years)
• percent of high school graduates in the neighborhood (percent) • flood insurance premium (dollars)
Some properties outside the 100-year floodplain may be subject to less frequent flooding and, on average, 13
negligible damages. The 100-year demarcation was used for practical purposes due to data constraints.
Figure 1 Sale Price by Floodplain Zones.
Figure 2 Number of Observations by Floodplain Zones.
Figure 1 shows the distribution of observed sales over the flood frequency zones. Probability of zero denotes a relatively flood free location, that is, outside the 100 year floodplain. Percent probabilities of one,13
Box plots present summaries of data grouped by some characteristic, in this case flood probability. The box 14
extends from the 25th to the 75th percentiles, with the horizontal line indicating the median. The "whiskers" cover the range of observations within 1.5 box-lengths above and below the box. Outliers (between 1.5 and 3 box-lengths and shown by "o") and extremes (more than 3 box-lengths and marked by "*") are also indicated.
Figure 3 Area by Floodplain Zones.
The next explorations made were box plots of price, area, and construction date by flood probability14
(Figures 2 through 4, respectively). It should be noted that the trend of the median does not move monotonically across the floodplain for any of the three variables. This is a reminder that a decision on a house's sale price is based on complex interactions of many factors, of which flood risk is but one.
Figure 2 shows that the median house price is lower in the 100 year floodplain zone than in either the 50 or 25 year floodplain zones. The median house price in the 10 year floodplain is still lower, but the size of the box indicates greater variability in prices in this zone. Figure 3 shows little relationship between area and floodplain zone.
Figure 4 uses age (year built) as the scale variable. It is difficult to discern a trend across the floodplain zones. However, there are some interesting insights. Older development was more likely to be in the floodplain. The fact that newer houses tend to be outside the floodplain could be attributed to increased recognition of the risks involved. However, it could also be due to historical development patterns in which travel corridors and the development of infrastructure, such as water supply, followed streams and houses were built near roads and services. Finally, while most new development is located outside the floodplain, houses were still being built in the floodplain into the current decade. Houses near the streams, those in the 10 year floodplain zone, were still being built into the late 1980s. This is an indication that floodplain
Figure 4 House Age by Floodplain Zones.
Figure 5 Sale Price by House Age.
Figure 5 shows sale price as a function of construction date. Assuming the age of houses that sold during the study interval were representative of the overall stock of residences, this figure shows the
distribution of construction dates in the region. The graph indicates the economic history of the area over the century. The earliest concentration of building occurred in the "roaring twenties," followed by less activity during the Great Depression and the war years. The post-war boom is evident. High interest rates and the oil
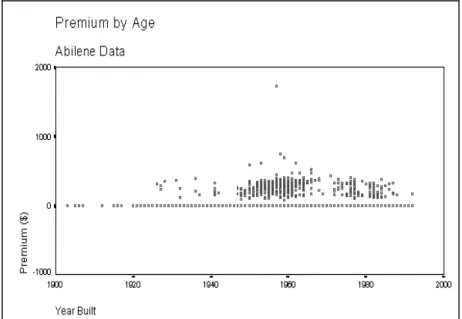
Figure 6 Insurance Premium by Age.
crises depressed home building during the 1970s. The graph then shows a recovery, noticeably strengthened following the recession of 1981-1982. Figure 5 is a reminder that history matters; the long life of houses means their locations are the result of decisions made at different times and under different circumstances.
Finally, the behavior of the flood insurance premium was investigated, as shown in Figure 6. For those properties with insurance, almost all premiums are in the range of 200 to 500 dollars (There are 519
properties with flood insurance, and the mean premium is $259 with a standard deviation of $120.). Most policies cover houses built prior to 1984, the year of the rate map study. It is presumed that few of the policies reflect actuarial rates. In addition, twenty-nine percent (166 of 574) of houses in the 100 year floodplain have flood insurance. On the other hand, there are 519 houses of the 3726 in the whole data set that have flood insurance. Thus 353 of the 519 insured houses are outside the 100 year floodplain. What seems to matter is the existence or absence of a policy, not the actual premium. Therefore, the hedonic models were implemented using a dummy variable, Premdum, with a value of one if a premium was paid and of zero otherwise. Other explorations of the data yielded neither unexpected trends nor noteworthy insights.
Hedonic Price Models
All models in this case study employed a linear functional form. As noted in Chapter 2, most hedonic studies use either the linear or semi-log functional form. The linear form gave better explanatory power, based on R-squared results, and thus was used for the Abilene portion of this study.
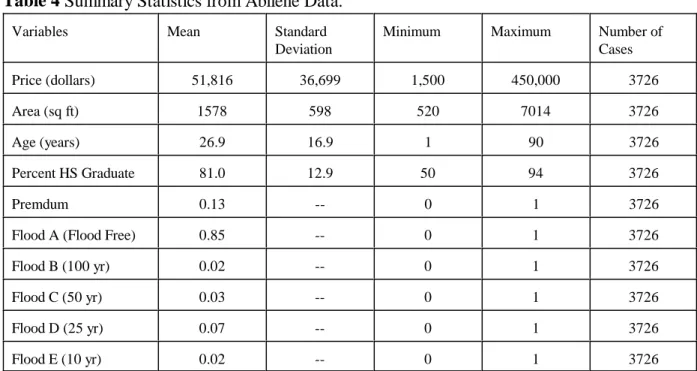
The variables used in the hedonic models and their summary statistics are listed in Table 4. Price is the dependent variable in each model. Attributes that reflect the structure of the house are its Area in square feet and its Age (as of 1993). The percent of high school graduates (HSGrad) in the neighborhood (census tract) is used as a proxy for community educational attainment. Premdum was discussed above. Flood1 is a
Low priced houses may frequently be purchased for the rental market, so the behavioral patterns of low 15
income households may or may not even be important. If investors are involved, the narrow price range is less reasonable.
Variables Mean Standard
Deviation
Minimum Maximum Number of
Cases Price (dollars) 51,816 36,699 1,500 450,000 3726 Area (sq ft) 1578 598 520 7014 3726 Age (years) 26.9 16.9 1 90 3726 Percent HS Graduate 81.0 12.9 50 94 3726 Premdum 0.13 -- 0 1 3726
Flood A (Flood Free) 0.85 -- 0 1 3726
Flood B (100 yr) 0.02 -- 0 1 3726
Flood C (50 yr) 0.03 -- 0 1 3726
Flood D (25 yr) 0.07 -- 0 1 3726
Flood E (10 yr) 0.02 -- 0 1 3726
Table 4 Summary Statistics from Abilene Data.
dummy variable with a value of one if the house is in the 100 year floodplain and zero otherwise. FloodA is a dummy variable with a value of one for flood free location. FloodB through FloodE are also dummy
variables, taking the value of one, respectively, for location in 100, 50, 25, and 10 year floodplain zones.
Five hedonic price models were made with various combinations of the variables. The first model was identical to the initial model of Griffith and was used to provide confidence that data had been transferred and prepared properly. The results of Griffith's study could not be replicated exactly due to screening of outliers, but adequate agreement between the studies was achieved. However, it soon became apparent that the regression coefficients were not meaningful because the models were derived from the whole data set. Since the data set includes all sales in Abilene from 1988 to 1993, it includes houses for all income groups. Hufschmidt et al. [1983] note that the "implicit hedonic price for the entire urban area will be wrong if, as some theorists believe, the housing market stratifies into separate segments."
Data on incomes of purchasers were not collected, so the data set was divided by sale price to account for differences in behavior by income groups. Three segments were initially selected, each with the low end of the range at 80 percent of the high end. The top prices selected for the ranges were $100,000, $50,000, and $10,000. The segment of houses in the $8000 to $10,000 range was found to be a problem on two counts. First, it appears to be too narrow a range to represent a believable limit to behavior. Second, the15
![Table 1 Guide to Types of Benefits [P&G, Table 2.4.14, p. 38].](https://thumb-us.123doks.com/thumbv2/123dok_us/1294946.2673555/16.918.116.783.188.641/table-guide-types-benefits-p-amp-g-table.webp)