Draft/For Comments
Corporate Growth and Risk around the World
Stijn Claessens^ Simeon Djankov Tatiana Nenova1
September 10, 1999
Abstract:
The importance of macroeconomic weaknesses, moral hazard, regulatory deficiencies, and the inherent instability of financial markets have been investigated in the literature on explaining financial crises. More recently, corporate sector aspects performance, financial structure, corporate governance rules have been included. In this paper, we investigate how corporate sectors’ financial and operating structures relate to the institutional environment in which they operate. We show that a country’s legal origin, the strengths of its equity and creditor rights and the nature of its financial system can account for different degrees of corporate risk-taking. In particular, corporations in common law countries and those in market-based financial systems appear less risky. Greater enforcement of property rights is associated with higher measured financial risks. This suggests that the financing patterns of the corporate sector reflects the deeper institutional environment.
1
World Bank, World Bank and CEPR, and Harvard University. This paper is prepared for the conference Financial Crises in Emerging Markets, organized by the Federal Reserve Bank of San Francisco, September 23-24, 1999. We thank Ying Lin for excellent research support. ^ Corresponding author: tel. 202 473 7212; EM: Cclaessens@worldbank.org.
1. Introduction
Explaining financial crises in emerging markets and developed countries has developed into a large literature. This can be attributed, apart from well-cooperating countries, an abundance of events, some very recent such as in East Asia, and others earlier, such as the Nordic countries’ financial crises, to a better theoretical understanding of the causes of financial crises. Two different strands (”generations”) can be distinguished in this literature: those papers focussed on fundamental weaknesses, whether related to macroeconomic policies, existence of moral hazard in the financial sectors, or weak institutional frameworks,1 and those pursuing the possibility of unstable (international) financial markets.2 In this context, weaknesses in corporate sector have been mentioned as “important” factors for either view. Corsetti et al. (1998) for example, mention weak corporate performance and risky financing patterns as important causal factors for the East Asian financial crisis. And Krugman (1999) draws attention to the “transfer problem” arising if the corporate sector has large foreign exchange liabilities, where small shocks can lead to a bad equilibrium.
While the debate over the exact causes of the various financial crises, most notably those in East Asia, will likely continue for a long time, answers are likely to be found in the interaction between “misguided” macro-economic policies and structural weaknesses, with the latter including certain corporate sector characteristics. These corporate sector characteristics have, however, not been much used in the literature. This is mainly because they have not been well-documented due to a paucity of data on corporate sectors around the world. Building on databases which have recently become available, we fill this gap in the literature and shed light on the risk characteristics of corporate sectors around the world. This serves to clarify the role of corporate sector financing patterns in contributing to a financial crisis.
1
There has been extensive theoretical and empirical literature building on the Krugman (1979) model, e.g. Edwards and Santaella (1993), Eichengreen, Rose and Wyplosz (1995), and Chang and Velasco (1998). The moral hazard view is theoretically and empirically explored by Akerlof and Romer (1996), Corsetti, Pesenti, and Roubini (1998).
2
Based on the Diamond and Dybvig (1983) bank run model and Obstfeld (1994), Radelet and Sachs (1998) defend the view that in macro-economically and otherwise sound countries a crisis can be provoked by a self-fulfilling panic.
For our cross-country study, we use data for 11,000 firms from 46 countries over the period 1995-96. We calculate 14 indicators typically used by financial analysts and researchers to gauge a firm’s performance and risk. As a starting point, we show that corporations in crisis countries often pursue(d) riskier financial and operating structures than corporations in other countries. Specifically, we find that corporations in crisis countries typically have much higher financial leverage.
We then step back and investigate some possible causal factors behind this riskier financial behavior. In particular, we examine whether differences in corporate financing patterns across countries reflect the legal, regulatory, and financial environments in the respective countries. In other words, we try to analyze whether financing structures represent the reaction of firms to a certain set of institutional characteristics in the particular country. Using cross-country analyses, we are able to document that there are a number of institutional features which are consistently associated with risk-taking behavior by corporations. In particular, corporations in common law countries and those in market-based financial systems appear less risky. Greater enforcement of property rights is associated with higher values for measures of financial risks. These institutional factors increase the risks of a financial crisis originating from the corporate sector.
The rest of the paper is organized as follows. Section 2 discusses the related literature and the motivation for our work. Section 3 describes the data. Section 4 shows some simple comparisons between medians across different cross-sectional characteristics of the sample. Section 5 develops the regression analysis. Section 6 concludes.
2. Literature and Motivation
Our study relates to three different strands of literature. First, the ever-growing literature on predicting and explaining financial crises, where, following on first and second-generation balance-of-payments crisis models, some have suggested that corporate sector financial structures can be an important source of financial instability. Krugman (1999) argues that company balance sheet problems may have a role in causing financial crises, independently of macro-economic or other weaknesses, including a poor performance of the corporate sector itself. In particular, a depreciation of the domestic
currency causes an increase in the currency value of foreign-denominated firm debt, with firms also facing declining sales and higher interest rates. The resulting balance sheet problems and reversal of capital flows weaken the corporate sector, and in turn the financial system. This triggers a further currency depreciation with a current account surplus to accommodate the capital reversal deficit and financial system weakness. Krugman ascertains that the risks of such event occurring are higher when there is low profitability of firms relative to the cost of funds to financial institutions. Empirical tests which include the role of the corporate sector in explaining financial crises are few. Johnson et al. (1998) identify a channel where a weak corporate governance framework results in more stealing by managers at the optimum, which in turn leads to large currency depreciation and recessions in the economy. They show empirical support for their model in a sample of 25 developing countries.
The paper also relates to the corporate finance literature that investigates firms’ financial structures (including leverage and debt maturity, and other measures of company risk-taking) and the relationship between firm financing patterns and firm performance and governance. This literature draws attention to the relationships between the type of firm assets being financed and firm financing patterns. It also highlights the role different financial structures play in disciplining and monitoring management (see Harris and Raviv 1991, for a review). This literature has, however, largely analyzed firms-specific determinants and effects of firm financing patterns in a single country context.
Lastly, our work expands on the more recent literature that compares financial structures across countries, looking for systematic differences and underlying explanatory factors. In a series of papers, Andrei Shleifer and coauthors have drawn attention to the impact of corporate governance frameworks and legal environments on (aggregate and firm-specific) financial structures and corporate sector performance (see La Porta et al. 1999b for a survey). They have found that financial markets are less well-developed, equity markets are used less frequently by firms to raise funds, and dividend pay-out policies are less generous when creditor and equity rights are less well-protected, thus suggesting relationships between financial structures and underlying legal characteristics. Other papers which have investigated cross-country comparisons using firm-specific data
include Rajan and Zingales (1995 and 1998), Demirguc-Kunt and Maksimovic (1998 and forthcoming), and La Porta et al. (1999a, 1999c). In addition to comparing financing patterns across countries, these papers investigate the impact of different corporate financing patterns on economic growth. Demirguc-Kunt and Maksimovic 1998, for example, find that the degree to which specific firms (or the corporate sector in general) use long-term external financing from either stock markets or banks, affects their growth. Stulz (1999) review these and other papers on the relationships between financial structures and corporate finance and economic growth. La Porta et al. (1999a) study agency problems and dividend policies around the world. La Porta et al. (1999c) looks at the expropriation of minority shareholders due to the separation of ownership and control.
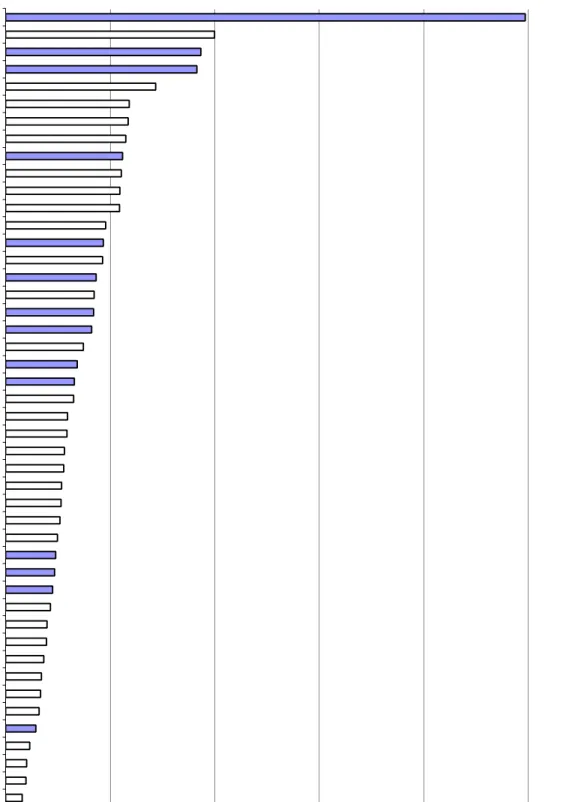
All three strands of literature are relevant to our work. It is likely that corporate sector financing patterns and associated corporate sector vulnerabilities play a material role in causing, triggering, or aggravating financial crises. Differences in financial structures of corporations between crisis countries and non-crisis countries appear large, as can be illustrated by comparing for example leverage across countries. Figure 1 presents the median leverage of all publicly-listed firms in our sample in the country, where leverage is measured as the mean total book value of debt to market value of equity over the period 1995-1996 (i.e., before the East Asian financial crisis). For 10 out of 14 crisis countries (shaded in the figure), the median firm leverage in the country is above the median for all countries. Similar results obtain when plotting several other measures of firm financial risk structures. This suggests that corporations in crisis countries pursued riskier operating and financial policies before the crisis occurred, and that such behavior may have served as an independent cause for the crisis.3
In this paper, we do not focus on explaining the contribution of corporate sector risks to financial crises, however. For one, predicting financial crisis is a risky business, to say the least, with mixed explanatory powers (especially when considering Type I
3
Of course, these perhaps more risky financing patterns might well come along with higher corporate sector growth rates and the combination of high risks and high return may well have been efficient ex-ante.
versus Type II errors). Furthermore, there is still a lack of theoretical models on the interaction between corporate sector financing patterns and the risk of a financial crisis. This becomes important as often financing patterns do not change much over short-periods of time. Related work suggests that there were no obvious changes in publicly available measures of East Asian corporations’ performance or financing patterns in the period before crisis (Claessens et al. 1999). It would require a well-specified model to investigate the role of the corporate sector in contributing to a financial crisis to avoid the risks of an (ex-post) data-mining exercise to find weaknesses which can “explain” the occurrence of crises. Furthermore, the classification of countries as crisis or non-crisis is not free of subjective judgment. There are, for example, many countries with a systemic, long-drawn crisis which do not suffer from a financial crisis involving a currency collapse or open banking crisis. In general, the relationships between countries’ financial crises and their corporate sector financing structures and performance is fragile.
Instead, we try to investigate the relationship between countries’ regulatory and legal environment and firm financing characteristics, focussing on their degree of risk-taking, but including also some performance measures. As noted, recent papers on the relationships between institutional factors and financial structures (La Porta et al., 1999, Demirguc-Kunt and Levine, 1999, Rajan and Zingales, 1995 and 1998) highlight that institutional factors in a particular country are likely to greatly influence the performance and financing patterns of firms, including their risk-taking behavior.4 So far, however, these studies have mainly concentrated on the degree to which firms use external financing and a few, selected aspects of firm financing patterns which may constitute risks (such as firm leverage and the degree of short-term debt). Some of these studies have also used a limited sample of countries (Rajan and Zingales, 1995, for example, focus on seven developed countries). We build on and extend this literature in several directions. We use a large(-r) sample of countries and corporations to allow for a deeper cross-country comparisons as to the role of institutional factors. In particular, we explore
4
These fundamental differences in turn may also explain why some countries can be
characterized as bank-based and others as market-based (the nature of the causality is more debatable here as political economy might well result in the adoption of legal and other institutional features which are consistent with either system, see Rajan and Zingales (1999).
whether there is an independent causal link between one hand the legal origin, the regulatory and legal protection provided to creditors and equity holders respectively, and a market- versus bank-based characterization of the country, and the other hand the financial and operating risk taken by companies in that country. We also explore a multitude of measures of firm financial risk, in addition to the commonly-used measure of leverage and maturity structure of debt.
Our hypotheses are as follows. On legal origin, we expect that corporations in common law countries exhibit less risky financing patterns. As noted by La Porta et al. (1998), common law countries are characterized by more developed equity and other capital markets, and higher firm valuation than civil law countries. We expect therefore that in common law countries corporate risks will be lower. One particular difference between civil and common rights is the strength of outside investors’ rights, both shareholders and creditor, as documented by La Porta et al. (1997). We therefore use their index of equity and creditor rights to explore the effects of legal framework on firms’ risk-taking behavior. We hypothesize that in countries with better property rights corporations will have more access to external financing, which will translate into higher measures of risks. We also hypothesize that, controlling for the strength of property rights, corporations in countries with stronger equity rights will have less risky financing patterns and corporations in countries with better creditor rights corporations will exhibit higher risks, in particular higher leverage.
We also explore the difference between market-based and bank-based (or relationship-based) financial systems, in part as that distinction relates to the strength of outside investors’ rights and firm financing patterns. Rajan and Zingales (1999), for example, emphasize that banks can overcome more easily informational asymmetries than markets can. Relationship-based systems may thus function better than arm’s length systems in more opaque, legally less efficient environments, with large informational asymmetries. Bank-based system are thus more likely to emerge in environments with less-developed property rights, laws, and institutions, especially when high positive NPV are more abundant. Such bank-based systems will also be characterized by higher leverage as debt financing is used more extensive (although this is almost by definition) as creditor rights might be stronger. Demirguc-Kunt and Levine (1999) explore these
relationships and find that legal systems help in the characterizations of financial systems (they find that countries with common law tradition and strong shareholder rights tend to be more market-based, and civil law countries more bank-based).
Part of the distinction between these two types of financial systems is the degree of corporate sector risk-taking. Allen and Gale (1999) and Stulz (1999) have drawn attention to the differences in implicit versus explicit risks-sharing which may exist in based versus market-based systems. Allen and Gale (1994) highlight that in bank-based systems a lot of non-diversifiable risk is inter-temporally smoothed through close relationships between banks and corporations. The relationship-based nature of conducting business may also mean that bank-based systems are less able to discipline risk-taking by corporations. In an arm’s length environment, risks-sharing happens more directly through markets and is more of an intra-temporal nature (through price and other adjustments). In addition, the amount of risk taken by firms is more disciplined by the market, e.g., through the required rate of return by the market, and thus firms may be bearing less amount of risk. To review the evidence on this, we will also investigate whether there are systematic differences in risk-taking behavior between market-based and bank-based financial systems.5 We hypothesize therefore that corporations in bank-based financial systems exhibit riskier financing patterns than those in market-bank-based financial systems.
3. Data
We collect data from Worldscope, a database which has been used extensively in a number of recent papers. Worldscope covers publicly-listed financial and non-financial corporations in 54 countries. The sample we uses includes all companies from Worldscope except financial firms (SIC codes 6000-6999) and regulated utilities (SIC codes 4900-4999). The data cover the period 1995-1996, with the exception of 6 ratios
5
There might be tradeoffs between risk and return and higher risk-taking behavior in relationship-based systems might well be optimal. In case of a negative exogenous shock, however, this risk-taking can precipitate a crisis, starting from the corporate sector to financial system weaknesses and eventually leading to a financial crisis.
that are computed over the period 1991-1996, since their calculation requires a longer time series.6 We include all firms for which we have data for both 1995 and 1996, i.e., we use a balanced panel of data. We exclude 8 countries because they have less than 10 firms with non-missing data for both years (Egypt, Jordan, Liechtenstein, Luxembourg, Morocco, Russian Federation, Slovakia and Zimbabwe). We are left with 11,033 firms and 46 countries.
Table 1 presents the sample countries and shows the number of firms per country. The mean number of firms per country is 240 and the median 94. The lowest number of firms per country is 11 for Venezuela, and the maximum number is 2715 for the US. The data cover mainly large firms. This selection pattern arises since firms have to be listed on a stock exchange in order to enter the database, and listed companies tend to be large. Previous work for nine East Asian countries (Claessens et al., 1999) suggests that the Worldscope sample covers between 64% and 96% of the total market capitalization of firms listed on the stock market. We expect that this to be the case for this larger sample of countries as well, especially for the developed countries were reporting is generally better.
The table also provides the classification of countries along different dimensions (for detailed definitions see Table 2). We classify countries as “crisis countries” if they have undergone a crisis in the period 1996-1998, following Caprio and Klingebiel (1999). Of the 46 countries, 14 are in this way classified as crisis countries. We next use information from La Porta et al. (1998) on legal origin to classify countries as common or civil law, with the latter further classified as French, German, or Scandinavian. Using the same sources, we expand on their sample of legal origin by classifying China, the Czech Republic, Hungary, and Poland as Germanic, civil law countries. We end up with 15 common law countries and 31 civil law counties, of which 17 French, 10 Germanic, and 4 Scandinavian civil law countries.
We also report the degree of shareholder and creditor rights from La Porta et al. (1998). The shareholder index is an average of five indicators of anti-director rights,
6
The sensitivity of operating income and of EBIT to sales, the variability of operating income and of EBIT, and the measures for firm growth – capital expenditure to total assets and the total assets growth rate.
including the right to receive dividends on pro-rata terms, to vote for directors, to participate in shareholders’ meetings, to subscribe to new issues of securities on the same terms as the insiders, and to call extraordinary shareholders’ meetings. The creditor index is an average of four indicators of creditor strengths: the timeliness of rendering a judgement whether to liquidate or restructure once a bankruptcy petition has been filed; whether the incumbent management remains in control of the company during reorganization or bankruptcy; whether the creditor is barred by “automatic stay” from taking collection action against the debtor's assets during the bankruptcy proceedings; and whether secured creditors have the first priority of claims to the debtor’s assets. We also expand on these data by including these rights for the four transition economies in our sample. We do not have these data for Venezuela.
Shareholder rights relate strongly to civil origin and vary from a low of 0 for Belgium to a high of 5 for common law countries such as Canada, Hong Kong and India, among others. Creditor rights vary between 0 for several French and Germanic civil law countries (for example, China, France and the Philippines) to a high of 4 for some common law countries (for example, Malaysia, Pakistan, Singapore). We report as well an indicator for the rule of law to account for the degree to which these and other rights are being enforced. This indicator shows a wide range from a high of 10 (the highest) for several developed countries to a low of 1.9 for Sri Lanka.
For the classification of countries by the relative importance of banks versus capital markets in their financial system, we use Demirguc-Kunt and Levine (1999). Using a number of indicators on the aggregate size, activity (turnover) and efficiency of a country’s respective stock market and banking system, they classify countries as bank- or market-based. We expand on their classification for China and the transition economies in our sample. We have 26 countries in our sample which are bank-based by this criteria and 20 which are market-based. Of the 14 common law countries, only 6 are bank-based, that is most common law countries are market-based (as noted by Demirguc-Kunt and Levine (1999), whereas of the 31 civil law countries 20 are bank-based.
For the measures of firms’ financial risks, we use a number of ratios traditionally mentioned in corporate finance textbooks (see for example, Brealey and Meyers, 1998) and presumably used by financial analysts to asses a firm’s riskiness. Table 2 presents the
definition of the 14 specific firm-specific variables we study (the annex presents more motivation for each of the variables). We further classify these firm-level risk variables in seven groups. The first covers cash-flow risks: the variability of operating income (defined as the standard deviation the change in operating income relative to mean operating income over the period 1991-96). The second group includes two operating leverage variables (defined as the standard deviation the change in operating income relative to the standard deviation of sales and as the standard deviation of the changes in earnings after income and taxes (EBIT) relative to the standard deviation of the changes in sales, both over the period 1991-96). The third group covers two financial leverage variables: the ratio of total debt to the sum of market value of equity and all debt, and the ratio of long-term to the sum of long-term debt and equity. The fourth group covers three liquidity measures, the current ratio, defined as the ratio of current assets to current liabilities; the quick ratio, defined as the ratio of current assets minus inventory to current liabilities; and the short-term financing ratio defined as the ratio of net working capital to total assets. The fifth group includes one solvency measure, the interest coverage ratio, defined as EBIT over interest expense. The sixth group includes two maturity measures: the relative use of short-term debt, defined as the ratio of short-term debt to long-term debt; and the ratio of short-term debt to working capital, indicating the need to roll-over short-term debt. Lastly, we have three profitability measures: the net income margin, defined as the ratio of net-income before preferred dividends to sales; the rate of return on equity, defined as the ratio of earnings before interest but after taxes relative to the book value of common equity; and the rate of return on all assets, defined as the ratio of earnings before interest but after taxes relative, with all ratios averaged for 1995-96 and the latter two expressed in real terms.
As control variables at the firm level we use six variables which have also been used in other studies in explaining firm financing patterns (e.g., Wald, 1998, Demirguc-Kunt and Maksimovic, 1998 and forthcoming, Rajan and Zingales, 1995). The first is the availability of collateral which can influence the degree to which a firm can obtain long-term financing. It is defined as the sum of inventory and gross plant and equipment, relative to total assets. The second variable controls for the presence of non-debt tax shields, which would influence the relative tax-advantages of debt financing. This is
defined as the degree of depreciation relative to total assets. The third is the industry-classification as financing patterns are dependent on the type of activity financed, including the volatility of the underlying income stream, the degree of informational asymmetries in the management of the particular type of business, etc. We have the two-digit SITC groups for each firm, but this classification is too detailed for our purposes; we use Campbell 1996 to re-classify two-digit SIC to a narrower 12 industry-category.7 The fourth control variable we use is operating income to total assets, deflated using the respective GDP-price index, to control for the profitability of the particular firm. The fifth variable is the growth of total assets, also deflated using a GDP-price index, to control for the firm-specific growth opportunities which can influence its financing pattern. And finally we use size, in log-terms and expressed in US dollar to allow comparability across countries, to control for the effects of size on financing patterns.
4. Results
We start with a simple comparison of financing patterns for corporations in countries with common law versus civil law origin. Table 3 compares the medians of firm risk and profitability characteristics, and provides z-tests for equality of the sample distributions, where we use all firms within our sample. The table also presents the medians of these variables for the civil law origin countries broken down into French, German, and Scandinavian. The comparison shows many statistically significant differences. Firms in civil law countries generally display more risky financing patterns and lower rates of return on assets and equity. Differences are statistically all very significant, with p-values generally less than 1%. Specifically, corporations in civil law countries have higher cash-flow variability, higher operating and financial leverage ratios, lower liquidity and lower solvency ratios and use to a greater degree short-term
7
The sectors are defined as follows: Petroleum industry (SIC 13 and 29); Finance and Real Estate (SIC 60-69); Consumer Durables (SIC 25, 30, 36, 37, 50, 55, and 57); Basic Industry (SIC 10, 12, 14, 24, 26, 28, 33); Food and Tobacco (SIC 1, 20, 21, 54); Construction (SIC 15-17, 32, 52); Capital Goods (SIC 34, 35, and 38); Transportation (SIC 40-42, 44, 45, and 47); Utilities (SIC 46, 48, and 49); Textiles and Trade (SIC 22-23, 31, 51, 53, 56, 59); Services (SIC 72-73, 75, 80, 82, 89); and Leisure (SIC 27, 58, 70, 78-79). We add a 12th category – “other services”, which includes SIC codes 43, 76, 83, 84, 86, 87, 92, 95, 96, 99.
debt to financing their operations. Corporations in civil law countries also exhibit lower profitability. The later finding suggest that there is not necessarily a tradeoff between riskiness and performance: rather corporations in civil law countries have both higher risk measures and lower profitability measures. Breaking the sample of corporations in civil law countries further down, we find that corporations in Germanic law countries have lower profitability than corporations in other countries; some of the risk measures are also the highest for these corporations. Corporations in Scandinavian law countries have some higher risks measures but score quite high on the three profitability measures, similar to the corporations in civil origin countries.
We next compare countries by the quality of the legal protection offered to creditors. Table 4 shows medians and corresponding z-tests, when we divide the sample into those corporations in countries with good creditor protection (scores of 3 and 4 on creditor rights) and those with bad protection (scores of 0, 1, and 2). The table also presents firm risk and profitability characteristics by the individual creditor protection scores from 0 to 4. The effect of legal protection on firm risk and profitability characteristics are large as well, with firms in countries with less creditor protection generally displaying more risky financing patterns and lower rates of return on assets and equity. Differences are not always significant, however, as was the case for the distinction between civil and common law countries. Specifically, corporations in weak creditor rights countries do not have a significantly higher cash-flow variability. Such corporations do have, however, higher operating leverage ratios. Financial leverage measured by total debt to equity is not higher for corporations in weak creditor rights countries, but leverage as measured by long-term debt to equity ratio is. Corporations in weak creditor rights countries have higher liquidity ratios. Solvency ratios do not differ significantly between the two groups of corporations. Corporations in weak creditor rights countries use to a lesser degree short-term debt to financing their operations. Finally, corporations in weak creditor rights countries exhibit lower profitability. Breaking down results by the specific creditor right index-value, we do not find any monotonic relationships. For some variables, we find a shaped, for other an inverse U-shaped pattern, and for some no pattern at all. This partly reflects differences in sample size across the classes, in the group for creditor rights is 0 we have 677 corporations, in
the next group for creditor rights is 1 we have 3840 corporations. Interpretations would have to be cautious.
We next divide the sample of corporations into those in countries with good minority protection (scores of 4 and 5 on anti-director rights) and those with poor minority rights protection (scores of 0, 1, 2, and 3). Table 5 shows the medians and z-tests for firm risk and profitability characteristics of corporations divided in the two classes of minority protection score. We find that corporations in weak minority rights countries have statistically significant higher cash-flow variability. The two operational leverage measures give different results; corporations in weak minority rights countries appear to have lower sensitivity of operational income to changes in sales, but do not differ in the sensitivity of earnings (before interest and taxes) to changes in sales. All measures of financial leverage are higher for corporations in weaker minority rights countries, and those for liquidity risks are lower, as is the one solvency-measure. Both measures of short-term debt are higher among corporations in weaker minority rights countries. Finally, profitability appears to be higher among corporations in weaker minority rights countries, although not always statistically significant at less than the 10% level. This suggests that there might be tradeoffs between risk and profitability when it comes to minority rights protection.
Breaking down results by the specific minority rights index-values, we do not find many monotonic relationships. For some variables, we find a U-shaped, for other an inverse U-shaped pattern, and for some no pattern at all. For profitability measures, for example, we find that profitability generally increases with the protection of equity rights, however, for the index value of 4, profitability suddenly is less than for equity rights is 3 and 5. We expect that country-effects and other control variables play a role for this particular effect, but also venture that the relationship between firm financing patterns and minority rights is complex.
We use the Demirguc-Kunt and Levine (1999) classification of countries into bank-oriented and market-bank-oriented to explore the relationship with firm risk and profitability characteristics. Table 6 shows medians and z-tests, dividing the sample into corporations in oriented and market-oriented countries. We find that corporations in bank-oriented systems take on more risks. These corporations have statistically significant
higher cash-flow variability, higher operating and financial leverage, and lower liquidity measures. They also appear to be less solvent as their ratio of operational cash-flow to interest payments is lower than that for corporations in market-based countries. Finally, firms in market-based financial systems have higher profitability.
In summary, the results suggest that legal origin, the degree of creditor and minority rights protection and characteristics of the financial system more generally are important in determining risk-taking behavior of corporations. Whether legal origin can explain corporate financing patterns has been recently critiqued by Rajan and Zingales (1999) in a different context. They argue that legal systems are not exogenous to political and other circumstances. Their main argument is that if particular legal systems were so effective, other countries would imitate valuable regulations, and gradually differences in legal systems would disappear. Thus the causality link from legal origin to financial characteristics is disputable. We find that the legal origin is at least as discriminating a factor as the degree of creditor or shareholder protection. In fact, the distinction in legal origin leads more often to statistically significant results than the degree of creditor or minority rights protection; this suggest that there may indeed be an independent effect of legal origin on firm financial characteristics. We find some further support for this as the characterization of countries’ financial system also leads more often to statistically significant results than the degree of creditor or minority rights protection. But, since these results do not control for other firm characteristics, we need to turn to regressions results to investigate this more carefully.
5. Regression results
The results so far provide comparisons of risk and profitability median measures across countries without controlling for firm characteristics. As noted, the corporate finance literature has drawn attention to a number of firms-factors which can affect financing patterns. Not all of these variables have proven to be always robust. In a cross-country paper, Titman and Wessels (1988) use the following controls while examining firm leverage, which we also use the availability of collateral, non-debt tax shields, real firm growth, real firm profitability, industry, and firm size. Some of these controls have also been used by Demirguc-Kunt and Maksimovic (1998).
In all regressions, we eliminated outliers, that is we dropped observations at the 1% level (both tails), to reduce the impact that outliers have in the regressions. We also include country dummies. To simplify the amount of information presented, we use in our regressions only seven of the 14 measures we have, that is we use one measure for each of the seven groups of risk or performance measures. The results for each measure within a class are very similar, however. Table 7 provides the regressions results for the financial leverage ratio, while Table 8 provides all regression results in a summary form, where we report the sign of the coefficients if they are statistically significant, 0 otherwise.
In terms of legal origin, controlling for firm characteristics, the results are the same for the simple z-test comparisons (regression I). Corporations in civil countries have higher cash-flow variability, higher operating and financial leverage, and more short-term debt. They also appear to be less profitability. They do keep more liquidity, however, and are not necessarily less solvent than corporations in common-law countries. This corresponds with the findings of others, most notably La Porta et al. (1998), that legal systems matter for firm financing patterns.
Controlling for individual firm characteristics, the influence of creditor rights on financing patterns is quite different from the simple comparisons: stronger creditor rights are associated with higher firm risk variables, in particular, higher cash-flow risks, financial leverage, and short-term debt (regression III). They also seem to be associated with higher liquidity and lower profitability. There does not appear to be any influence of creditor rights on operational leverage and interest coverage. It is not obvious how to interpret the differences between the simple comparisons and the regressions results. Some of it may be due to the differences in technique. For one, while the z-statistics indicate statistically significant differences between poorer and stronger creditor rights, the absolute differences are not always large, suggesting that it is important to control for other variables. The differences which are consistently statistically significant in the same direction for both exercises (short-term debt and profitability) show the largest differences, confirming the importance of the control variables.
Similar results are obtained when, controlling for firm characteristics, the influence of shareholder rights is studied: stronger equity rights are associated with higher firm risk
variables, in particular, cash-flow risks, financial leverage, and short-term debt (regression II). They also seem to be associated with higher liquidity and lower profitability. There does not appear to be any influence of equity rights on operational leverage and interest coverage. Again, the differences may be due to the differences in technique. Another factor, affecting the results for both creditor and equity rights, may be that these indicators capture the general protection of property rights in the country. With stronger property rights, one could expect that firms are more able to attract external financing, keeping other firm characteristics constant. The larger use of external financing could imply greater financial risks, but these risks may well be more manageable given the greater general degree to enforce property rights and contracts. Put differently, in countries with stronger property rights, one could expect to see firms which use to a greater degree external financing rather than self-financing, which would translate into the measures we use showing greater financial risks.
We also sum creditor and shareholder rights to come up with an investor protection index (regression V). The ratio of creditor to shareholder protection gives us some insights into the relative importance of each. Investor protection appears to increase income variability and leverage, and push companies towards more short-term financing. It also results in less solvency and lower income margins. The higher leverage, implying a higher risk of financial distress, is associated with higher liquidity. The ratio of creditor to shareholder rights has always the same sign as the investor protection variable. This implies that companies have more access to debt when creditor rights are better protected. The interpretation of the coefficient in the other regressions is less straight-forward.
The results for bank- versus market based financial systems are as follows (regression VI). Corporations in bank-based countries have higher cash-flow variability, higher financial leverage, more liquidity and more short-term debt. They also appear to be less solvent than corporations in market-based countries and are less profitable. They do keep more liquidity, which is the only difference with the simple comparisons. These results confirm to our priors: firms in bank-based financial systems rely to a greater degree on (implicit) risk-sharing mechanisms and can thus afford to have higher risks in their financial patterns.
Controlling for legal origin and individual firm characteristics, it appears that there sometimes still is an independent influence of the nature of the financial system market or bank-based on firms’ financing patterns and performance. In particular, we find that firms in civil legal origin countries which are also bank-based systems have higher financial leverage and higher short-term debt. They also have higher liquidity and lower profitability. This suggests that legal origin alone does not determine the financing patterns of firms, as suggested in Rajan and Zingales (1999).
6. Conclusions
The importance of macroeconomic weaknesses, moral hazard, regulatory deficiencies, and the inherent instability of financial markets have been investigated in the literature on explaining financial crises. More recently, corporate sector aspects performance, financial structure, corporate governance rules have been included. In this paper, we investigate how corporate sectors’ financial and operating structures relate to the institutional environment in which they operate. We show that a country’s legal origin, the strengths of its equity and creditor rights, and the nature of its financial system can account for different degrees of corporate risk-taking. In particular, corporations in common law countries and those in market-based financial systems appear less risky. Greater enforcement of property rights is associated with higher measured financial risks. This suggests that the financing patterns of the corporate sector reflects the deeper institutional environment.
Annex: Detailed Data Explanations and Motivations
Risk measures
Earnings variability: one measure is used for cash-flow risks: the relative variability of operating income, defined as the standard deviation of the change in operating income relative to the absolute mean operating income over the period 1991-96. Uncertainty of earnings can create financial risks, including those not being able to meet debt payments on time. Corporations with a higher volatility in operating income may be more susceptible to shocks, including having earnings fall below debt service requirements, resulting in financial distress.
Operating leverage: two measure of operating leverage are used: the percentage change in earnings before interest and taxes (EBIT) as a ratio to the percentage change in sales (%? EBIT / %? sales); and the percentage change in operational income as a ratio to the percentage change in sales (%? OPINC / %? sales). A higher sensitivity of operational income to changes in sales can contribute to firm risk if external financial markets are do not smooth these cash-flow differences, which is likely given the many financial markets imperfections and informational asymmetries, particularly so in poor institutional environments. Corporations whose cash flows are highly sensitive to external shocks may then loose access to the required financing, which may cause financial and operational distress. Suppliers, for example, may cut trade credit to a firm which has experienced a bad economic shock for fear they cannot collect payment if the company goes bankrupt, leading an otherwise viable firm to go bankrupt.
Financial leverage: two financial leverage measures are used: total debt to equity and long-term debt to equity. High financial leverage, and associated high interest payments, will reduce the ability of a corporation to deal with shocks, especially interest rate increases, and possible loan withdrawal by banks. Lenders may further adjust their lending rates when they perceive higher risks of default.
Liquidity: three measures of liquidity are used: the so-calledcurrent ratio, defined as the ratio of current assets (cash, inventory, other working capital and trade receivables) to current liabilities (short-term debt and trade payables); the quick ratio, defined as the ratio of current assets net of inventory to current liabilities; and the short-term financing ratio, defined as the ratio of net working capital (current assets minus current liabilities) to total assets. These liquidity ratios try to capture the corporation’s ability to transform assets and earnings into liquidity quickly, especially important if the company has considerable short term debt or is much exposed to shocks. Again, market imperfections can contribute to an inability of a corporation to transfer (some of) its assets quickly into cash. The current ratio tries to measure the relative magnitude of all assets that the company can transform into cash within a short period of time, and what it owes during that period. The quick ratio recognizes that among current assets, inventories are the least liquid, and compares only the more liquid short-term assets with all short-term liabilities. Finally, net working capital to total assets measures the short-fall between current assets and current liabilities relative to total assets
Over-use of ST debt and roll-overs: two measures are used: the ratio of short-term to long-term debt and the ratio of short-term debt to working capital. Both ratios measure the extent of company usage of short-term debt, comparing it to long term company debt or to net working capital which proxies for expected short-term company liquidity. Short-term debt can be a better monitoring device that alleviates agency problems between shareholders and lenders in a company. However, rolling short-term debt over, in case the funds have been used to finance long-term investments, runs into the risk of causing company bankruptcy, since the long-term investments would be very illiquid. This risk is exacerbated in bad economic times, since lenders would be more concerned with collecting their loans, and would be less willing to roll the debt over.
Solvency: one measure is used, the interest coverage ratio = EBIT / interest expense. This interest coverage ratio is a standard measure of company solvency— the higher the expected cash flows (or future earnings), or the lower the interest payments for debt service, the less likely the company is to default on its debt service. One arguments that
links solvency to poor institutional framework is that profitability in countries with bad institutions is lower, either because of management theft, or because companies do not follow market signals, but instead rely on relationship-based means of conducting business. Alternatively, one could argue that interest expenses are higher in countries with poor institutions, due to company overuse of short-term debt, and the higher required return of creditors who are aware of the short term debt overuse.
Profitability: three measures are used: the net income margin, defined as the ratio of net-income before preferred dividends to sales; the rate of return on equity, defined as the ratio of earnings before interest but after taxes relative to the book value of common equity; and the rate of return on all assets, defined as the ratio of earnings before interest but after taxes relative, with all ratios averaged for 1995-96. The latter two are deflated with the average annual GDP deflator (obtained from IFS), to obtain profitability measures in real terms. The three profitability measures are not influenced directly by financing patterns of the firm as they exclude interest payments. The net income margin is not influenced by inflation.
Controls Variables
Availability of collateral. It is defined as the sum of inventory and gross plant and equipment, relative to total assets. Collateral can influence the degree to which a firm can obtain long-term financing
The presence of non-debt tax shields. Defined as the degree of depreciation relative to total assets. This influences the relative tax-advantages of debt financing.
Industry. We have the two-digit SITC groups for each firm, but this classification is too detailed for our purposes; we use Campbell 1996 to re-classify two-digit SITC to a narrower 12 industry-category, except that we add a 12th category— “other services”, which includes SIC codes 43, 76, 83, 84, 86, 87, 92, 95, 96, 99. Industry-classification matters for financing patterns as it determines the type of activity financed, including the
volatility of the underlying income stream, the degree of informational asymmetries in the management of the particular type of business, etc.
Operating income to total assets. This is deflated using the respective GDP-price index, and is used to control for the profitability of the particular firm.
Growth of total assets. This is also deflated using a GDP-price index, and is used to control for the firm-specific growth opportunities which can influence its financing pattern.
Size. This is defined as the logarithm of the U.S. dollar total assets value of the firms. The U.S. dollar conversion allows comparability across countries. The variables control for the effects of size on firm financing patterns.
Explanatory Variables:
Investor protection quality: legal origin, creditor and shareholder rights
References
Allen, Franklin, and Douglas Gale, 1995, “Welfare comparison of intermediaries and financial markets in Germany and the US,” European Economic Review, 39, No. 2:179-209 February.
___________, 1999, Comparing Financial Systems, MIT Press, Cambridge, forthcoming. Brealy, Richard and Stewart Meyers, 1998, Principles of corporate finance, New York :
McGraw-Hill, 1996.
Campbell, John, 1996, “Understanding Risk and Return”, Journal of Political Economy,
104: 298-345.
Caprio, Gerard, and Asli Demirguc-Kunt, 1997, “The Role of Long-Term Finance: Theory and Evidence”, World Bank Policy Research Working Paper 1746. Chang, Robert and Andres Velasco, 1998, “Financial crises in emerging markets: a
canonical model.” NBER WORKING PAPER SERIES 6606, June.
Claessens, Stijn, Simeon Djankov, and Giovanni Ferri, 1999, “Corporate Distress in East Asia: Assessing the Effects of Interest and Exchange Rate Shocks”, Emerging Markets Quarterly, 3: 8-14.
Corsetti, Giancarlo, Paolo Pesenti, Nouriel Roubini, 1998, “What Causes the Asian Currency and Financial Crises? A Macroeconomic Overview,” New York University, mimeo.
Demirguc-Kunt, Asli and Ross Levine, 1999, “Bank-Based and Market-Based Financial Systems: Cross-Country Comparisons”, World Bank Policy Research Working Paper 2146.
Demirguc-Kunt, Asli, and Maksimovic, Vojislav, 1998, “Law, Finance, and Firm Growth”, Journal of Finance, vol. 53 (6), pp. 2107- 37.
____________, “Institutions, Financial Markets, and Firm Debt”, Journal of Financial Economics, (forthcoming).
Diamond, Douglas, and Philip Dybvig, 1983, “Bank Runs, Deposit Insurance, and Liquidity,” Journal of Political Economy, 91, 3: 401-419.
Edwards, Sebastian, and Julio Santaella, 1993, “Devaluation Controversies in the Developing Countries: Lessons from the Bretton Woods Era,” in Bordo, Michael and Barry Eichengreen, Eds., A Retrospective on the Bretton Woods System: Lessons for International Monetary Reform, University of Chicago Press, Chicago and London.
Eichengreen, Barry, Andrew Rose, and Charles Wyplosz, 1995, “Exchange Market Mayhem: The Antecedents and Aftermath of Speculative Attacks,” Economic Policy, 21: 249-296.
Harris, Milton, and Artur Raviv, 1991, “The Theory of Capital Structure,” Journal of Finance, 46, 1: 297-355.
Johnson, Simon, Peter Boone, Alasdair Breach, and Eric Friedman, 1998, “Corporate Governance in the Asian Financial Crisis, 1997-8”, MIT, mimeo.
Krugman, Paul, 1979, “A Model of Balance-of-Payments Crises”, Journal of Money, Credit, and Banking, 11, 3: 311-325.
____________, 1999, “Balance Sheets, the Transfer Problem, and Financial Crises”, mimeo, MIT (on http://www.mit.edu/krugman/)
La Porta, Rafael, Florencio Lopez-de-Silanes, Andrei Shleifer, Robert Vishny, 1997, “Legal Determinants of External Finance”, Journal of Finance, vol. 52 (3), pp. 1131-50.
____________, 1998, “Law and Finance”, Journal of Political Economy, vol. 106 (6), pp. 1113-55.
____________, 1999b, “Agency Problems and Dividend Policies Around the World,”
Journal of Finance, forthcoming.
____________, 1999b, “Investor Protection: Origins, Consequences, Reform,” Harvard University, mimeo.
La Porta, Rafael, Florencio Lopez-de-Silanes, and Andrei Shleifer, 1999c, “Investor Protection and Corporate Valuation,” Harvard University, mimeo.
Obstfeld, Maurice, 1986, Rational and self-fulfilling balance-of-payments crises.
American Economic Review, 76:72-81, March.
Radelet, Steven, and Jeffrey Sachs, 1998, “The East Asian Financial Crisis: Diagnosis, Remedies, Prospects,” Brookings Papers on Economic Activity, 1: 1-74.
Rajan, Raghuram, and Luigi Zingales, 1995, “What Do We Know About Capital Structure? Some Evidence From International Data”, Journal of Finance, 50, 5: 1421-60.
_____________, 1999, “Which Capitalism? Lessons from the East Asian Crisis”,
Journal of Applied Corporate Finance, April.
_____________, 1999, “The Politics of Financial Development,” mimeo, University of Chicago and NBER.
Stulz, Rene, 1999, “Financial structure, corporate finance, and economic growth,” mimeo, Ohio State University
Titman, Sheridan, and Roberto Wessels, 1988, “The Determinants of Capital Structure Choice”, The Journal of Finance, vol. 43 (1), pp. 1-19.
Wald, John, 1998, “How Firm Characteristics Affect Capital Structures: an International Comparison”, Rutgers University, mimeo.
Table 1: The Sample
Obs. Country samplesize crisis legal origin antidirectorrights creditorrights rule of law oriented bank-system
1 ARGENTINA 25 1 civil law (French) 4 1 5.35 1
2 AUSTRALIA 189 0 common law 4 1 10.00 0
3 AUSTRIA 57 0 civil law (German) 2 3 10.00 1 4 BELGIUM 72 0 civil law (French) 0 2 10.00 1 5 BRAZIL 119 1 civil law (French) 3 1 6.32 0
6 CANADA 403 0 common law 5 1 10.00 0
7 CHILE 48 1 civil law (French) 5 2 7.02 0
8 CHINA 76 0 civil law (German) 1 0 5.83 1
9 COLOMBIA 20 1 civil law (French) 3 0 2.08 1 10 CZECH REPUBLIC 14 1 civil law (German) 2 2 9.03 1 11 DENMARK 121 0 civil law (Scandinavian) 2 3 10.00 0 12 FINLAND 79 0 civil law (Scandinavian) 3 1 10.00 1 13 FRANCE 428 0 civil law (French) 3 0 8.98 1 14 GERMANY 414 0 civil law (German) 1 3 9.23 1 15 GREECE 94 0 civil law (French) 2 1 6.18 1
16 HONG KONG 182 1 common law 5 4 8.22 0
17 HUNGARY 14 0 civil law (German) 3 2 8.15 1
18 INDIA 283 0 common law 5 4 4.17 1
19 INDONESIA 104 1 civil law (French) 2 4 3.98 1
20 IRELAND 46 0 common law 4 1 7.80 1
21 ISRAEL 28 0 common law 3 4 4.82 1
22 ITALY 125 0 civil law (French) 1 2 8.33 1 23 JAPAN 2116 1 civil law (German) 4 2 8.98 1 24 KOREA (SOUTH) 214 1 civil law (German) 2 3 5.35 0
25 MALAYSIA 253 1 common law 4 4 6.78 0
26 MEXICO 68 1 civil law (French) 1 0 5.35 0 27 NETHERLANDS 152 0 civil law (French) 2 2 10.00 0
28 NEW ZEALAND 37 0 common law 4 3 10.00 1
29 NORWAY 85 0 civil law (Scandinavian) 4 2 10.00 1
30 PAKISTAN 72 0 common law 5 4 3.03 1
31 PERU 21 0 civil law (French) 3 0 2.50 0
32 PHILIPPINES 64 1 civil law (French) 3 0 2.73 0 33 POLAND 36 0 civil law (German) 3 2 7.52 1 34 PORTUGAL 53 0 civil law (French) 3 1 8.68 1
35 SINGAPORE 158 0 common law 4 4 8.57 0
36 SOUTH AFRICA 139 0 common law 5 3 4.42 0
37 SPAIN 97 0 civil law (French) 4 2 7.80 1
38 SRI LANKA 12 0 common law 3 3 1.90 1
39 SWEDEN 143 0 civil law (Scandinavian) 3 2 10.00 0 40 SWITZERLAND 117 0 civil law (German) 2 1 10.00 0 41 TAIWAN 177 0 civil law (German) 3 2 8.52 1
42 THAILAND 190 1 common law 2 3 6.25 0
43 TURKEY 38 0 civil law (French) 2 2 5.18 0 44 UNITED KINGDOM 1124 0 common law 5 4 8.57 0 45 UNITED STATES 2715 0 common law 5 1 10.00 0 46 VENEZUELA 11 1 civil law (French) 1 n.a. 6.37 1
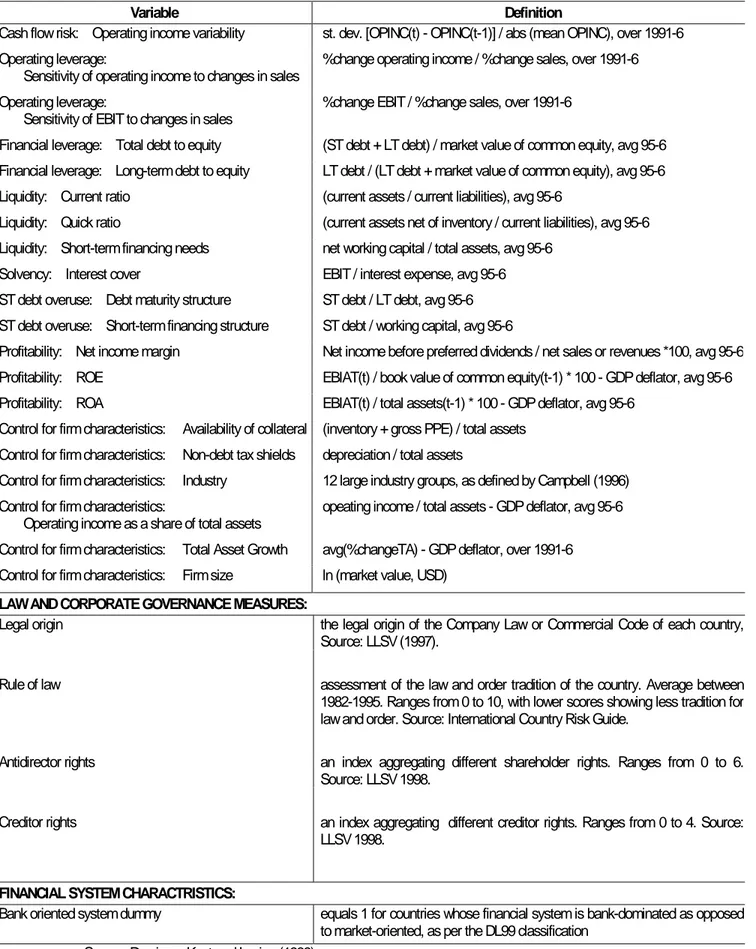
Table 2: Firm-Level Risk Measures and Control Variables
Variable Definition
Cash flow risk: Operating income variability st. dev. [OPINC(t) - OPINC(t-1)] / abs (mean OPINC), over 1991-6 Operating leverage:
Sensitivity of operating income to changes in sales %change operating income / %change sales, over 1991-6 Operating leverage:
Sensitivity of EBIT to changes in sales %change EBIT / %change sales, over 1991-6
Financial leverage: Total debt to equity (ST debt + LT debt) / market value of common equity, avg 95-6 Financial leverage: Long-term debt to equity LT debt / (LT debt + market value of common equity), avg 95-6 Liquidity: Current ratio (current assets / current liabilities), avg 95-6
Liquidity: Quick ratio (current assets net of inventory / current liabilities), avg 95-6 Liquidity: Short-term financing needs net working capital / total assets, avg 95-6
Solvency: Interest cover EBIT / interest expense, avg 95-6 ST debt overuse: Debt maturity structure ST debt / LT debt, avg 95-6 ST debt overuse: Short-term financing structure ST debt / working capital, avg 95-6
Profitability: Net income margin Net income before preferred dividends / net sales or revenues *100, avg 95-6 Profitability: ROE EBIAT(t) / book value of common equity(t-1) * 100 - GDP deflator, avg 95-6 Profitability: ROA EBIAT(t) / total assets(t-1) * 100 - GDP deflator, avg 95-6
Control for firm characteristics: Availability of collateral (inventory + gross PPE) / total assets Control for firm characteristics: Non-debt tax shields depreciation / total assets
Control for firm characteristics: Industry 12 large industry groups, as defined by Campbell (1996) Control for firm characteristics:
Operating income as a share of total assets opeating income / total assets - GDP deflator, avg 95-6 Control for firm characteristics: Total Asset Growth avg(%changeTA) - GDP deflator, over 1991-6 Control for firm characteristics: Firm size ln (market value, USD)
LAW AND CORPORATE GOVERNANCE MEASURES:
Legal origin the legal origin of the Company Law or Commercial Code of each country, Source: LLSV (1997).
Rule of law assessment of the law and order tradition of the country. Average between 1982-1995. Ranges from 0 to 10, with lower scores showing less tradition for law and order. Source: International Country Risk Guide.
Antidirector rights an index aggregating different shareholder rights. Ranges from 0 to 6. Source: LLSV 1998.
Creditor rights an index aggregating different creditor rights. Ranges from 0 to 4. Source: LLSV 1998.
FINANCIAL SYSTEM CHARACTRISTICS:
Bank oriented system dummy equals 1 for countries whose financial system is bank-dominated as opposed to market-oriented, as per the DL99 classification
Table 3: Civil vs. Common Law Origin
Civil by origin:
Common Civil Z-test
French German Scandinavian
Number of Observations 5831 5202 1539 3235 428
Cash flow risk: Operating income variability 0.4023 0.4804 -8.6630a 0.6085 0.4190 0.6361 Operating leverage:
Sensitivity of operating income to changes in sales
1.1535 1.3527 -2.9300a 1.0344 1.5784 1.4719
Operating leverage:
Sensitivity of EBIT to changes in sales
1.0708 1.1720 -2.8880a 1.0699 1.2547 1.6020
Financial leverage: Total debt to equity 0.2032 0.4256 -24.6630a 0.4124 0.4415 0.3821
Financial leverage: LT debt to equity 0.0991 0.1559 -13.5860a 0.1421 0.1581 0.1912
Liquidity: Current ratio 1.6529 1.4243 14.8230a 1.4316 1.3852 1.6750
Liquidity: Quick ratio 1.0944 1.0104 7.6520a 0.9854 1.0092 1.1161
Liquidity: ST financing needs 0.1807 0.1498 9.6160a 0.1430 0.1492 0.1929
Solvency: Interest cover 4.7886 3.3796 9.5710a 3.3408 3.2913 4.3027
ST debt overuse: Debt maturity structure 0.3583 1.0440 -27.5480a 0.9700 1.2068 0.3185
ST debt overuse: ST financing structure 0.0794 0.2690 -13.9450a 0.3269 0.2559 0.1866
Profitability: Net income margin 4.5854 1.9555 20.0390a 3.5119 1.3805 4.5214
Profitability: ROE 12.6791 5.7955 23.0070a 9.8398 4.3055 13.5812
Table 4: Creditor Protection
poor (0,1,2) good (3,4) z-test cred=0 cred=1 cred=2 cred=3 cred=4
Number of Observations 7634 3388 677 3840 3117 2204 1184
Cash flow risk: Operating income variability 0.4442 0.4306 1.1970 0.5913 0.4646 0.4008 0.3829 0.5456 Operating leverage:
Sensitivity of operating income to changes in sales 1.2885 1.0671 2.5960
a 1.0169 1.2174 1.5538 1.1267 0.9847
Operating leverage:
Sensitivity of EBIT to changes in sales 1.1787 0.9970 2.1600
b 1.1238 1.1417 1.2690 1.0133 0.9769
Financial leverage: Total debt to equity 0.2920 0.2966 -2.7230a 0.4247 0.2043 0.3791 0.2390 0.5273
Financial leverage: LT debt to equity 0.1320 0.1090 3.5790a 0.1538 0.1189 0.1401 0.0851 0.1861
Liquidity: Current ratio 1.6028 1.4019 13.3780a 1.4094 1.9111 1.3911 1.3873 1.4393
Liquidity: Quick ratio 1.1209 0.9177 17.8510a 0.9757 1.2558 1.0374 0.9310 0.8947
Liquidity: ST financing needs 0.1774 0.1417 9.4010a 0.1451 0.2152 0.1458 0.1338 0.1563
Solvency: Interest cover 4.0469 3.9946 -0.5710 3.2915 4.4714 3.7952 4.8907 2.7872 ST debt overuse: Debt maturity structure 0.5769 0.9776 -16.5440a 1.0166 0.2177 1.0850 0.9300 1.0400
ST debt overuse: ST financing structure 0.1160 0.2154 -5.2300a 0.3653 0.0589 0.2411 0.2313 0.2014
Profitability: Net income margin 2.7523 4.1082 -10.8630a 3.6864 4.0916 1.6655 5.1407 2.2732
Profitability: ROE 7.6754 11.5291 -12.7650a 9.4217 11.8241 4.8305 13.5707 9.1691
Table 5: Shareholder Protection
poor (0-3) good (4, 5) z-test inv0 inv1 inv2 inv3 inv4 inv5
Number of Observations 3061 7972 72 694 1101 1194 3006 4966
Cash flow risk: Operating income variability 0.5955 0.3916 15.1410 a 1.0577 0.8675 0.4594 0.6568 0.3787 0.4015
Operating leverage:
Sensitivity of operating income to changes in sales 1.0453 1.2645 -2.5580
b 1.0006 0.9523 1.0271 1.2283 1.5589 1.1775
Operating leverage:
Sensitivity of EBIT to changes in sales 1.0736 1.1386 0.3810 0.7705 1.0774 0.9765 1.2542 1.2397 1.1047 Financial leverage: Total debt to equity 0.4554 0.2541 18.8020 a 0.4235 0.4521 0.6222 0.3689 0.3529 0.1948
Financial leverage: LT debt to equity 0.1600 0.1139 10.0870 a 0.1763 0.1361 0.1990 0.1384 0.1366 0.1009
Liquidity: Current ratio 1.4743 1.5577 -5.5190 a 1.3330 1.5560 1.4325 1.4794 1.3560 1.7007
Liquidity: Quick ratio 0.9792 1.0783 -8.8310 a 0.9452 1.0156 0.9234 1.0103 1.0275 1.1261
Liquidity: ST financing needs 0.1583 0.1695 -4.2080 a 0.1422 0.1890 0.1474 0.1502 0.1322 0.1983
Solvency: Interest cover 3.1704 4.4760 -9.4590 a 3.7989 3.0674 2.8378 3.6266 3.9366 4.8434
ST debt overuse: Debt maturity structure 0.9679 0.5759 15.4040 a 0.7129 1.0961 1.0544 0.8398 1.0908 0.3128
ST debt overuse: ST financing structure 0.2902 0.1054 10.6940 a 0.3934 0.2420 0.3020 0.2912 0.2150 0.0727
Profitability: Net income margin 3.3139 3.1041 1.9770a 2.5233 2.3941 3.4097 3.8764 1.6730 4.3793
Profitability: ROE 9.5319 8.5424 1.7160c 9.4033 8.7966 10.1959 9.4689 4.7174 13.1066
Table 6: Market vs. Bank-Centered Systems
Market Bank z-test
Number of Observations 6458 4575
Cash flow risk: Operating income variability 0.4285 0.4557 -5.3110a
Operating leverage: Sensitivity of operating income to changes in sales 1.1410 1.4284 -3.7620a
Operating leverage: Sensitivity of EBIT to changes in sales 1.0779 1.2026 -2.9550a
Financial leverage: Total debt to equity 0.2193 0.4159 -20.5910a
Financial leverage: LT debt to equity 0.1065 0.1506 -9.7430a
Liquidity: Current ratio 1.6358 1.4133 13.4390a
Liquidity: Quick ratio 1.0859 1.0083 6.9910a
Liquidity: ST financing needs 0.1782 0.1505 7.9950a
Solvency: Interest cover 4.5711 3.4278 6.7530a
ST debt overuse: Debt maturity structure 0.4098 1.0657 -26.3010a
ST debt overuse: ST financing structure 0.0822 0.2911 -14.9020a
Profitability: Net income margin 4.2218 1.9655 16.5230a
Profitability: ROE 11.9622 5.5952 21.5850a
Table 7: Regression Analysis on Financial Leverage
Explanatory Variable I II III IV V VI
civil legal origin 0.8593 (5.14) 0.7645 (8.15) antidirector rights 0.2148 (5.14) creditor rights 0.2337 (7.28) investor rights 0.1482 (9.28) creditor rights over antidirector rights 0.1617
(5.53)
bank oriented system 0.8593
(5.12)
0.5663 (5.53) Availability of collateral 0.6820
(16.83) 0.6820(16.83) 0.6819(16.83) (16.83)0.6820 (16.83)0.6820 (16.71)0.6792 Non-debt tax shield -1.1074
(-16.93) -1.1074(-16.92) -1.1052(-15.46) (-16.94)-1.1074 (-16.93)-1.1074 (-16.27)-1.0952 Operating income as a share of total assets -1.5867
(-15.93) -1.5867(-15.92) -1.5904(-15.96) (-15.91)-1.5867 (-15.92)-1.5867 (-15.80)-1.5760 Market capitalization -0.0528
(-11.729) -0.0528(-11.72) -0.0521(-11.54) (-11.729)-0.0528 (-11.78)-0.0528 (-11.64)-0.0524 Total asset growth -0.2036
(-5.21) -0.2036(-5.12) -0.2017(-5.17) -0.2036(-5.21) -0.2036(-5.21) -0.1972(-5.02)
Country dummies Yes Yes Yes Yes Yes Yes
Industry dummies Yes Yes Yes Yes Yes Yes
Number of Observations 9043 9043 9035 9043 8955 9043
Table 8: Further Regression Analysis
Dependent variable Explanatory Variables I II III IV V VI
Cash flow risk: Operating income variability
civil legal origin + 0
antidirector rights +
creditor rights +
investor rights +
creditor rights over antidirector rights +
bank oriented system + +
Operating leverage: Sensitivity of EBIT to changes in sales
civil legal origin + +
antidirector rights 0
creditor rights 0
investor rights 0
creditor rights over antidirector rights 0
bank oriented system 0 0
Financial leverage: Total debt to equity
civil legal origin + +
antidirector rights +
creditor rights +
investor rights +
creditor rights over antidirector rights +
bank oriented system + +
Liquidity: Current ratio
civil legal origin + +
antidirector rights +
creditor rights +
investor rights +
creditor rights over antidirector rights +
bank oriented system + +
Solvency: Interest cover
civil legal origin 0 0
antidirector rights 0
creditor rights 0
investor rights
-creditor rights over antidirector rights
-bank oriented system -
-ST debt overuse: Debt maturity structure
civil legal origin + +
antidirector rights +
creditor rights +
investor rights +
creditor rights over antidirector rights +
bank oriented system + +
Profitability: Net income margin
civil legal origin -
-antidirector rights
-creditor rights
-investor rights
-creditor rights over antidirector rights
-Figure 1: International Comparison of Financial Leverage 0.00 0.50 1.00 1.50 2.00 2.50 3.00 SOUTH AFRICA TURKEY PERU POLAND MALAYSIA US GREECE HUNGARY UK TAIWAN AUSTRALIA SINGAPORE CHILE CZECH REP PHILIPPINES NETHERLANDS SWEDEN NEW ZEALAND CANADA SRI LANKA IRELAND SPAIN ISRAEL DENMARK ARGENTINA MEXICO GERMANY VENEZUELA HONG KONG BELGIUM JAPAN AUSTRIA COLOMBIA FRANCE SWITZERLAND INDIA CHINA INDONESIA NORWAY FINLAND PORTUGAL ITALY THAILAND BRAZIL PAKISTAN KOREA (SOUTH)