Integrating Block Layout Design and Location of Input and
Output Points in Facility Layout Problems
Ashok Srinivasan
A Thesis in the
Department of Mechanical and Industrial Engineering
Presented in Partial Fulfillment of the Requirements for the Degree of Master of Applied Science in Industrial Engineering
Concordia University
Montreal, Quebec, Canada
September 2014
CONCORDIA UNIVERSITY
School of Graduate Studies
This is to certify that the thesis prepared By: Ashok Srinivasan
Entitled: “Integrating Block Layout Design and Location of Input and Output Points in Facility Layout Problems”
and submitted in partial fulfillment of the requirements for the degree of Master of Applied Science in Industrial Engineering
complies with the regulations of the University and meets the accepted standards with respect to originality and quality.
Signed by the final examining committee:
Chair Dr. R. Sedaghati Examiner Dr. M. Chen Examiner Dr.C Wang
Concordia Institute for information system Engineering External Supervisor Dr. I. Contrearas
Co – Supervisor Dr. A. Awasthi
Approved by:
Dr. S. Narayanswamy, MASc Program Director Department of Mechanical and Industrial Engineering
Dr. Amir Asif, Dean
Faculty of Engineering & Computer Science Date:
Abstract
Integrating Block Layout Design and Location of Input and
Output Points in Facility Layout Problems
Ashok Srinivasan
A well designed facility layout consists of an adequate arrangement of departments and an efficient material handling system that minimizes the total material handling cost between departments. Block layout design and input and output (I/O) points location are the two major decisions in that need to be made when designing the layout of a facility. Although both decisions are interrelated, the classical approach to facility layout design is to consider them independently. In this thesis, an integrated approach to design the block layout and to locate the I/O points is presented. In particular, we consider three different cases: (i) block layout design with fixed I/O points, (ii) block layout design with flexible I/O points, and (iii) block layout design with flexible department shapes and flexible I/O points. Four mixed integer programming (MIP) formulations are presented for these facility layout problems, with the objective of minimizing the total material handling cost. A case study of a manufacturing company is used to evaluate the performance of the proposed models. A comparison is performed between the existing and proposed layouts. These proposed layouts provide estimated savings of 50% and more as compared with the existing layout.
Acknowledgements
I would like to take this opportunity to thank those who made this thesis possible. First of all my supervisors, Dr. Ivan Contreras and Dr. Anjali Awasthi for their willingness to be my supervisors and for all their guidance and encouragement throughout this research. I am much honored to become their student.
Glory be to the almighty God who has been the sources my health and strength. I would like to express my gratitude to Mr. Pedro Acosta, Industrial supervisor, who providing the necessary data and information on time and arranged everything to make this thesis possible and whom I enjoyed discussing my work with.
I look back the whole master program with a smile and confidence for the fact that I have learnt a lot; I have gained useful knowledge and work and life experience that have made me look the future with pride and optimism. I am also left with the enduring memories of the city of Montreal, the city I have experienced another facet of life in.
My sincere thanks to my parents, my brother Dr. Anand Srinivasan and my girlfriend Neerajha who supported and encouraged me for all my work to become successful in life.
.
Table of Contents
Chapter 1: Introduction………..1
Chapter 2: Literature Review………..………...………...5
Chapter 3: Classical Layout Models and Mathematical Formulation……….12
3.1 Layout design with fixed shape and flexible orientation ………...………..…….12
3.2 Layout design with fixed shape and fixed I/O points ………16
3.3 Layout design with fixed shape and flexible I/O points ………20
3.4 Layout design with flexible shape and flexible I/O points………..…..23
Chapter 4: Results and Discussion………...27
4.1 Overview of the Existing Layout………...27
4.2 Alternate Layout Models………...30
4.3 Comparisons of layout designs………...………...36
Chapter 5: Conclusion and Recommendation………....39
Reference ………...40
List of Figures
Figure 1. Systematic Layout Planning………6
Figure 2. (a)Discrete layout, (b) Continuous layout………...8
Figure 3. Department separation (a) Horizontal axis, (b) Vertical axis……….….14
Figure 4. I/O point location………....17
Figure 5. Coordinates of department………...21
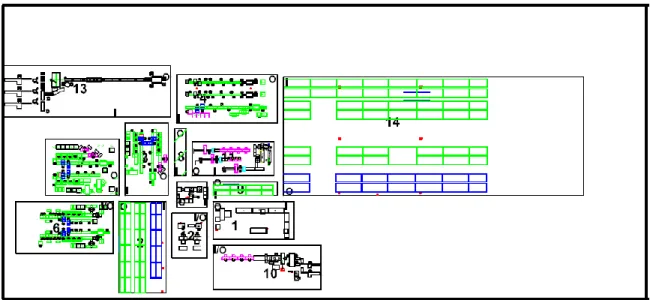
Figure 6. Current layout of the company………...28
Figure 7. Block layout model from FLP1……….31
Figure 8. Block layout model from FLP2……….33
Figure 9. Block layout model from FLP3………...34
Figure 10. Block layout model from FLP4………...35
List of Tables
Table 1.Department dimensions ... 28
Table 2.From to Chart of the departments ... 29
Table 3.Current Layout distance Matrix ... 30
Table 4.FLP 1 distance matrix ... 32
Table 5. FLP 2 distance matrix ... 33
Table 6. FLP 3 distance matrix ... 34
Table 7. FLP 4 distance matrix ... 35
Table 8. Summary table ... 38
1
Chapter 1: Introduction
In today’s competitive market manufacturing industries have to satisfy more diverse queries such as various product range and increased quality. Production consists of a sequence of operations that transform materials from a given to a desired form. These transformations can be made in many ways: (1) transformation by disintegration, (2) transformation by integration or assembly, or (3) transformation by service. Despites various transformations there are four major ways in measuring the performance of the factory, which are quality, quantity, time, and price (Eilon, 1962). The overall performance of the manufacturing company is significantly affected by the design of the manufacturing facility. A facility is a group of entities like manufacturing cells, machine shops, departments, warehouse, among others that facilitates the performance of any job. The optimal design of the physical layout is one of the most important issues to be considered in the early stages of the design of manufacturing system. Tompkins et al. (1996) estimated that 20-50 % of the total operating expenses within manufacturing system are due to material handling and these cost can be reduced to 10-30 % through a good layout planning. In addition to less material handling cost, good facility layout planning will in turn lead to low work-in-progress, decreased cycle time and improves on-time delivery performance (Ioannou, 2007).
2
optimize the material flow is called the facility layout problem (FLP). FLP can be classified in to static and dynamic layout problems. In static layout, it is assumed that the demand for the product remains constant over a long period of time but manufacturing plant must be able to respond quickly to change demand, product volume. However, change in product mix causes to modify the production flow and thus affects the layout (Page, 1991). Thus the dynamic nature of the problem has to be considered to take in to account possible changes in the material handling flow over multiple periods.
FLP can also be classified into discrete and continuous models. Discrete FLP assume equal size departments and the departments can only be assigned to predefine grid locations, where as in continuous FLPs all the departments can be placed anywhere within the facility but must not overlap each other (Drira et al., 2007; Das, 1993). Facility layout design has been an active research area for more than four decades and various optimal and heuristic techniques have been developed to design the layout. The output of FLPs is a block layout, which specifies the relative location of each department inside the facility. If the facility size and shape are given, then the three principal decisions in the facility layout design problem are: (1) the determination of the shapes and locations of departments within the facility, which is called the conceptual block layout problem; (2) the determination of the locations of
3
the input and output (I/O) points on the perimeter of each department; and (3) the design of the material flow paths or aisles that connect these I/O points. Although these three problems are closely related, traditionally they have been solved separately in a sequential manner because of the computational intractability of the integrated design problem (Meller and Gau, 1996; Kim and Goetschalckx, 2005).
In this thesis we present several models to determine the optimum arrangement of departments in a two-dimensional layout, with enhanced assumptions that the departments can be oriented in both x-axis and y-axis and no department redundancy. In particular, we study FLPs that integrate both block layout and location of input and output point’s decisions simultaneously by considering three different cases: (i) block layout design with fixed I/O points, (ii) block layout design with flexible I/O points, and (iii) block layout design with flexible department shapes and flexible I/O points. Mixed integer linear programing (MILP) formulations are presented for each variant of the problem. A general purpose MIP solver is used to solve them. In order to assess the usefulness of the proposed FLPs and their formulations, we present a case study of a manufacturing company which manufactures and supplies different varieties of Canvas. Due to confidential reason we mention the name of the company as “ABC”
4
existing production layout. The thesis focuses on identifying and suggesting the best layout that suits the flow of material over a planning horizon. A single floor 2D plant is considered over a continuous space and equipment items are described by rectangular shapes and each equipment space is assumed to involve a central unit of operation. Systematic layout planning is followed as a procedural solution approach for determining the location of departments, the location of I/O points for each department, and the design of flow path between departments. The objective is to minimize the total material handling cost to route the products between departments.
The reminder of the thesis is structured as follows. Related literature that focuses on facility layout design and trends in facility layout research are discussed in Chapter 2. In Chapter 3 the studied problems are formally defined and the mathematical programing formulations are given. In Chapter 4 the performance of the proposed models are tested by presenting and evaluating alternative layout designs for ABC. Finally, Concluding remarks and future research directions are provided in Chapter 5.
5
Chapter 2: Literature Review
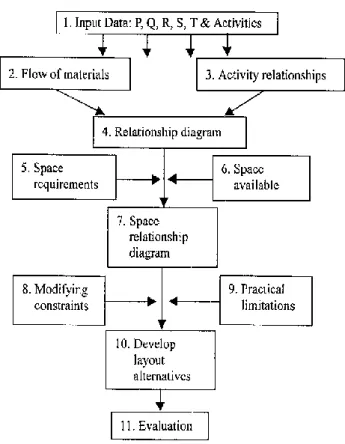
The facility (or plant) layout problem (FLP) is concerned with the arrangement of physical facilities within given area in a way to minimize the total material handling cost. The design of optimal layouts is one of the issues to be considered in the early stages of the design of a manufacturing system. Some classifications of layout types used in the manufacturing system are process layout, product layout, and fixed-position layout. The departments can be arranged in single-row, multi-row and circular, using these layout types (Solimanpur et al., 2005). Enforcing departments to be arranged in a pre-specified shape may increase the total distance travelled by the materials. In fact, the layout shapes mentioned above are specific forms of the layout problem called the two-dimensional layout (TDL) (Heragu and Kusiak, 1991). In TDL, the arrangement of departments is not by the layout shapes. Instead, Muther (1973) developed an approach called systematic layout planning (SLP) to design the layout to minimize the total distance travelled between the departments. SLP is a step by step approach and uses three phases to locate the departments in the layout such as analysis, search, and evaluation determining the location of the areas where the facilities will be laid out, establishing general overall layout, establishing the layout plans and installing the selected layout. Figure 1 outlines SLP procedure. It begins with the analysis of the data collection.
6
In Step 2 and 3, based on the input data and an understanding of the roles and relationships between activities, a material flow analysis (From- to chart) and an activity relationship analysis are performed, from the analysis performed a relationship diagram is developed. Step 4 positions department spatially, those departments that have a strong interaction or close relationship are placed in proximity. Step 5 and 6 determine the amount of floor space to be allocated to each department. The ‘space relationship diagram’ adds departmental size information into the relationship diagram from Step 4. Additional design constraints and limitation are considered before the start of block layout generation in Steps 8 and 9.
7
Step 10 then develops layout alternatives as design candidates. Step 11 chooses the final design with the detailed layout of the facilities (Tompkins et. al, 2003). This includes locating the input/output locations, providing the layout and location of specific machines and equipment’s within the departments, determining the flow of materials between departments.
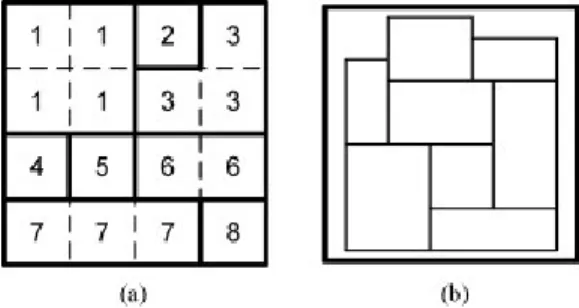
On average, 40% of a company's sales come from new products. However, the change in product mix causes modification of the production flow and thus affects the layout, so the layout design should be flexible to respond to known and future product demands (Page, 1991). Webster and Tyberghein (1980) consider the most flexible layout to be the one with the lowest material handling cost over a number of demand scenarios. A number of authors have tried to take such an important issue into account when designing the layout (Das, 1993; Kim and Kim, 2000; Moghaddam et. al, 2007).The dynamic nature of the problem can be mathematically formulated as either discrete or continuous formulation. The layout is sometime considered as discrete (see Figure 2 (a)) in which the plant site is divided into rectangular blocks with the same area and shape, and each block is assigned to a department (Fruggiero et. al, 2006). If departments have unequal areas they will occupy different blocks (Wang et. al, 2005). A discrete representation of the layout is commonly used for dynamic layout problems where equal sized department must respect constrains ensuring that exactly one department is assigned to each location at each period
8
(Baykasoglu and Gindy, 2001). It is difficult to model some specific constrains like orientation of facilities, I/O points or clearance between departments using a discrete representation (Drira et. al, 2007). In such cases continuous representation of layout is more relevant (see Figure 2 (b)). In continuous representation all the department are placed anywhere within the planar site without overlapping each other and the department are located either by their centroid coordinates or by the coordinates of bottom-left corner, length and width of the department (Das, 1993). These problems have been extensively studied and are known to be NP-hard (Meller and Gau, 1996).
The unequal area requirements with continuous department positions make the block layout design problem extremely challenging to solve (Castillo et. al, 2005). Locating unequal area in the facility was first formulated by Armour and Buffa (1963) and is concerned with finding the most efficient arrangement of a given number of departments
9
with unequal area requirement within a facility. There were many efforts taken to solve the problem to optimally using mathematical programming formulations. Montreuil (1990) proposed a mixed integer program for the problem and used linear constrains to approximately model the area of the departments. Meller et al (1999) suggest tighter linear constraints for satisfying areas of departments and propose general classes of valid inequalities that can be used in a branch-and-bound algorithm. An enhanced MIP for the block layout problem was presented by Sherali et al (2003) in which the polyhedral outer approximation method is used to approximate areas of departments more accurately. However, even for instances that are far smaller than the average industrial case, it is still difficult and time-consuming to solve these MIP to optimality.
The objective of the layout design problem is to minimize the cost associated with projected interactions between departments, where the cost is calculated as the rectilinear distance between the centers of department pairs or the material transportation distance from output (pick up) point of a department to input (drop off) point of another department (Meller and Gau, 1996; Castillo et al., 2005). It is commonly assumed that I/O points of each department are located at the centroid of that department and the centroid-to-centroid rectilinear distance is used to calculate the material flow distance between the departments. These assumptions are clearly violated in most real-life layouts and it is much more realistic to assume that the I/O points of departments we located on the boundaries of the
10
departments and that material is moved along flow paths connecting them. Therefore, the generation of block layouts based on rectilinear centroid-to-centroid distances may generate significantly inferior layouts, as compared with layout based on boundary locations of I/O points (Kim and Goetschalckx, 2005).
Integrating more than two components (block layout problem, I/O location problem, and flow path design problem) while designing a facility layout has rarely been considered because of the computational difficulties. Some authors have presented models by taking out critical assumptions to reduce the computational complexity. Ho and Moodie (2000) develop a constructive heuristic algorithm by considering the midpoint of each department as a candidate location of I/O points to locate the block layout and flow paths simultaneously. Aiello et al. (2002) develop an integrated approach to design the facility layout and the material handling system by means of a flexible bay structure, in which two departments share the same boundary and each department is assumed to have only one pickup and delivery station and the flow path is assumed to be unidirectional. A number of authors develop models to simultaneously locate the block layout and P/D station simultaneously by assuming that the material flows through a single loop path (Bannerjee and Zhou, 1995; Farahani, et al., 2007; Sedehi and Farahani, 2009). However, there are various disadvantages of a single loop system as compared with a bi-directional system in real applications. For instance a vehicle failure makes the complete system unusable and
11
the vehicle has to travel in one direction so once a station is passed the vehicle has to travel the complete loop before it can reaches the station again, finally the throughput of the system will be lower. An integrated approach to locate the block layout and P/D stations simultaneously using heuristic and tabu search algorithm is suggested by (Chittratanawat and Noble, 1999), however the model assumes that all departments have equal area.
12
Chapter 3: Classical Layout Models and Mathematical Formulation
In this section we formally define the proposed FLPs and present four MILP formulations to determine the optimum arrangement of departments in a continuous two dimensional layout. The assumptions and mathematical notation required for defining the problems are then summarized. In Section 3.1, we show the basic model of determining the block layout with fixed shapes and different orientations. In Section 3.2, we show a block layout model that integrates both the block layout and location of I/O points simultaneously by considering fixed locations of pick up and drop off points. In Section 3.3, we determine the block layout design considering the flexible location of I/O points. In Section 3.4 we show a facility layout model to design the block layout and I/O points simultaneously considering flexible shapes for the department and flexible locations of I/O points.
3.1 Layout design with fixed shape and flexible orientation
To find the position of departments with unequal area requirements within the facility and with guaranteed minimum distance between departments for safety and operability conditions, the input parameters used for the problem are:
N = Number of departments.
13 L = Length of the facility in x- axis (in feet).
= Dimension of the department i in x-axis. = Dimension of the department i in y-axis. Material flow between the departments i to j. Z = Minimum distance between departments.
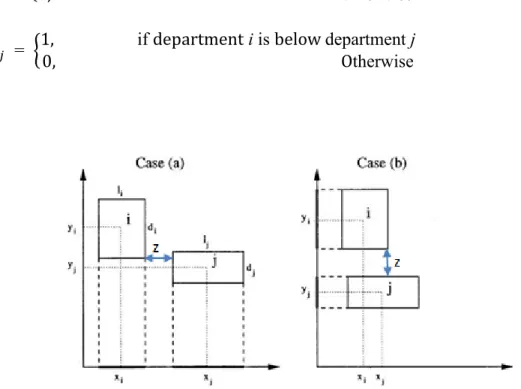
The assumptions in the facility layout problem with fixed shape and flexible orientation (FLP 1) are as follows. The dimensions (W, L) of the floor area on which the departments are placed are given. The departments have a predetermined rectangle shape with different area. Departments are to be located in a restricted area and demand for each product is known. Departments can be oriented in both directions (Papageorgiou and Rotstein, 1998) and two departments cannot occupy the same physical location and they have to be separated either in a horizontal or vertical direction as shown in Figure 3.
The FLP 1 can be formulated by using the following set of decision variables: = Centroid x coordinate of department i in x- axis.
= Centroid y coordinate of department i in y-axis.
Distance between centroid of department i and j along x-axis. Distance between centroid of department i and j along y-axis. = Actual length of department i.
14 = Actual depth of department i.
= if there is no change in orientation in department therwise
= if is to the left of department therwise
= if is department therwise
Using these sets of decision variables, FLP 1 can be formulated as: Minimize (1) Subject to = a + b (1- ) = a + b -
15 - - - - - + L (1 - ) + ) /2 + Z - + W (1 - ) + ) /2 + Z + + + 1 + 1 + 1 ( /2) L - ( /2) ( /2) (15) W - ( /2) (17) (18) (19) (20)
The objective function (1) is defined as the minimization of the total rectilinear distance travelled between department centroids of all pairs of departments with positive interdepartmental flow. The length and depth of the department are calculated using the binary orientation variable and using constraints (2)-(3). Constraints (4)-(7) are used to calculate the distance between two departments. Two departments i and j cannot occupy the
16
same physical location and they have to be separated either in a horizontal or vertical direction. Constraints (8)-(9) are the non-overlapping constrains, stating that if the distance between the center of the two departments on the vertical axis is less than the sum of their height plus z then constraint (8) is active and the departments cannot overlap in the horizontal axis (see Figure. 3(a)). Similarly, if the distance between the centers of two departments on the horizontal axis is less than the sum of the width plus z then constraint (9) is active and the departments cannot overlap on the vertical axis (see Fig. 3(b)). Constraints (13)-(16) are written in order to avoid infeasible department allocations. Lower and upper bounds on the department coordinates are defined to restrict the departments to be within a pre-determined area.
3.2 Layout design with fixed shape and fixed I/O points
In the case of the FLP 1, the I/O points are assumed to be the centroids of each department and the centroid-to-centroid rectilinear distance is used to calculate the material flow cost between the departments. This assumption is violated in most real-life applications as it is not advisable to have the I/O points at the centroid since it increases the distance travelled between departments. This limitations is addressed in the facility layout problems with fixed shape and fixed I/O points (FLP 2)
In order to find the location of the rectangular departments in which each department has an I/O point whose locations in the department are pre-defined, the input parameters
17
used for the problem are the ones considered previously in FLP1 and :
The relative distance in x and y direction from the input point of the department i to the centroid of the department i.
The relative distance in x and y direction from the output point of the department i to the centroid of the department i.
In FLP 2 we assume that the location of the I/O points of any department is from a fixed distance from the centroid of that department. The I/O points are located in the boundaries of the departments. The departments are placed horizontally or vertically if the long side of it is parallel to x or y- axis .In this case, there are now four different orientations for each department as shown in Figure 4.
The departments shown in Figure 4 are those that can be obtained if the department remains the same or rotated 90 , 180 and 270 clockwise, respectively. Without loss of generality, we assume that the department is initially is in its basic orientation i.e, without
Input Point Output Point Figure 4. I / O point location
18
rotation and is placed horizontally with the input point on the left half of the department.
The FLP2 can be formulated by using the decision variables presented for the FLP 1 plus the following additional sets of variables.
Output of the department i in x and y direction.
Input of the department i in x and y direction.
= Relative distance in x- axis between the output point of the department i to input point of the department j.
= Relative distance in y- axis between the output point of the department i to input point of the department j.
=
t
The problem considered here is to determine the position and orientation of the departments within the floor with the objective of minimizing the sum of rectilinear distance weighted by flows between the input and output points of the departments. The MILP formulation for the FLP 2 is as follows.
Minimize
19 Subject to = a + b (1- ) = a + b - – + L (1 – ) + ) /2 + Z - + W (1 - ) + ) /2 + Z + + + 1 + 1 + 1 - ) + - ) - + - ) (34) - ) + - ) (35) - ) + - ) (36) (37) + = (38) ( /2) (39) L - ( /2) (40) ( /2) (41) W - ( /2) (42) (43) (44)
20 (45) (46) (47) (48)
The objective function (21) minimizes the sum of the interdepartmental flow times the rectilinear distance between the departments I/O points. Constraints (22)–(23), (28)-(32) have the same meaning as in constraints (2)–(3), (8)-(12) of previous formulation FLP 1. Constraints (24)-(27) are used to calculate the rectilinear distance from the output point of the department i
to the input point of the department j. Constraints (39)-(42) has the same meaning to that of constraints (13)-(16) in FLP 1. The I/O points of the departments are defined according to the relative location of the points based on the centroids of the departments by using constraints (33)-(36). Constraints (37)-(38) ensure that each department can take only one position.
3.3 Layout design with fixed shape and flexible I/O points and orientation
A more realistic model can be obtained by incorporating additional design decisions such as the location of the I/O points for each department are made flexible, and can be located anywhere within or on the boundary of the department. That is, the facility layout problem with fixed shape and flexible I/O points (FLP 3) is an extension of FLP 2. To
21
formulate this problem, we need to define the following sets of decision variables. Let
be a vector of decision variables associated with the coordinates of the department i as shown in Figure 5.
The MIP formulation for the FLP 3 is: Minimize (49) Subject to
22 (61) (62) (63) (64) (65) (66) (67) (68) (69) (70) (71) (72) ( /2) (73) L - ( /2) (74) (75) W - ( /2) (76) (78) (79) (80) (81) (82)
23
(83)
The objective function (49) minimizes the sum of the interdepartmental flow times the rectilinear distance between the departments I/O points. Constraints (50)–(60) have the same meaning as in constraints (2) – (12) of formulation FLP. Constraints (61)-(64) makes each I/O station of department i to be located within the spatial boundaries of that department. Constraints (65)-(72) calculate the coordinates of department i based on the centroid location of that department. Constraints (73)-(76) have the same meaning to that of constraints (13)-(16) in FLP 1.
3.4 Layout design with flexible shape and flexible I/O points
In this section, we present the facility layout problem with flexible shape and flexible I/O points (FLP 4). In FLP 4, both the department shapes and location of I/O points in the department are made flexible, i.e. a department can be of varying dimensions but the constraints of the problem include satisfying area requirements of the departments. Restriction on the shape and location of the departments are also enforced. Shapes of the departments are mainly controlled by means of aspect ratio , where is the maximum permissible ratio between the longer and shorter side of the department i. In order to satisfy the area constraint 4 , where is the area of the department i, we will limit the ratio between the length and depth of the departments using the same idea as in Meller (1999) in which the side lengths are constrained by using
24 the upper and lower limits.
= min {max (L, W), )}/2
= ), where and
The decision variables ( are now the half-length and half-width of the department. The MIP formulation for the FLP 4 is given as follows,
Minimize Subject to - + L (1 - ) + ) /2 + Z - + W (1 - ) + ) /2 + Z + + + 1 + 1 + 1 (94) (95) (96)
25 (97) (98) (99) (100) (101) (102) = (103) = (104) = (105) = (106) = (107) = (108) = (109) = (110) ( /2) (111) L - ( /2) (112) ( /2) (113) W - ( /2) (114) (115) (116) (117) (118) (119) (120)
26
In FLP 4, the objective function (84) minimizes the sum of the interdepartmental flow times the rectilinear distance between the departments I/O stations. Constraints (85)-(93) has the same meaning to that of constraints (4)-(12) in FLP 1.Constraints (94)-(95) ensure that side length lies between the maximum and minimum side length. Constraints (96)-(98) acts as an area constraints, In constraint (96) the left hand side denotes the actual perimeter and right hand side models the facts that square department have the smallest perimeters thus as the department goes more non-square their perimeter has to increase to maintain the area and this is incorporated using , where is the maximum of ( of the department i. The value 1.9 was found using trial-and-error by Meller (1999). Constraints (99)-(110) have the same meaning to that of constraints (61)-(72) in FLP 3. Constraints (111)-(114) have the same meaning to that of constraints (13)-(16) in FLP 1.
27
Chapter 4: Results and Discussions
In this chapter, in order to assess the usefulness and efficiency of the proposed FLPs, we use a case study. We follow SLP as a procedural method. SLP can be grouped into three main phases: analysis, search, and evaluation. In the analysis phase all the data required to produce a good layout is collected. Within the analysis phase, facility data is utilized to define the departmental relationships. The search phase of the SLP involves the actual alternative layout generation. The location of departments has a direct impact on the flow of material. To make a choice of where these departments should be located and incorporate their impact on the design of the layout and flow of material, we solve the proposed models to obtain four possible candidate layouts and will finally conclude with the comparison of the results. As a part of the analyze phase in SLP an overview of the existing layout is discussed initially.
4.1 Overview of the existing Layout
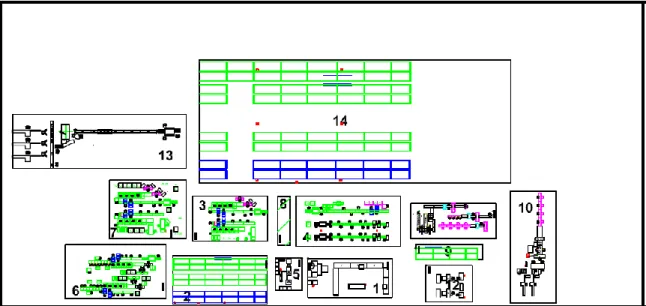
ABC is a leading company in North America which designs and manufacturers “ready to hang” wall décor products. The products that they manufacture are framed art, unframed art wood laminated art, and gallery‐wrap canvas art. Over the past 8 years they are being pioneers in the market. They sell products that primarily range between ($5 to $250) and some of their customers are Wal-Mart, Target, Macys. The current block layout of the
28 facility is shown in Figure 6.
In the current layout there are several departments in the manufacturing facility but we have focused on the fourteen most important departments and those are summarized in Table 1.
Table 1. Department dimensions Figure 6. Current Layout of the company
29
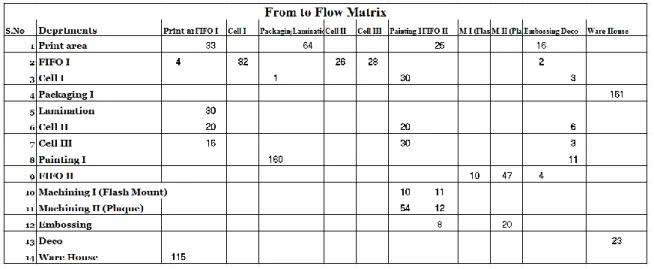
The dimensions of each department in are also shown in Table 1. There are families of product that follows the same sequence to visit the set of department within the facility, and we use that information to determine the amount of material flow between the various departments as shown in Table 2.
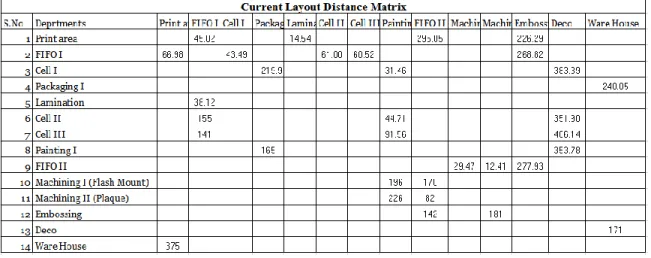
We have used the demand data for the year 2012 to construct Table 2 in terms of average number of pallets per month. In the current layout the I/O points for the departments are already set and the appropriate path for the flow of material are also determined, we just have to compute the distance for those paths as shown in Table 3. The empty entries in Table 3 means there is no flow between those stations and we have computed the distance only between the departments that has flow. The per unit material handling costs are equal to every department since they are using the same material handling system, so in order not to provide the actual information, we assume to be equal to $0.10 and remove
30
from the objective function. The estimated total material handling cost per month for the current layout of ABC is $13,487.40.This cost is calculated based on the distance matrix from the Table 3.
4.2 Alternate layout designs:
In this section we will analyze the results of all the four alternative layout designs. All these mathematical formulations are solved using CPLEX Studio IDE and run on a computer with a Pentium dual-core processor at 2.80 GHz clock speed with a time limit of one day CPU time. Within one day of CPU time we were able to solve to optimality the mathematical programming formulations presented for FLP 1 and FLP 2. FLP 3 and FLP 4 were not solved optimally and were terminated after 24 h of CPU time.
31
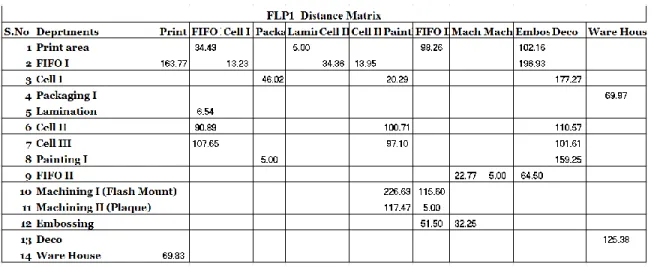
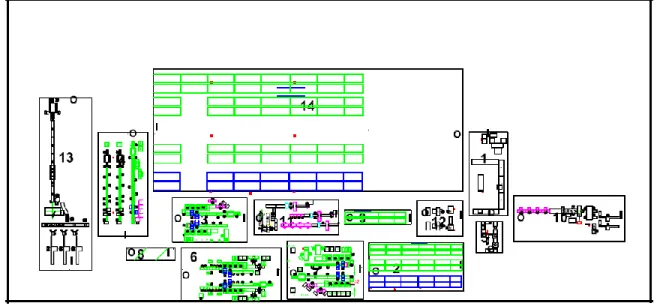
The optimal solution for FLP 1 is the layout shown in Figure 7. As mentioned previously, centroid-centroid distances between the departments were used in FLP 1 and rectilinear distances between the I/O points were used for FLP 2, FLP 3 and FLP 4. For a fair comparison of results between FLP 1 layout and the remaining layout designs, we assume I/O points for the departments in FLP 1. These I/O point positions are determined
after discussing with the engineering team of the company. Once we have these I/O points for the departments, we determined the appropriate path between departments and computed the matrix of distance between the departments for FLP 1 as shown in Table 4 to provide a more accurate estimation of the total material handling cost.
32
In case of model FLP 2, we considered the location of the I/O point for the departments as an input to the model and these I/O points are considered without considering the interaction between other departments and by just seeing the internal design of the department. For some departments the location of I/O points ended up as the same as original and for some departments it changed. The layout depicted in Figure 8 is obtained as a result of the model FLP 2. The shortest path distance between the I/O points of the departments are found and shown in Table 5.
33
In model FLP 3, I/O points are made flexible and can be located anywhere within or on the boundaries of the departments. Considering flexible I/O points for the departments the layout design obtained is shown in Figure 9 and for this design we computed the distance between the I/O points of the departments by considering the shortest path
Table 5. FLP2 distance matrix Figure 8. Block layout design from FLP 2
34
between the departments. The matrix of distance between the departments for FLP 3 is shown in Table 6. In FLP 1, FLP 2 and FLP 3 layouts the shapes of the department is not changed and remains rectangle.
In model FLP 4 both the I/O point location and the shape of the departments are made flexible. The shapes of the departments are altered based on aspect ratio. Considering
Figure 9. Block layout model from FLP 3
35
these assumptions the layout design obtained is shown in Figure 10 and the resulting matrix of distance between the I/O points of the department for FLP 4 is shown in Table 7.
Figure 10. Block layout model from FLP 4
36 4.3 Comparisons of layout designs
We developed four alternative layouts considering the location of the departments and the I/O points for each department. The objective value (total distance) for FLP 1 layout is $5,482. Comparing the current layout with the most basic alternate layout FLP 1 (see Figure7), there is a reduction in 59% in total material handling cost and FLP 1 was solved optimally with one day of CPU time. The layout in FLP 1 has placed department pairs with higher departmental flow close to each other. Moreover adding an additional feature of fixed I/O points for the departments in FLP 2 (see Figure 8) brought a reduced of 58% in the total material handling cost with an objective value of $5,699.3 when compared with the current layout and was optimally solved less than one day of CPU time. However there is no improvement in cost while comparing FLP 1 layout and FLP 2 layout. A quick insight on FLP 1 and FLP 2 layout shows that most of the departments are located below the warehouse. On the other hand, adding a feature of flexible I/O points for the departments in FLP 3 (see Figure 9) has brought reduction of 84% in total material handling cost when compared to the current layout, with an objective value of $2,270.40. Moreover, when comparing FLP 3 with FLP 2 there is a 25% reduction in material handling cost in FLP 3 layout in 24 h of CPU time. Although this time is too much, it is notable that the layout of departments is not a frequent problem and it may arise for a company once at the beginning or when reconfiguration of manufacturing facilities is needed. In FLP 3 layout most of the departments are located together on the
37
left side of the warehouse. This change in the location of departments brings reduction in the total material handling distance between the departments. Adding one more features of flexible shapes for the departments along with flexible I/O points results in FLP 4 layout (see Figure 10) which brings an improvement of 83% reduction in total material handling cost with an objective value of $2,302.70 when compared with the current layout. There is no improvement in cost when we compare FLP 4 with FLP 3, but it is to be noted that FLP 4 model has much more challenging features to be solved than FLP 3. Because of the high complexity in FLP 3 and FLP 4 model, they were not solved optimally and was terminated after 24 h of CPU time.
All four alternative layouts resulted in better layout cost when compared with the existing layout. The choice between the four alternative layout models relies on what the company is striving for. We summarize the four alternative layouts along with the current layout showing the total percentage reduction in material handling cost as shown in Table 8 and discussed with the engineering team of the company. Percentage reduction in material handling cost is calculated as,
38
Layout Objective value % Reduction cost
Current $13,487.40 -
FLP 1 $5,482 41.00
FLP 2 $5,699.30 42.00
FLP 3 $2,270.40 16.00
FLP4 $2,302.70 17.00
Their main objective is to minimize the material handling cost by giving them the best possible flow of materials between the departments. Therefore, since the layout of the department in FLP 3 results in a significant improvement in the transportation cost and space utilization, we recommend the company to implement FLP 3 layout (see Figure 9).
39
Chapter 5: Conclusions and Recommendation
In this thesis we presented four different models to determine the optimum arrangement of departments in a two-dimensional layout. In particular, we studied FLPs that integrate both block layout and location of I/O points decisions simultaneously by considering three different cases: (i) block layout design with fixed I/O points (FLP 2), (ii) block layout design with flexible I/O points (FLP 3), and (iii) block layout design with flexible department shapes and flexible I/O points (FLP 4). MIP formulations were presented for each variants of the problem and all these mathematical formulations were solved using CPLEX Studio IDE optimization. In order to assess the performance of the proposed models, we presented a case study of a manufacturing company which manufactures and supply different variety of canvas. Finally, since the layout of FLP 3 brought better reduction in material handling cost when compared with the current and other proposed layouts, we recommended the company to implement FLP 3 layout.
40
Reference:
1. Eilon, S. (1962). Elements of Production Planning and Control. New York, NY: Macmillan.
2. Tompkins, J.A., White, J.A., Bozer, Y.A., Frazelle, E.H., Tanchoco, J.M.A. and Trevino, J. (1996). Facilities Planning, New York, NY: John Wiley.
3. Ioannou, G. (2007). An integrated model and a decomposition-based approach for concurrent layout and material handling system design, Computers and Industrial Engineering, 52 (4), 459-485.
4. Page, A.L. (1991). New product development survey: Performance and best practices PDMA Conference, Chicago.
5. Drira, A., Pierreval, H., Gabouj, S.H. (2007) .Facility layout problems: A survey, Annual Reviews in Control, 31(2), 255-267.
6. Das, S.K. (1993). A facility layout method for flexible manufacturing systems. International Journal of Production Research 31(2), 279-297.
7. Meller, R.D. and Gau, K.Y. (1996). The facility layout problem: recent and emerging trends and perspectives. Journal of Manufacturing Systems, 15(5), 351–366.
8. Kim, J.G. and Goetschalckx, M. (2005). An integrated approach for the concurrent determination of the block layout and the input and output point locations based on
41
the contour distance, International Journal of Production Research, 43(10), 2027-2047.
9. Solimanpur, M., Vrat, P., Shankar, R. (2005). An ant algorithm for the single row layout problem in flexible manufacturing systems. Computers and Operations Research, 3(32), 583–598.
10. Heragu, S.S. and Kusiak, A. (1991). Efficient models for the facility layout problem. Operations Research, 53 (1), 1–13.
11. Muther, R. (1973). Systematic layout planning, Cahners Books.
12. Tompkins, J.A., White, J.A., Bozer, Y.A., Tanchoco, J.M.A. (2003). Facilities Planning. John Wiley and Sons, New York.
13. Webster, D.B. and Tyberghein, M.B. (1980). Measuring Flexibility of Job Shop layouts. International Journal of Production Research, 18(1), 21-29.
14. Kim, J.G. and Kim, Y.D. (2000). Layout planning for facilities with fixed shapes and input and output points International Journal of Production Research, 38(18), 4635-4653.
15. Moghaddam, R. T., N. Javadian, B. Javadi, N. Safaei, (2007). Design of a facility layout problem in cellular manufacturing systems with stochastic demands, Applied Mathematics and Computation, 184(2), 721-728.
16. Fruggiero, F., Lambiase, A., Negri, F. (2006). Design and optimization of a facility layout problem in virtual environment. Proceeding of ICAD.
42
17. Wang, M. J., Hu, M. H., Ku, M. H. (2005). A solution to the unequal area facilities layout problem by genetic algorithm. Computers in Industry, 56(2), 207–220. 18. Baykasoglu, A. and Gindy, N. N. Z. (2001). A simulated annealing algorithm for
dynamic layout problem. Computers & Operations Research, 28(14), 1403–1426. 19. Castillo, I., Westerlund, J., Emet, S., Westerlund, T. (2005). Optimization of block layout design problems with unequal areas: A comparison of MILP and MINLP optimization methods, Computers & Chemical Engineering, 30(1), 54-69.
20. Armour, G. C. and Buffa, E. S. (1963). A heuristic algorithm and simulation approach to relative allocation of facilities. Management Science, 9(2), 294–309. 21. Montreuil, B., (1990). A modeling framework for integrating layout design and
flow network design. Proceedings of the Material Handling Research Colloquium, 2, 95-115.
22. Meller, R.D., Narayanan, V., Vance, P.H., (1999). Optimal facility layout design. Operations Research, 23(3-5), 117–127.
23. Sherali, H.D., Fratcelli, B.M.P., Meller, R.D., (2003). Enhanced model formulations for optimal facility layout. Operations Research, 51(4), 629–644. 24. Kim, J. G. and Goetschalckx, M., (2005). An integrated approach for the
concurrent determination of the block layout and the input and output point locations based on the contour distance. International Journal of Production Research, 43 (10), 2027–2047.
43
25. Ho, Y.C and Moodie, C.L., (2000). A hybrid approach for concurrent layout design of cells and their flow paths in a tree configuration. International Journal of Production Research, 38(4), 895–928.
26. Aiello, G., Enea, M., Galante, G. (2002). An integrated approach to the facilities and material handling system design. International Journal of Production Research, 40(15), 4007-4017.
27. Bannerjee, P. and Zhou, Y., (1995). Facilities layout design optimization with single LOOP material flow path configuration. International Journal of Production Research, 33(1), 183–203.
28. Farahani, R. Z., Pourakbar, M., Miandoabchi, E. (2007). Developing exact and Tabu search algorithms for simultaneously determining AGV loop and P/D stations in single loop systems. International Journal of Production Research, 45 (22), 5199-5222.
29. Sedehi, M.S., and Farahani, R.Z. (2009). An integrated approach to determine the block layout, AGV flow path and the location of pick-up/delivery points in single-loop systems, International Journal of Production Research, 47 (11), 3041-3061.
30. Chittratanawat, S. and Noble, J.S., (1999). An integrated approach for facility layout, P/D locations and material handling system design. International Journal of
44 Production Research, 37(3), 683–706.
31. Papageorgiou, L.G and Rotstein, G.E (1998). Continuous-Domain Mathematical Models for Optimal Process Plant Layout, Industrial & Engineering Chemistry Research, 37 (9), 3631-3639.