Selection of our books indexed in the Book Citation Index in Web of Science™ Core Collection (BKCI)
Interested in publishing with us?
Contact [email protected]
Numbers displayed above are based on latest data collected.For more information visit www.intechopen.com Open access books available
Countries delivered to Contributors from top 500 universities
International authors and editors
Our authors are among the
most cited scientists
Downloads
We are IntechOpen,
the world’s leading publisher of
Open Access books
Built by scientists, for scientists
12.2%
122,000
135M
TOP 1%
154
Fuzzy-Pattern-Classiier Based Sensor Fusion for Machine Conditioning
Volker Lohweg and Uwe Mönks
X
Fuzzy-Pattern-Classifier Based
Sensor Fusion for Machine Conditioning
Volker Lohweg and Uwe Mönks
Ostwestfalen-Lippe University of Applied Sciences, inIT – Institute Industrial IT,
Lemgo
Germany
1. Introduction
Sensor and Information fusion is recently a major topic not only in traffic management, military, avionics, robotics, image processing, and e.g. medical applications, but becomes more and more important in machine diagnosis and conditioning for complex production machines and process engineering. Several approaches for multi-sensor systems exist in the literature (e.g. Hall, 2001; Bossé, 2007).
In this chapter an approach for a Fuzzy-Pattern-Classifier Sensor Fusion Model based on a general framework (e.g. Bocklisch, 1986; Eichhorn, 2000; Schlegel, 2004; Lohweg, 2004; Lohweg, 2006; Hempel, 2008; Herbst 2008; Mönks, 2009; Hempel 2010) is described. An application of the fusion method is shown for printing machines. An application on quality inspection and machine conditioning in the area of banknote production is highlighted. The inspection of banknotes is a high labour intensive process, where traditionally every note on every sheet is inspected manually. Machines for the automatic inspection and authentication of banknotes have been on the market for the past 10 to 12 years, but recent developments in technology have enabled a new generation of detectors and machines to be developed. However, as more and more print techniques and new security features are established, total quality, security in banknote printing as well as proper machine conditions must be assured (Brown, 2004). Therefore, this factor necessitates amplification of a sensorial concept in general. Such systems can be used to enhance the stability of inspection and condition results for user convenience while improving machine reliability.
During printed product manufacturing, measures are typically taken to ensure a certain level of printing quality. This is particularly true in the field of security printing, where the quality standards, which must be reached by the end-products, i.e. banknotes, security documents and the like, are very high. Quality inspection of printed products is conventionally limited to the optical inspection of the printed product. Such optical inspection can be performed as an off-line process, i.e. after the printed product has been processed in the printing press, or, more frequently, as an in-line process, i.e. on the printing press, where the printing operation is carried out. Usually only the existence or appearance of colours and their textures are checked by an optical inspection system.
In general, those uni-modal systems have difficulties in detection of low degradation errors over time (Ross 2006; Lohweg, 2006). Experienced printing press operators may be capable of identifying degradation or deviation in the printing press behaviour, which could lead to the occurrence of printing errors, for instance characteristic noise produced by the printing press. This ability is however highly dependent on the actual experience, know-how and attentiveness of the technical personnel operating the printing press. Furthermore, the ability to detect such changes in the printing press behaviour is intrinsically dependent on personnel fluctuations, such as staff reorganisation, departure or retirement of key personnel, etc. Moreover, as this technical expertise is human-based, there is a high risk that this knowledge is lost over time. The only available remedy is to organize secure storage of the relevant technical knowledge in one form or another and appropriate training of the technical personnel.
Obviously, there is need for an improved inspection system which is not merely restricted to the optical inspection of the printed end-product, but which can take other factors into account than optical quality criteria. A general aim is to improve the known inspection techniques and propose an inspection methodology that can ensure a comprehensive quality control of the printed substrates processed by printing presses, especially printing presses which are designed to process substrates used in the course of the production of banknotes, security documents and such like.
Additionally, a second aim is to propose a method, which is suited to be implemented as an expert system designed to facilitate operation of the printing press. In this context, it is particularly desired to propose a methodology, which is implemented in an expert system adapted to predict the occurrence of printing errors and machine condition and provide an explanation of the likely cause of errors, should these occur. An adaptive learning model, for both, conditioning and inspection methods based on sensor fusion and fuzzy interpretation of data measures is presented here.
2. Data Analysis and Knowledge Generation
In this section some general ideas for sensor and information fusion are presented for clarity. The basic concept of fused information relies on the fact that the lack of information which is supplied by sensors should be completed by a fusion process. It is assumed that, for example, two sensory information sources S1 and S2 with different active physical principles (e.g. pressure and temperature) are connected in a certain way. Then symbolically the union of information is described as follows (Luo, 1989):
1 2 1 2
( )
Perf S S Perf S Perf S . (1) The performance Perf of a system should be higher than the performance of the two mono-sensory systems, or at least, it should be ensured that:
1 2 1 2
( ) max ,
Perf S S Perf S Perf S . (2) The fusion process incorporates performance, effectiveness and benefit. With fusion of different sources the perceptual capacity and plausibility of a combined result should be
increased. It should be pointed out the above mentioned terms are not strictly defined as such. Moreover, they depend on a specific application as pointed out by Wald (Wald, 1999):
“Information fusion expresses the means and the tools for the alliance of data origination from different sources; it aims to obtain information of greater quality, the exact definition of greater quality will depend on the application.”
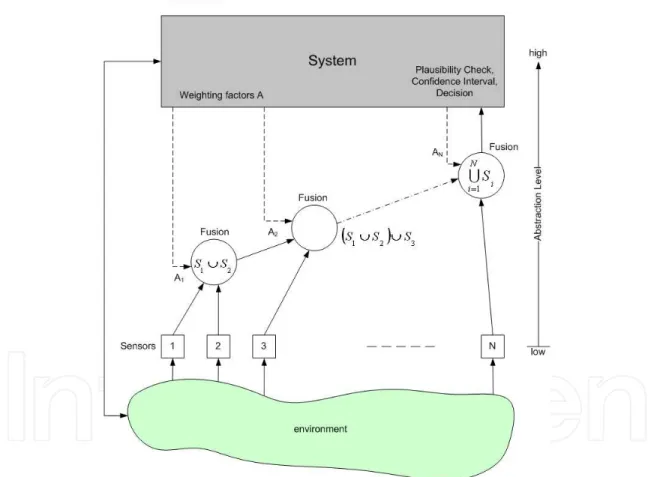
The World Model (Luo, 1989) describes the fusion process in terms of a changing environment (cf. Fig. 1). The environment reacts on the system which controls (weighting factors Ai) a local fusion process based on different sensors Si. On the basis of sensor models and the behaviour state of the sensors it is possible to predicate the statistical characteristics of the environment. Based on the World Model the environment stands for a general (printing) production machine. The fusion process generates in a best-case-scenario plausible and confident information which is necessary and sufficient for a stable decision.
Fig. 1. World Model flow chart for multi-sensor information fusion (Luo, 1989)
2.1 Pitfalls in Sensor Fusion
In today’s production world we are able to generate a huge amount of data from analogue or digital sensors, PLCs, middleware components, control PCs and if necessary from ERP systems. However, creating reliable knowledge about a machine process is a challenge because it is a known fact thatData Information Knowledge .
In general, those uni-modal systems have difficulties in detection of low degradation errors over time (Ross 2006; Lohweg, 2006). Experienced printing press operators may be capable of identifying degradation or deviation in the printing press behaviour, which could lead to the occurrence of printing errors, for instance characteristic noise produced by the printing press. This ability is however highly dependent on the actual experience, know-how and attentiveness of the technical personnel operating the printing press. Furthermore, the ability to detect such changes in the printing press behaviour is intrinsically dependent on personnel fluctuations, such as staff reorganisation, departure or retirement of key personnel, etc. Moreover, as this technical expertise is human-based, there is a high risk that this knowledge is lost over time. The only available remedy is to organize secure storage of the relevant technical knowledge in one form or another and appropriate training of the technical personnel.
Obviously, there is need for an improved inspection system which is not merely restricted to the optical inspection of the printed end-product, but which can take other factors into account than optical quality criteria. A general aim is to improve the known inspection techniques and propose an inspection methodology that can ensure a comprehensive quality control of the printed substrates processed by printing presses, especially printing presses which are designed to process substrates used in the course of the production of banknotes, security documents and such like.
Additionally, a second aim is to propose a method, which is suited to be implemented as an expert system designed to facilitate operation of the printing press. In this context, it is particularly desired to propose a methodology, which is implemented in an expert system adapted to predict the occurrence of printing errors and machine condition and provide an explanation of the likely cause of errors, should these occur. An adaptive learning model, for both, conditioning and inspection methods based on sensor fusion and fuzzy interpretation of data measures is presented here.
2. Data Analysis and Knowledge Generation
In this section some general ideas for sensor and information fusion are presented for clarity. The basic concept of fused information relies on the fact that the lack of information which is supplied by sensors should be completed by a fusion process. It is assumed that, for example, two sensory information sources S1 and S2 with different active physical principles (e.g. pressure and temperature) are connected in a certain way. Then symbolically the union of information is described as follows (Luo, 1989):
1 2 1 2
( )
Perf S S Perf S Perf S . (1) The performance Perf of a system should be higher than the performance of the two mono-sensory systems, or at least, it should be ensured that:
1 2 1 2
( ) max ,
Perf S S Perf S Perf S . (2) The fusion process incorporates performance, effectiveness and benefit. With fusion of different sources the perceptual capacity and plausibility of a combined result should be
increased. It should be pointed out the above mentioned terms are not strictly defined as such. Moreover, they depend on a specific application as pointed out by Wald (Wald, 1999):
“Information fusion expresses the means and the tools for the alliance of data origination from different sources; it aims to obtain information of greater quality, the exact definition of greater quality will depend on the application.”
The World Model (Luo, 1989) describes the fusion process in terms of a changing environment (cf. Fig. 1). The environment reacts on the system which controls (weighting factors Ai) a local fusion process based on different sensors Si. On the basis of sensor models and the behaviour state of the sensors it is possible to predicate the statistical characteristics of the environment. Based on the World Model the environment stands for a general (printing) production machine. The fusion process generates in a best-case-scenario plausible and confident information which is necessary and sufficient for a stable decision.
Fig. 1. World Model flow chart for multi-sensor information fusion (Luo, 1989)
2.1 Pitfalls in Sensor Fusion
In today’s production world we are able to generate a huge amount of data from analogue or digital sensors, PLCs, middleware components, control PCs and if necessary from ERP systems. However, creating reliable knowledge about a machine process is a challenge because it is a known fact thatData Information Knowledge .
Insofar, a fusion process must create a low amount of data which creates reliable knowledge. Usually the main problems in sensor fusion can be described as follows: Too much data, poor models, bad features or too many features, and applications are not analysed properly. One major misbelieve is that machine diagnosis can be handled only based on the generated data – knowledge about the technical, physical, chemical, or other processes are indispensable for modeling a multi-sensor system.
Over the last decade many researchers and practitioners worked on effective multi-sensor fusion systems in many different areas. However, it has to be emphasized that some “Golden Rules” were formed which should be considered when a multi-sensor fusion system is researched and developed. One of the first who suggested rules (dirty secrets) in military applications were Hall and Steinberg (Hall, 2001a). According to their “Dirty Secrets” list, ten rules for automation systems should be mentioned here as general statements.
1. The system designers have to understand the production machine, automation system, etc. regarding its specific behaviour. Furthermore, the physical, chemical, biological and other effects must be conceived in detail.
2. Before designing a fusion system, the technical data in a machine must be measured to clarify which kind of sensor must be applied.
3. A human expert who can interpret measurement results is a must.
4. There is no substitute for an excellent or at least a good sensor. No amount of data from a not understood or not reliable data source can substitute a single accurate sensor that measures the effect that is to be observed.
5. Upstream sins still cannot be absolved by downstream processing. Data fusion processing cannot correct for errors in the pre-processing (or a wrong applied sensor) of individual data. “Soft” sensors are only useful if the data is known as reliable. 6. Not only may the fused result be worse than the best sensor – but failure to address
pedigree, information overload, and uncertainty may show a worst result.
7. There is no such thing as a magic fusion algorithm. Despite claims of the contrary, no algorithm is optimal under all conditions. Even with the use of agent systems, ontologies, Dempster-Shafer and neuro-fuzzy approaches – just to name a few – the perfect algorithm is not invented yet. At the very end the application decides which algorithms are necessary.
8. The data are never perfectly de-correlated. Sources are in most cases statistically dependent.
9. There will never be enough training data available in a production machine. Therefore, hybrid methods based on models and training data should be used to apply Machine Learning and Pattern Recognition.
10. Data fusion is not a static process. Fusion algorithms must be designed so that the time aspect has to be considered.
2.2 Single-sensor vs. Multi-sensor Systems
Many detection systems are based on one main sensory apparatus. They rely on the evidence of a single source of information (e.g. photo-diode scanners in vending machines, greyscale-cameras in inspection systems, etc.). These systems, called unimodal systems, have to contend with a variety of general difficulties and have usually high false error rates in classification. The problems can be listed as follows; we refer to (Ross, 2006):
1. Raw data noise: Noisy data results from not sufficiently mounted or improperly maintained sensors. Also illumination units which are not properly maintained can cause trouble. Also, in general, machine drives and motors can couple different kinds of noise into the system.
2. Intraclass variations: These variations are typically caused by changing the sensory units in a maintenance process or by ageing of illuminations and sensors over a period of time.
3. Interclass variations: In a system which has to handle a variety of different production states over a period of time, there may be interclass similarities in the feature space of multiple flaws.
4. Nonuniversality: A system may not be able to create expedient and stable data or features from a subset of produced material.
Some of the above mentioned limitations can be overcome by including multiple information sources. Such systems, known as multimodal systems, are expected to be more reliable, due to the presence of multiple, partly signal-decorrelated, sensors. They address the problems of nonuniversality, and in combination with meaningful interconnection of signals (fusion), the problem of interclass variations. At least, they can inform the user about problems with intraclass variations and noise.
A generic multi-sensor system consists of four important units: a) the sensor unit which captures raw data from different measurement modules resp. sensors; b) the feature extraction unit which extracts an appropriate feature set as a representation for the machine to be checked; c) the classification unit which compares the actual data with their corresponding machine data stored in a database; d) the decision unit which uses the classification results to determine whether the obtained results represent e.g. a good printed or valid banknote. In multimodal systems information fusion can occur in any of the units. Generally three fusion types, depending on the abstraction level, are possible. The higher the abstraction level, the more efficient is the fusion. However, the high abstraction level fusion is not necessarily more effective due to the fact that data reduction methods are used. Therefore, information loss will occur (Beyerer, 2006).
1. Signal level fusion – Sensor Association Principle. At signal level all sensor signals are combined. It is necessary that the signals are comparable in a sense of data amount resp. sampling rate (adaption), registration, and time synchronisation.
2. Feature level fusion – Feature Association Principle. At feature level all signal descriptors (features) are combined. This is necessary if the signals are not comparable or complementary in a sense of data amount resp. sampling rate (adaption), registration, and time synchronisation. Usually this is the case if images and 1D-sensors are in use. There is no spatio-temporal coherence between the sensor signals.
3. Symbol level fusion – Symbol Association Principle. At symbol level all classification results are combined. In this case the reasoning (the decision) is based e.g. on probability or fuzzy membership functions (possibility functions). This is necessary if the signals are not comparable or complementary in a sense of data amount resp. sampling rate (adaption), registration, synchronisation and expert’s know-how has to be considered.
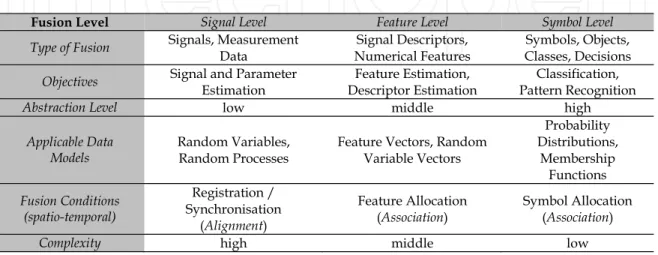
It is stated (Ross, 2006) that generic multimodal sensor systems which integrate information by fusion at an early processing stage are usually more efficient than those systems which perform fusion at a later stage. Since input signals or features contain more information about the physical data than score values at the output of classifiers, fusion at signal or feature level is expected to provide better results. In general, fusion at feature level is critical under practical considerations, because the dimensionality of different feature sets may not be compatible. Therefore, the classifiers have the task to adapt the different dimensionalities onto a common feature space. Fusion in the decision unit is considered to be rigid, due to the availability of limited information and dimensionality.
Fusion Level Signal Level Feature Level Symbol Level Type of Fusion Signals, Measurement Data Numerical Features Signal Descriptors, Classes, Decisions Symbols, Objects,
Objectives Signal and Parameter Estimation Descriptor Estimation Feature Estimation, Pattern Recognition Classification,
Abstraction Level low middle high
Applicable Data
Models Random Variables, Random Processes Feature Vectors, Random Variable Vectors
Probability Distributions, Membership Functions Fusion Conditions (spatio-temporal) Registration / Synchronisation (Alignment) Feature Allocation
(Association) Symbol Allocation (Association)
Complexity high middle low
Table 1. Fusion levels and their allocation methods (Beyerer, 2006)
3. General Approach for Security Printing Machines
Under practical considerations, many situations in real applications can occur where information is not precise enough. This behaviour can be divided into two parts. The first part describes the fact that the information itself is uncertain. In general, the rules and the patterns describe a system in a vague way. This is because the system behaviour is too complex to construct an exact model, e.g. of a dynamic banknote model. The second part describes the fact that in real systems and applications many problems can occur, such as signal distortions and optical distortions. The practice shows that decisions are taken even on vague information and model imperfectness. Therefore, fuzzy methods are valuable for system analysis.
3.1 Detection Principles for Securities
In the general approach, different methods of machine conditioning and print flaw detection are combined, which can be used for vending or sorting machines as well as for printing machines.
3.1.1 Visible Light-based Optical Inspection
Analysis of the behaviour of the printing press is preferably performed by modelling characteristic behaviours of the printing press using appropriately located sensors to sense operational parameters of the functional components of the printing press which are exploited as representative parameters of the characteristic behaviours. These characteristic behaviours comprise of:
1. faulty or abnormal behaviour of the printing press, which leads to or is likely to lead to the occurrence of printing errors; and/or
2. defined behaviours (or normal behaviours) of the printing press, which leads to or is likely to lead to good printing quality.
Further, characteristic behaviours of the printing press can be modelled with a view to reduce false errors or pseudo-errors, i.e. errors that are falsely detected by the optical inspection system as mentioned above, and optimise the so-called alpha and beta errors. Alpha error is understood to be the probability to find bad sheets in a pile of good sheets, while beta error is understood to be the probability to find good printed sheets in a pile of bad printed sheets. According to (Lohweg, 2006), the use of a multi-sensor arrangement (i.e. a sensing system with multiple measurement channels) efficiently allows reducing the alpha and beta errors.
3.1.2 Detector-based Inspection
We have not exclusively used optical printing inspection methods, but also acoustical and other measurements like temperature and pressure of printing machines. For the latter cepstrum methods are implemented (Bogert, 1963). According to (Lohweg, 2006), the inherent defects of optical inspection are overcome by performing an in-line analysis of the behaviour of the printing press during the processing of the printed sheets. The monitored machine is provided with multiple sensors which are mounted on functional components of the printing press. As these sensors are intended to monitor the behaviour of the printing press during processing of the printed substrates, the sensors must be selected appropriately and be mounted on adequate functional machine components. The actual selection of sensors and location thereof depend on the configuration of the printing press, for which the behaviour is to be monitored. These will not be the same, for instance, for an intaglio printing press, an offset printing press, a vending machine or a sorting machine as the behaviours of these machines are not identical. It is not, strictly speaking, necessary to provide sensors on each and every functional component of the machine. But also the sensors must be chosen and located in such a way that sensing of operational parameters of selected functional machine components is possible. This permits a sufficient, precise and representative description of the various behaviours of the machine. Preferably, the sensors should be selected and positioned in such a way as to sense and monitor operational parameters which are virtually de-correlated. For instance, monitoring the respective rotational speeds of two cylinders which are driven by a common motor is not being very useful as the two parameters are directly linked to one another. In contrast, monitoring the current, drawn by an electric motor used as a drive and the contact pressure between two cylinders of the machine provides a better description of the behaviour of the printing press. Furthermore, the selection and location of the sensors should be made in view of the actual set of behaviour patterns one desires to monitor and of the classes of printing errors one wishes to detect. As a general rule, it is appreciated that sensors might be provided on the printing press in order to sense any combination of the following operational parameters:
1. processing speed of the printing press, i.e. the speed at which the printing press processes the printed substrates;
2. rotational speed of a cylinder or roller of the printing press;
3. current drawn by an electric motor driving cylinders of the printing unit of the printing press;
4. temperature of a cylinder or roller of the printing press;
5. pressure between two cylinders or rollers of the printing press; 6. constraints on bearings of a cylinder or roller of the printing press; 7. consumption of inks or fluids in the printing press; and/or
8. position or presence of the processed substrates in the printing press (this latter information is particularly useful in the context of printing presses comprising of several printing plates and/or printing blankets as the printing behaviour changes from one printing plate or blanket to the next).
Depending on the particular configuration of the printing press, it might be useful to monitor other operational parameters. For example, in the case of an intaglio printing press, monitoring key components of the so called wiping unit (Lohweg, 2006) has shown to be particularly useful in order to derive a representative model of the behaviour of the printing press, as many printing problems in intaglio printing presses are due to a faulty or abnormal behaviour of the wiping unit.
In general, multiple sensors are combined and mounted on a production machine. One assumption which is made in such applications is that the sensor signals should be de-correlated at least in a weak sense. Although this strategy is conclusive, the main drawback is based on the fact that even experts have only vague information about sensory cross correlation effects in machines or production systems. Furthermore, many measurements which are taken traditionally result in ineffective data simply because the measurement methods are suboptimal.
Therefore, our concept is based on a prefixed data analysis before classifying data. The classifier’s learning is controlled by the data analysis results. The general concept is based on the fact that multi-sensory information can be fused with the help of a Fuzzy-Pattern-Classifier chain, which is described in section 5.
4. Fuzzy Multi-sensor Fusion
It can hardly be said that information fusion is a brand new concept. As a matter of fact, it has already been used by humans and animals intuitively. Techniques required for information fusion include various subjects, including artificial intelligence (AI), control theory, fuzzy logic, and numerical methods and so on. More areas are expected to join in along with consecutive successful applications invented both in defensive and civilian fields.
Multi-sensor fusion is the combination of sensory data or data derived from sensory data and from disparate sources such that the resulting information is in some sense better than for the case that the sources are used individually, assuming the sensors are combined in a good way. The term ‘better’ in that case can mean more accurate, more complete, or more reliable. The fusion procedure can be obtained from direct or indirect fusion. Direct fusion is the fusion of sensor data from some homogeneous sensors, such as acoustical sensors;
indirect fusion means the fused knowledge from prior information, which could come from human inputs. As pointed out above, multi-sensor fusion serves as a very good tool to obtain better and more reliable outputs, which can facilitate industrial applications and compensate specialised industrial sub-systems to a large extent.
The primary objective of multivariate data analysis in fusion is to summarise large amounts of data by means of relatively few parameters. The underlying theme behind many
multivariate techniques is reduction of features. One of these techniques is the Principal Components Analysis (PCA), which is also known as the Karhunen-Loéve transform (KLT) (Jolliffe, 2002).
Fuzzy-Pattern-Classification in particular is an effective way to describe and classify the printing press behaviours into a limited number of classes. It typically partitions the input space (in the present instance the variables – or operational parameters – sensed by the multiple sensors provided on functional components of the printing press) into categories or pattern classes and assigns a given pattern to one of those categories. If a pattern does not fit directly within a given category, a so-called “goodness of fit” is reported. By employing fuzzy sets as pattern classes, it is possible to describe the degree to which a pattern belongs to one class or to another. By viewing each category as a fuzzy set and identifying a set of fuzzy “if-then” rules as assignment operators, a direct relationship between the fuzzy set and pattern classification is realized. Figure 2 is a schematic sketch of the architecture of a fuzzy fusion and classification system for implementing the machine behaviour analysis. The operational parameters P1 to Pn sensed by the multi-sensor arrangement are optionally preprocessed prior to feeding into the pattern classifier. Such preprocessing may in particular include a spectral transformation of some of the signals output by the sensors. Such spectral transformation will in particular be envisaged for processing the signal’s representative of vibrations or noise produced by the printing press, such as the characteristic noise or vibration patterns of intaglio printing presses.
Preprocessing (e.g. spectral transforms)
Sensors Fuzzy Classifier DecisionUnit
1
P
n
P
Fig. 2. Multi-sensor fusion approach based on Fuzzy-Pattern-Classifier modelling
5. Modelling by Fuzzy-Pattern-Classification
Fuzzy set theory, introduced first by Zadeh (Zadeh, 1965), is a framework which adds uncertainty as an additional feature to aggregation and classification of data. Accepting vagueness as a key idea in signal measurement and human information processing, fuzzy membership functions are a suitable basis for modelling information fusion and classification. An advantage in a fuzzy set approach is that class memberships can be trained by measured information while simultaneously expert’s know-how can be taken into account (Bocklisch, 1986).
Fuzzy-Pattern-Classification techniques are used in order to implement the machine behaviour analysis. In other words, sets of fuzzy-logic rules are applied to characterize the behaviours of the printing press and model the various classes of printing errors which are likely to appear on the printing press. Once these fuzzy-logic rules have been defined, they can be applied to monitor the behaviour of the printing press and identify a possible correspondence with any machine behaviour which leads or is likely to lead to the
occurrence of printing errors. Broadly speaking, Fuzzy-Pattern-Classification is a known technique that concerns the description or classification of measurements. The idea behind Fuzzy-Pattern-Classification is to define the common features or properties among a set of patterns (in this case the various behaviours a printing press can exhibit) and classify them into different predetermined classes according to a determined classification model. Classic modelling techniques usually try to avoid vague, imprecise or uncertain descriptive rules. Fuzzy systems deliberately make use of such descriptive rules. Rather than following a binary approach wherein patterns are defined by “right” or “wrong” rules, fuzzy systems use relative “if-then” rules of the type “if parameter alpha is equal to (greater than, …less than) value beta, then event A always (often, sometimes, never) happens”. Descriptors “always”, “often”, “sometimes”, “never” in the above exemplary rule are typically designated as “linguistic modifiers” and are used to model the desired pattern in a sense of gradual truth (Zadeh, 1965; Bezdek, 2005). This leads to simpler, more suitable models which are easier to handle and more familiar to human thinking. In the next sections we will highlight some Fuzzy-Pattern-Classification approaches which are suitable for sensor fusion applications.
5.1 Modified-Fuzzy-Pattern-Classification
The Modified-Fuzzy-Pattern-Classifier (MFPC) is a hardware optimized derivate of Bocklisch’s Fuzzy-Pattern-Classifier (FPC) (Bocklisch, 1986). It should be worth mentioning here that Hempel and Bocklisch (Hempel, 2010) showed that even non-convex classes can be modelled within the framework of Fuzzy-Pattern-Classification. The ongoing research on FPC for non-convex classes make the framework attractive for Support Vector Machine (SVM) advocates.
Inspired from Eichhorn (Eichhorn, 2000), Lohweg et al. examined both, the FPC and the MFPC, in detail (Lohweg, 2004). MFPC’s general concept of simultaneously calculating a number of membership values and aggregating these can be valuably utilised in many approaches. The author’s intention, which yields to the MFPC in the form of an optimized structure, was to create a pattern recognition system on a Field Programmable Gate Array (FPGA) which can be applied in high-speed industrial environments (Lohweg, 2009). As MFPC is well-suited for industrial implementations, it was already applied in many applications (Lohweg, 2006; Lohweg, 2006a; Lohweg, 2009; Mönks, 2009; Niederhöfer, 2009). Based on membership functionsμ m
,p
, MFPC is employed as a useful approach to modelling complex systems and classifying noisy data. The originally proposed unimodal MFPC fuzzy membership functionμ m
,p
can be described in a graph as:r D ) (m f B r B r C m0 m0 m0 Cf f D m
Fig. 3. Prototype of a unimodal membership function
The prototype of a one-dimensional potential function μ m
,p
can be expressed as follows (Eichhorn, 2000; Lohweg, 2004):
( , )
( , ) 2
m p A d mp , (3)
with the difference measure
0 0 0 0 1 1 , ( , ) . 1 1 , r f D r r D f f m m m m B C d m m m m m B C p (4)
As for Fig. 3, the potential function ( , ) m p is a function concerning parameters Aand the parameter vector p containing coefficients m0, Br, Bf, Cr, Cf, Dr, and Df. A is denoted as the amplitude of this function, and in hardware design usually setA1.The coefficient
0
m is featured as center of gravity. The parameters Br andBf determine the value of the membership function on the boundaries m0Cr and m0Cf correspondingly. In addition, rising and falling edges of this function are described by (m0Cr, )p Br and
0
(m Cf, ) Bf.
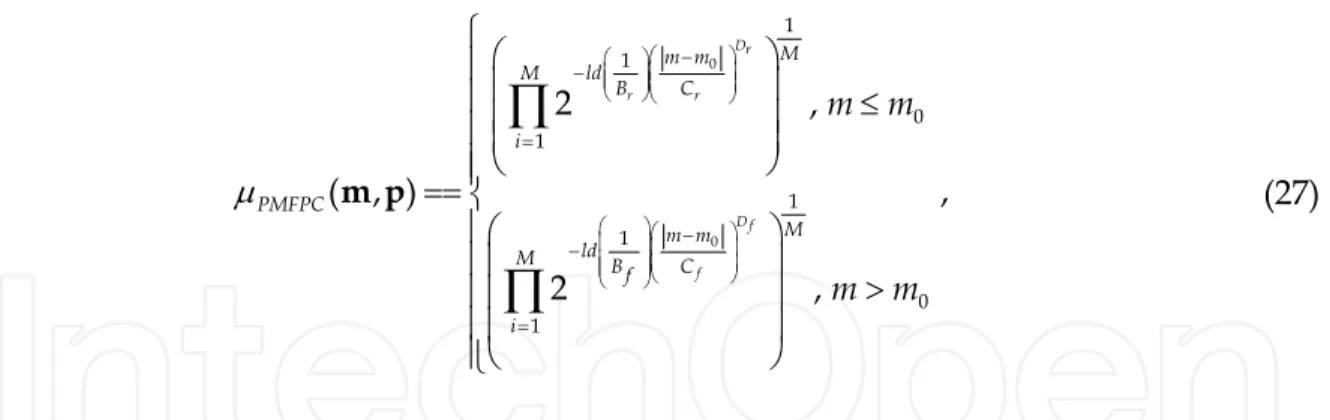
p The distance from the center of gravity is interpreted by Cr and Cf. The parameters Dr and Df depict the decrease in membership with the increase of the distance from the center of gravity m0. Suppose there are M features considered, then Eq. 3 can be reformulated as: 1 0 1 ( , ) ( , ) 2 . M i i i i d m M p m p (5)
With a special definition (A1, Br Bf 0.5, Cr Cf, Dr Df ) Modified-Fuzzy-Pattern Classification (Lohweg, 2004; Lohweg 2006; Lohweg 2006a) can be derived as:
occurrence of printing errors. Broadly speaking, Fuzzy-Pattern-Classification is a known technique that concerns the description or classification of measurements. The idea behind Fuzzy-Pattern-Classification is to define the common features or properties among a set of patterns (in this case the various behaviours a printing press can exhibit) and classify them into different predetermined classes according to a determined classification model. Classic modelling techniques usually try to avoid vague, imprecise or uncertain descriptive rules. Fuzzy systems deliberately make use of such descriptive rules. Rather than following a binary approach wherein patterns are defined by “right” or “wrong” rules, fuzzy systems use relative “if-then” rules of the type “if parameter alpha is equal to (greater than, …less than) value beta, then event A always (often, sometimes, never) happens”. Descriptors “always”, “often”, “sometimes”, “never” in the above exemplary rule are typically designated as “linguistic modifiers” and are used to model the desired pattern in a sense of gradual truth (Zadeh, 1965; Bezdek, 2005). This leads to simpler, more suitable models which are easier to handle and more familiar to human thinking. In the next sections we will highlight some Fuzzy-Pattern-Classification approaches which are suitable for sensor fusion applications.
5.1 Modified-Fuzzy-Pattern-Classification
The Modified-Fuzzy-Pattern-Classifier (MFPC) is a hardware optimized derivate of Bocklisch’s Fuzzy-Pattern-Classifier (FPC) (Bocklisch, 1986). It should be worth mentioning here that Hempel and Bocklisch (Hempel, 2010) showed that even non-convex classes can be modelled within the framework of Fuzzy-Pattern-Classification. The ongoing research on FPC for non-convex classes make the framework attractive for Support Vector Machine (SVM) advocates.
Inspired from Eichhorn (Eichhorn, 2000), Lohweg et al. examined both, the FPC and the MFPC, in detail (Lohweg, 2004). MFPC’s general concept of simultaneously calculating a number of membership values and aggregating these can be valuably utilised in many approaches. The author’s intention, which yields to the MFPC in the form of an optimized structure, was to create a pattern recognition system on a Field Programmable Gate Array (FPGA) which can be applied in high-speed industrial environments (Lohweg, 2009). As MFPC is well-suited for industrial implementations, it was already applied in many applications (Lohweg, 2006; Lohweg, 2006a; Lohweg, 2009; Mönks, 2009; Niederhöfer, 2009). Based on membership functionsμ m
,p
, MFPC is employed as a useful approach to modelling complex systems and classifying noisy data. The originally proposed unimodal MFPC fuzzy membership functionμ m
,p
can be described in a graph as:r D ) (m f B r B r C m0 m0 m0 Cf f D m
Fig. 3. Prototype of a unimodal membership function
The prototype of a one-dimensional potential function μ m
,p
can be expressed as follows (Eichhorn, 2000; Lohweg, 2004):
( , )
( , ) 2
m p A d mp , (3)
with the difference measure
0 0 0 0 1 1 , ( , ) . 1 1 , r f D r r D f f m m m m B C d m m m m m B C p (4)
As for Fig. 3, the potential function ( , ) m p is a function concerning parameters Aand the parameter vector p containing coefficients m0, Br, Bf, Cr, Cf, Dr, and Df. A is denoted as the amplitude of this function, and in hardware design usually setA1.The coefficient
0
m is featured as center of gravity. The parameters Br andBf determine the value of the membership function on the boundaries m0Cr and m0Cf correspondingly. In addition, rising and falling edges of this function are described by (m0Cr, )p Br and
0
(m Cf, ) Bf.
p The distance from the center of gravity is interpreted by Cr and Cf. The parameters Dr and Df depict the decrease in membership with the increase of the distance from the center of gravity m0. Suppose there are M features considered, then Eq. 3 can be reformulated as: 1 0 1 ( , ) ( , ) 2 . M i i i i d m M p m p (5)
With a special definition (A1, Br Bf 0.5, Cr Cf, Dr Df ) Modified-Fuzzy-Pattern Classification (Lohweg, 2004; Lohweg 2006; Lohweg 2006a) can be derived as:
1 0 1 ( , ) ( , ) 2 M i i i i d m M MFPC p m p , (6) where 0, ( , ) , D i i i i i i m m d m C p 0, 1 ( max min ), 2 i i i m m m (1 2 ) ( max min ). 2 i i i CE m m C P
(7)
The parameters mmax and mmin are the maximum and minimum values of a feature in the training set. The parameter mi is the input feature which is supposed to be classified. Admittedly, the same objects should have similar feature values that are close to each other. In such a sense, the resulting value of m mi 0,i ought to fall into a small interval, representing their similarity. The value PCE is called elementary fuzziness ranging from zero to one and can be tuned by experts’ know-how. The same implies to D = (2, 4, 8, …). The aggregation is performed by a fuzzy averaging operation with a subsequent normalization procedure.
As an instance of FPC, MFPC was addressed and successfully hardware-implemented on banknote sheet inspection machines. MFPC utilizes the concept of membership functions in fuzzy set theory and is capable of classifying different objects (data) according to their features, and the outputs of the membership functions behave as evidence for decision makers to make judgments. In industrial applications, much attention is paid on the costs and some other practical issues, thus MFPC is of great importance, particularly because of its capability to model complex systems and hardware implementability on FPGAs.
5.2 Adaptive Learning Model for Modified-Fuzzy-Pattern-Classification
In this section we present an adaptive learning model for fuzzy classification and sensor fusion, which on one hand adapts itself to varying data and on the other hand fuses sensory information to one score value. The approach is based on the following facts:
1. The sensory data are in general correlated or
2. Tend to correlate due to material changes in a machine.
3. The measurement data are time-variant, e.g., in a production process many parameters are varying imperceptively.
4. The definition of “good” production is always human-centric. Therefore, a committed quality standard is defined at the beginning of a production run.
5. Even if the machine parameters change in a certain range the quality could be in order.
The underlying scheme is based on membership functions (local classifiers) ( , )i mi pi , which are tuned by a learning (training) process. Furthermore, each membership function is weighted with an attractor value Ai, which is proportional to the eigenvalue of the
corresponding feature mi. This strategy leads to the fact that the local classifiers are trained
based on committed quality and weighted by their attraction specified by a Principal Component Analysis’ (PCA) (Jolliffe, 2002) eigenvalues. The aggregation is again performed by a fuzzy averaging operation with a subsequent normalization procedure.
5.2.1 Review on PCA
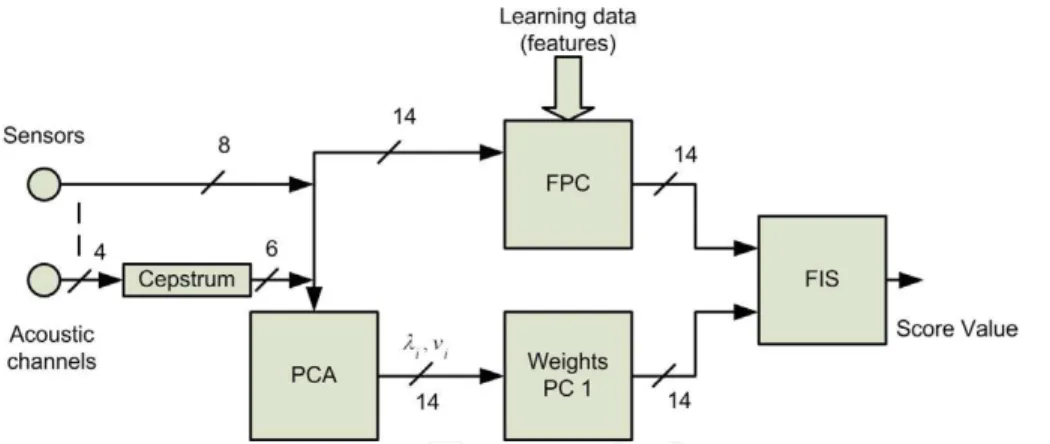
The Principal Components Analysis (PCA) is effective, if the amount of data is high while the feature quantity is small (< 30 features). PCA is a way of identifying patterns in data, and expressing the data in such a way as to highlight their similarities and differences. Since patterns in data are hard to find in data of high dimensions, where the graphical representation is not available, PCA is a powerful tool for analysing data. The other main advantage of PCA is that once patterns in the data are found, it is possible to compress the data by reducing the number of dimensions without much loss of information. The main task of the PCA is to project input data into a new (sub-)space, wherein the different input signals are de-correlated. The PCA is used to find weightings of signal importance in the measurement’s data set.
PCA involves a mathematical procedure which transforms a set of correlated response variables into a smaller set of uncorrelated variables called principal components. More formally it is a linear transformation which chooses a new coordinate system for the data set such that the greatest variance by any projection of the set is on the first axis, which is also called the first principal component. The second greatest variance is on the second axis, and so on. Those created principal component variables are useful for a variety of things including data screening, assumption checking and cluster verification. There are two possibilities to perform PCA: first applying PCA to a covariance matrix and second applying PCA to a correlation matrix. When variables are not normalised, it is necessary to choose the second approach: Applying PCA to raw data will lead to a false estimation, because variables with the largest variance will dominate the first principal component. Therefore in this work the second method in applying PCA to standardized data (correlation matrix) is presented (Jolliffe, 2002).
In the following the function steps of applying PCA to a correlation matrix is reviewed concisely. If there are M data vectors x ... xT1N TMN each of length
N
, the projection of the data into a subspace is executed by using the Karhunen-Loéve transform (KLT) and their inverse, defined as: T
Y W X andX W Y , (8) where Y is the output matrix, W is the KLT transform matrix followed by the data (input) matrix: 11 12 1 21 22 2 1 2 N N M M MN x x x x x x x x x X . (9)
Furthermore, the expectation value E(•) (average
x
) of the data vectors is necessary: 1 1 2 2 ( ) ( ) ( ) ( )M M x E x x E x E X x E x x , where