ORIGINAL ARTICLE
Supplier selection in automobile industry: A mixed
balanced scorecard–fuzzy AHP approach
Masoud Rahiminezhad Galankashi
a,*, Syed Ahmad Helmi
a, Pooria Hashemzahi
ba
Department of Material, Manufacturing and Industrial Engineering, Faculty of Mechanical Engineering, Universiti Teknologi Malaysia, 81310 Johor, Malaysia
b
Department of Mechanical Engineering, Faculty of Engineering, University of Malaya, 50603 Kuala Lumpur, Malaysia
Received 29 January 2015; revised 2 January 2016; accepted 19 January 2016 Available online 7 February 2016
KEYWORDS
Supplier selection; Performance measurement; BSC;
FAHP
Abstract This study proposed an integrated Balanced Scorecard–Fuzzy Analytic Hierarchical Pro-cess (BSC–FAHP) model to select suppliers in the automotive industry. In spite of the vast amount of studies on supplier selection, the evaluation and selection of suppliers using the specific measures of the automotive industry are less investigated. In order to fill this gap, this research proposed a new BSC for supplier selection of automobile industry. Measures were gathered using a literature survey and accredited using Nominal Group Technique (NGT). Finally, a fuzzy AHP was used to select the best supplier.
Ó2016 Faculty of Engineering, Alexandria University. Production and hosting by Elsevier B.V. This is an open access article under the CC BY-NC-ND license (http://creativecommons.org/licenses/by-nc-nd/4.0/).
1. Introduction
In today’s competitive markets, companies have realized the importance of selecting proper suppliers who can supply their requirement with their desired quality and in a scheduled time. With the advent of Supply Chain Management (SCM), perfor-mance measurement can be considered as the best strategy for manufacturers to evaluate and select the best supplier to achieve supply chain surplus. Although the concepts of sup-plier evaluation and selection have been discussed by many researchers[1–6]only a very few attempts have been made to propose specific supplier selection frameworks for automotive industries[43]. In this context, proposing, incorporating,
merg-ing, quantifymerg-ing, and deploying the exact variables and mea-sures to proficiently and efficiently observe and assess the performance of suppliers are a confront for many practition-ers, managpractition-ers, and researchers[7–10]. While managers know about the importance of evaluating suppliers from different perspectives, this is less happening in the real world. This is partially due to the availability and complexity of many mea-sures for the aim of supplier evaluation, which make the pro-cess of selecting measures very complicated and time consuming. In addition, BSCs should be fitted to the charac-teristics of specific industries to be efficient. However, consid-ering specific performance measures for the supplier selection of automotive companies can be beneficial due to following reasons:
1. In real world life, managers aim to consider the most important measures for the aim of evaluating their suppli-ers and considering the economic issues (e.g. waste of time and human resource).
* Corresponding author.
E-mail addresses: [email protected], rgmasoud2@ live.utm.my(M.R. Galankashi),[email protected](S.A. Helmi). Peer review under responsibility of Faculty of Engineering, Alexandria University.
Alexandria Engineering Journal (2016)55, 93–100
H O S T E D BY
Alexandria University
Alexandria Engineering Journal
www.elsevier.com/locate/aejwww.sciencedirect.com
http://dx.doi.org/10.1016/j.aej.2016.01.005
1110-0168Ó2016 Faculty of Engineering, Alexandria University. Production and hosting by Elsevier B.V. This is an open access article under the CC BY-NC-ND license (http://creativecommons.org/licenses/by-nc-nd/4.0/).
2. Performance measures must be categorized in specific per-spectives. This helps managers to assign different impor-tance to some perspectives (e.g. assigning a higher weight to financial issues comparing to customer related concerns). 3. Mathematical models are precise tools to combine all the supplier evaluation results together and select the best one. This will be more precise when the decision maker has the option of making his/her decision in fuzzy environments.
Therefore, developing a BSC–FAHP model to evaluate the performance of different suppliers of automobile industries is the main objective of this study. By doing this, it attempts to address the following research questions:
1. How a specific framework can be proposed for the aim of choosing suppliers in automobile industries?
2. How different suppliers can be evaluated using the pro-posed framework?
3. How a fuzzy AHP can be used to combine the proposed framework to supplier selection process?
The scope of this study is limited to Iran’s automotive industry. However, the research structure, methodology, and framework can be helpful to researchers and practitioners who are interested in evaluating and selecting suppliers for specific industries. This study contributes to proposing a new BSC framework for the aim of evaluating and selecting suppli-ers for manufactursuppli-ers in automotive industries along with using a fuzzy AHP in order to combine all the performance measures concurrently. It introduces a new idea for the inte-gration of specific measures used for the process of supplier selection in automotive industries when there are so many per-formance measures which may make the decision makers con-fused. From the hypothetical and methodological point of view, to the best of our knowledge, this study also contributes to offer a new approach for automotive manufacturers to select their suppliers based on the specific measures since very few researches have been conducted before. The rest of this paper is organized as follows. Section2is a review of recent works on supplier evaluation and selection. A summary of research methodology is discussed in Section3. Section4 pre-sents the proposed BSC. Section5shows the supplier perfor-mance measurement and section 6 concerns the supplier selection process.
2. Literature review 2.1. Supplier selection
Since 1980s, company’s procurement processes have changed from fundamental supplies and raw materials to a network of joint enterprises. Consequently, supplier selection is a signif-icant player of the procurement process[1,2]. Basically, select-ing a proper supplier is considered as a non-trivial task. To achieve this goal, the majority of the decision makers empiri-cally choose suppliers[3,4]. Fundamentally, supplier selection is a decision procedure with the goal of decreasing the prelim-inary group of prospective suppliers to the ultimate choices
[5–9]. Supplier selection has been discussed by many researchers within the available literature[10–14].
2.2. Performance measurement
Performance measurement is a subject which is frequently argued, but seldom described. Based on the marketing perspec-tive, organizations attain their objectives by fulfilling their clients with superior efficiency in comparison with their com-petitors. Performance measurement is a fundamental approach to achieve this progress. In other words, progress will not happen except the proper metrics are created, evaluated, mea-sured and tracked. A performance measure can be described as a metric deployed to quantify the efficiency and/or effective-ness of an action. A performance measurement system can be described as the set of metrics deployed to quantify both the efficiency and effectiveness of actions[15,44,45].
With the advent of technology and increasing market competitiveness, companies understood about the significance of assessing their performance not only based on financial per-ceptions, but also based on other perspectives such as customer satisfaction and innovation [46–50]. BSC framework was developed in order to assist companies to balance the financial perspectives. Financial perspectives are appropriate to explain the past occurrences which are mostly long-term categories and not appropriate for critical success [16,17]. BSC was proposed to assist managers to assess the performance of their enterprise based on financial, customer, internal business, and learning and growth perspectives.
2.3. BSC–FAHP integration
Sharma and Bhagwat [18] suggested an incorporated BSC– AHP method for supply chain assessment. This paper sug-gested a balanced performance assessment structure for supply chain. While offering BSC, diverse SCM performance mea-sures were allocated into four viewpoints. Lee et al.[19] pro-posed a fuzzy AHP and BSC method for assessing the performance of IT department in the manufacturing business of Taiwan. The BSC idea was used to identify the hierarchy with four major perspectives and performance. A FAHP approach was then developed to tolerate vagueness and ambi-guity of information.
Cebeci[20]offered a method to choose an appropriate ERP system for textile industry. The developed methodology pro-vides suggestion prior to ERP selection. The criteria were con-cluded and subsequently compared in relation to their significance. Wu et al. [6]suggested a fuzzy MCDM method for assessing banking performance based on BSC. The research developed a Fuzzy Multiple Criteria Decision Making (FMCDM) method for banking performance assessment. Considering the four perspectives of a BSC, this study first reviewed the assessment indexes created from the literature connecting to banking performance. Then, for viewing these indexes, 23 indexes proper for banking performance assess-ment were chosen through expert questionnaires. In a similar study, Tseng[21]developed four BSC aspects and 22 criteria for a private university of science and technology in Taiwan.
Yu¨ksel and Dag˘deviren[22]did a case study analysis for a manufacturing firm using the FANP–BSC. This research revealed that BSC framework can be merged with fuzzy ANP method. Wang et al.[23]used a non-additive fuzzy set function and algorithm method to solve the BSC, hard to count and cause-and-effect relationship between different
perspectives. This research facilitated investigators and admin-istrators to appreciate the interface of features will affect the performance assessment results. Research by Chang et al.
[24]used the BSC in constructing a framework of wealth man-agement (WM). The suggested model helped the banking sec-tor in evaluating the organizational performance of WM banks, making it extremely appropriate for bank administra-tors. Bentes et al.[25]incorporated BSC and AHP for the goal of multidimensional evaluation of organizational performance. This research showed that the BSC and AHP can be integrated for the aim of performance measurement.
Briefly, an efficient supplier selection framework to propose specific measures of automotive industries has not been devel-oped. Besides, there are so many performance measures in the literature which make the supplier selection task confusing and expensive. A fit supplier selection framework is needed to use a specific performance measurement approach for the aim of evaluating suppliers. Trying to fill the gap in the literature, this study proposed an integrated BSC–FAHP model for evaluat-ing and selectevaluat-ing suppliers by considerevaluat-ing the characteristics of automotive industries, in order to assist managers and researchers to efficiently handle their supplier selection decision.
3. Research methodology
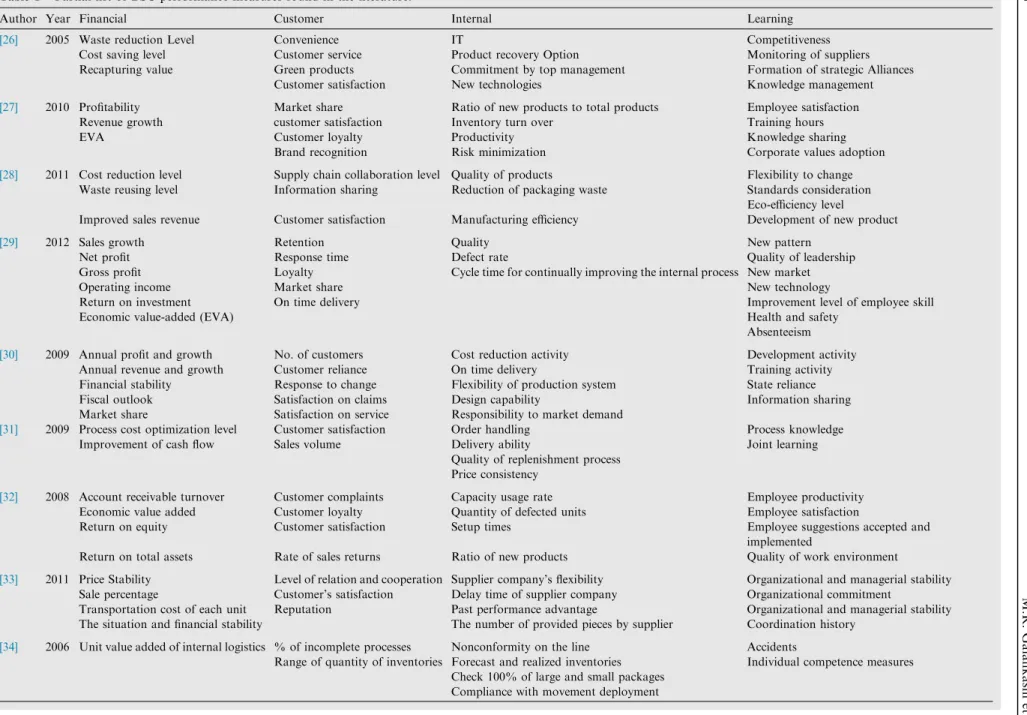
A literature review was conducted and an initial list of mea-sures was gathered (see Table 1). The output of this phase was an initial list of measures proper to be used for supplier selection. Next, using NGT, a new BSC was proposed for the aim of assessing suppliers in the automotive industry. Fol-lowing, a group of managers, researchers and practitioners with more than 10 years of working experience were asked to finalize the metrics of new BSC. Afterward, the proposed BSC was used to assist a manufacturing company to select its supplier. To achieve this goal, measures of BSC were used to assess the performance of each supplier and the results were used for the next step. Subsequently, a fuzzy AHP was applied to select the best supplier. The justification of using FAHP was its ability to consider different perspectives of BSC simultaneously.
4. Proposed BSC
Using literature survey and NGT, a new BSC was proposed for the aim of assessing suppliers in the automotive industry. A group of managers, researchers and practitioners with more than 10 years experience in this industry were asked to propose the new BSC.Table 2shows the proposed BSC.
5. Suppliers performance measurement
The proposed BSC was used to assist a manufacturing com-pany to select its supplier from a pool of suppliers including three national and one foreign supplier. Fig. 1 presents the supplier performance evaluation by applying the proposed BSC. The result is divided into four different sections showing BSC’s perspective. Quantities shown at the top of each column display the score achieved by each supplier. The scores were
calculated using related equations, manufacturer’s staff and management comments.
6. Supplier selection using FAHP
Supplier selection is categorized as an MCDM problem. Many researches used MCDM techniques with the objective of solving supplier selection problem such as AHP, TOPSIS, and ANP[10,11,35].
AHP was primarily introduced by Saaty in 1971 [36]. It abridges decision making by systematizing opinions, emotions, decisions, and memories into a structured environment. Once the hierarchy has been created, the decision-maker starts the prioritization process to decide the relative significance of the components in each level. The scale deployed for judgments in AHP allows the decision maker to integrate the knowledge and experience instinctively and specify how many times an element dominates another with respect to the criterion[37]. Within the literature, AHP has been largely used to discover answers for many complex decision-making problems.
Fuzzy sets were commenced by Zadeh in 1965 as a develop-ment of the conventional notion of set[38]. Concurrently, Salii
[39]explained a more extensive kind of arrangements named
L-relations, which were examined in an abstract algebraic context. Fuzzy relations are applicable in many areas such as linguistics, decision-making and clustering[40,41].
One of the important steps of AHP technique is to place the comparison matrices. When the number of attributes (or alter-natives) in the hierarchy increases, more judgments between features (or alternatives) require to be made. This could simply cause bewilderment, because of the overload of questions and therefore the inefficiency of the model. So a consistency check is needed for the pairwise comparison matrix. When the comparison matrices are not consistent, we should adjust the elements in the matrices and carry out a consistency test until they are consistent. Kong and Liu[42]introduced a FAHP in which they replaced membership scales for Saaty’s 1–9 scales to decrease adjusting times required. The following shows the related equations.
The comparison matrix described by Saaty deploys 1–9 scales. The 1–9 scales are shown with the subsequent compar-ison matrix inTable 3.
A¼ w1 w1 w1 w2 w1 wn w2 w1 w2 w2 w2 wn ... ... ... wn w1 wn w2 wn wn 0 B B B B B @ 1 C C C C C A¼ a11 a12 a1n a21 a22 a2n ... ... ... an1 an2 ann 0 B B B B @ 1 C C C C A ð1Þ
New fuzzy comparison matrix by Kong and Liu[42]is dif-ferent from Saaty’s and they employ membership scales, in place of the 1–9 scales, as the values of the elements.
A¼ w1 w1þw2 w1 w1þw2 w1 w1þwn w2 w2þw1 w2 w2þw2 w2 w2þwn ... ... ... wn wnþw1 wn wnþw2 wn wnþwn 0 B B B B B @ 1 C C C C C A¼ r11 r12 r1n r21 r22 r23 ... ... ... rn1 rn2 rnn 0 B B B B @ 1 C C C C A ð2Þ
If this comparison matrix is consistent, it should satisfy the following:
Table 1 Partial list of BSC performance measures found in the literature.
Author Year Financial Customer Internal Learning
[26] 2005 Waste reduction Level Convenience IT Competitiveness
Cost saving level Customer service Product recovery Option Monitoring of suppliers Recapturing value Green products Commitment by top management Formation of strategic Alliances
Customer satisfaction New technologies Knowledge management
[27] 2010 Profitability Market share Ratio of new products to total products Employee satisfaction
Revenue growth customer satisfaction Inventory turn over Training hours
EVA Customer loyalty Productivity Knowledge sharing
Brand recognition Risk minimization Corporate values adoption
[28] 2011 Cost reduction level Supply chain collaboration level Quality of products Flexibility to change Waste reusing level Information sharing Reduction of packaging waste Standards consideration
Eco-efficiency level
Improved sales revenue Customer satisfaction Manufacturing efficiency Development of new product
[29] 2012 Sales growth Retention Quality New pattern
Net profit Response time Defect rate Quality of leadership
Gross profit Loyalty Cycle time for continually improving the internal process New market
Operating income Market share New technology
Return on investment On time delivery Improvement level of employee skill
Economic value-added (EVA) Health and safety
Absenteeism
[30] 2009 Annual profit and growth No. of customers Cost reduction activity Development activity Annual revenue and growth Customer reliance On time delivery Training activity Financial stability Response to change Flexibility of production system State reliance
Fiscal outlook Satisfaction on claims Design capability Information sharing
Market share Satisfaction on service Responsibility to market demand
[31] 2009 Process cost optimization level Customer satisfaction Order handling Process knowledge
Improvement of cash flow Sales volume Delivery ability Joint learning
Quality of replenishment process Price consistency
[32] 2008 Account receivable turnover Customer complaints Capacity usage rate Employee productivity Economic value added Customer loyalty Quantity of defected units Employee satisfaction
Return on equity Customer satisfaction Setup times Employee suggestions accepted and
implemented
Return on total assets Rate of sales returns Ratio of new products Quality of work environment
[33] 2011 Price Stability Level of relation and cooperation Supplier company’s flexibility Organizational and managerial stability Sale percentage Customer’s satisfaction Delay time of supplier company Organizational commitment
Transportation cost of each unit Reputation Past performance advantage Organizational and managerial stability The situation and financial stability The number of provided pieces by supplier Coordination history
[34] 2006 Unit value added of internal logistics % of incomplete processes Nonconformity on the line Accidents
Range of quantity of inventories Forecast and realized inventories Individual competence measures Check 100% of large and small packages
Compliance with movement deployment
M.R.
Galankashi
et
rii¼0:5;rijþrji¼1; 1 rij 1¼ 1 rik 1 1 rki 1 ð3Þ
This approach evaluates weights in pairs and is more simple and easier to be deployed by the decision-makers. The senses of this membership scales can also be stated in the similar method as Saaty’s scale (seeTable 4).
Hypothetically, the membership scales put forward in this study and Saaty’s scales should satisfy the following:
rij¼ aij aijþ1
ð4Þ
The dissimilarity of membership scales with Saaty’s lies in the values of membership scales placed within the range of [0,1]. To compute the priority weights. Let:
W¼w1;w2;. . .;wn ð5Þ wi¼ bi Pn i¼1bi ð6Þ bi¼ 1 ½Pn j¼1r1ij n ð7Þ We can employ the subsequent equation to determine the consistency index: CI¼½ Pn i¼1 ðAWÞi nwi n1 ð8Þ
in which the values of the components in matrix A could be obtained by using Eq.(3)to matrixR. The comparison matrix will be considered to be consistent if there existsCRCI
RI¼0:1.
The different values ofRIare shown inTable 5.
Now, we employ proposed BSC–FAHP model to select the best suppliers for a manufacturing company in the Iranian automotive industry. Initially, hierarchy model of supplier selection is shown as follows:
Then, we provide the fuzzy comparison matrices of the cri-terion level. For example,Tables 6illustrates the original fuzzy pairwise comparison matrices for supplier selection.
Table 2 Proposed BSC for Automotive Industry.
Financial Customer
Price of product Service and delivery Quality of product Reputation
Distance to manufacturer Supply chain collaboration level Economic value added Market share
Economic value-added (EVA) Rate of sales return Internal business Learning and growth Technical capability Competitiveness Production capacity Employee satisfaction Flexibility (design, make, delivery) Knowledge sharing
Inventory turnover Health and safety issues level Productivity Standards consideration
Figure 1 Suppliers performance measurement using proposed BSC.
Table 3 Saaty’s scale for pairwise comparison.
AHP scale The relative importance of the two sub-elements
1 Equally important
3 Moderately important with one over another
5 Strongly important
7 Very strongly important
9 Extremely important
2,4,6,8 Intermediate values
Table 4 Scale for fuzzy pairwise comparison.
Scale values The relative importance of the two sub-elements 0.5 Equally important
0.55 (or 0.5 0.6 Slightly important 0.65 (or 0.6 0.7) Important 0.75 (or 0.7 0.8) Strongly important 0.85 (or 0.8 0.9) Very strongly important 0.95 (or 0.9 1.0) Extremely important
Table 5 Values of RI.
Size of matrix 1 2 3 4 5 6 7 8 9 10
RI 0 0 0.58 0.9 1.12 1.24 1.32 1.41 1.45 1.49
Table 6 Fuzzy criteria pairwise comparison matrix.
Criteria C1 C2 C3 C4
C1 0.5 0.6 0.7 0.9
C2 0.4 0.5 0.5 0.8
C3 0.3 0.5 0.5 0.7
C4 0.1 0.2 0.3 0.5
Table 7 Pairwise comparison matrix under financial criterion.
C1 = financial Supplier A Supplier B Supplier C Supplier D
Supplier A 0.5 0.7 0.45 0.65
Supplier B 0.3 0.5 0.15 0.45
Supplier C 0.55 0.85 0.5 0.8
Supplier D 0.35 0.55 0.2 0.5
Each supplier should be evaluated and compared under each criterion.Table 7–10show suppliers’ fuzzy pairwise com-parison matrices.
Based on Eqs.(1)–(8)and the result of pairwise comparison matrices shown inTable 6–10,Fig. 2shows the supplier selec-tion hierarchy. In addiselec-tion,Fig. 3shows the suppliers’ rank-ings using the proposed FAHP–BSC framework.
When decision makers have to make lots of comparisons (i.e., three or more), the track of the preceding responses may get lost. It is necessary that the rankings are valid and consistent. A preference determined for a set of pairwise com-parisons needs to be consistent with another set of
compar-isons. It is compulsory to perform a consistency test for all steps of AHP calculation since it illustrates the level of stead-fastness between data. The data were analyzed and the consis-tency test condition is satisfied[10].
7. Conclusion
This study developed an integrated Balanced Scorecard–Fuzzy Analytic Hierarchical Process (BSC–FAHP) model to select suppliers in the automotive industry. Despite the enormous quantity of researches on suppliers assessment, selection and related approaches, assessment and selection of suppliers with precise measures of this industry are less studied. To address this gap, this study was conducted to analytically recommend a new BSC framework for the mean of supplier evaluation. Principally, a BSC containing exact measures of automobile industry in each perspective (financial, customer, internal busi-ness and learning and growth) was proposed for the aim of suppliers’ performance measurement. Measures in each per-spective were collected with the aim of a literature survey and qualified using NGT. Finally, a fuzzy AHP was used to choose the best supplier. It initiated a novel idea for the incor-Table 8 Pairwise comparison matrix under customer
criterion.
C2 = customer Supplier A Supplier B Supplier C Supplier D
Supplier A 0.5 0.45 0.5 0.25
Supplier B 0.55 0.5 0.55 0.35
Supplier C 0.5 0.45 0.5 0.25
Supplier D 0.75 0.65 0.75 0.5
Table 9 Pairwise comparison matrix under internal business criterion. C3 = internal business Supplier A Supplier B Supplier C Supplier D Supplier A 0.5 0.5 0.45 0.6 Supplier B 0.5 0.5 0.45 0.6 Supplier C 0.55 0.55 0.5 0.7 Supplier D 0.4 0.4 0.3 0.5
Table 10 Pairwise comparison matrix under learning and growth criterion. C4 = learning and growth Supplier A Supplier B Supplier C Supplier D Supplier A 0.5 0.4 0.45 0.6 Supplier B 0.6 0.5 0.55 0.65 Supplier C 0.55 0.45 0.5 0.7 Supplier D 0.4 0.35 0.3 0.5
First Alternave Last Alternave Third Alternave Second Alternave
0.0000 0.1000 0.2000 0.3000 0.4000 0.5000 0.6000 0.7000 0.8000 0.9000 1.0000
Supplier A Supplier B Supplier C Supplier D
Figure 3 Suppliers ranking.
Su p p li er Sel e c on Us in g the Pr o p osed BSC-F A HP Model
Learning and Growth Perspective Internal Business Perspective Customer Perspective (C2) Financial Perspective (C1) Supplier D Supplier C Supplier B Supplier A (C4) (C3)
poration of explicit measures deployed in the process of sup-plier selection in automotive industries when there are a lot of performance measures which may make the decision makers bewildered. From the theoretical and methodological stand-point, to the best of our knowledge, this research also con-tributes to offer novel insight into automotive manufacturers for selecting their suppliers based on the exact measures since very few studies have been done before. In addition to the advantage of this study, FAHP considers the metrics of BSC separately and their interactions are neglected. This could be a good direction for future research. In addition, the proposed BCS of this study can be integrated with other MCDM tools such as ANP and DEA.
References
[1]R.E. Michaels, A. Kumar, S. Samu, Activity-specific role stress in purchasing, Int. J. Purchas. Mater. Manage. 31 (4) (1995) 10– 19.
[2]W.E. Patton III, Use of human judgment models in industrial buyers’ vendor selection decisions, Ind. Market. Manage. 25 (2) (1996) 135–149.
[3] J. Kontio, A case study in applying a systematic method for COTS selection, in: Software Engineering, 1996, IEEE Proceedings of the 18th International Conference on 1996, 1996. [4]H.-J. Shyur, H.-S. Shih, A hybrid MCDM model for strategic vendor selection, Math. Comput. Modell. 44 (7) (2006) 749–761. [5]L. De Boer, E. Labro, P. Morlacchi, A review of methods supporting supplier selection, Eur. J. Purchas. Supply Manage. 7 (2) (2001) 75–89.
[6]H.-Y. Wu, G.-H. Tzeng, Y.-H. Chen, A fuzzy MCDM approach for evaluating banking performance based on Balanced Scorecard, Expert Syst. Appl. 36 (6) (2009) 10135–10147. [7]L. De Boer, L. van der Wegen, J. Telgen, Outranking methods in
support of supplier selection, Eur. J. Purchas. Supply Manage. 4 (2) (1998) 109–118.
[8]D. Castro-Lacouture, A.L. Medaglia, M. Skibniewski, Supply chain optimization tool for purchasing decisions in B2B construction marketplaces, Autom. Constr. 16 (5) (2007) 569–575. [9]F.R. Lima Junior, L. Osiro, L.C.R. Carpinetti, A comparison between Fuzzy AHP and Fuzzy TOPSIS methods to supplier selection, Appl. Soft Comput. 21 (2014) 194–209.
[10]M.R. Galankashi et al, Supplier selection for electrical manufacturing companies based on different supply chain strategies, Electr. Eng. (2013).
[11]A. Dargi et al, Supplier selection: a fuzzy-ANP approach, Proc. Comput. Sci. 31 (2014) 691–700.
[12]S.H. Ghodsypour, C. O’brien, A decision support system for supplier selection using an integrated analytic hierarchy process and linear programming, Int. J. Product. Econ. 56 (1998) 199– 212.
[13]R.E. Spekman, Strategic supplier selection: understanding long-term buyer relationships, Bus. Horiz. 31 (4) (1988) 75–81. [14]C.-T. Chen, C.-T. Lin, S.-F. Huang, A fuzzy approach for
supplier evaluation and selection in supply chain management, Int. J. Prod. Econ. 102 (2) (2006) 289–301.
[15]A. Neely, M. Gregory, K. Platts, Performance measurement system design: a literature review and research agenda, Int. J. Oper. Prod. Manage. 15 (4) (1995) 80–116.
[16]R.S. Kaplan, D.P. Norton, Linking the balanced scorecard to strategy, Calif. Manage. Rev. 39 (1) (1996).
[17]R.S. Kaplan, D.P. Norton, P. Horv,th, The Balanced Scorecard, vol. 6, Harvard Business School Press, Boston, 1996. [18]M.K. Sharma, R. Bhagwat, An integrated BSC–AHP approach for supply chain management evaluation, Meas. Bus. Excell. 11 (3) (2007) 57–68.
[19]A.H. Lee, W.-C. Chen, C.-J. Chang, A fuzzy AHP and BSC approach for evaluating performance of IT department in the manufacturing industry in Taiwan, Expert Syst. Appl. 34 (1) (2008) 96–107.
[20]U. Cebeci, Fuzzy AHP-based decision support system for selecting ERP systems in textile industry by using balanced scorecard, Expert Syst. Appl. 36 (5) (2009) 8900–8909. [21]M.-L. Tseng, Implementation and performance evaluation using
the fuzzy network balanced scorecard, Comput. Educ. 55 (1) (2010) 188–201.
[22]I. Yu¨ksel, M. Dag˘deviren, Using the fuzzy analytic network_ process (ANP) for Balanced Scorecard (BSC): a case study for a manufacturing firm, Expert Syst. Appl. 37 (2) (2010) 1270–1278. [23]C.-H. Wang, I.-Y. Lu, C.-B. Chen, Integrating hierarchical balanced scorecard with non-additive fuzzy integral for evaluating high technology firm performance, Int. J. Prod. Econ. 128 (1) (2010) 413–426.
[24]C.-W. Chang et al, An application of AHP and sensitivity analysis for selecting the best slicing machine, Comput. Ind. Eng. 52 (2) (2007) 296–307.
[25]A.V. Bentes et al, Multidimensional assessment of organizational performance: integrating BSC and AHP, J. Bus. Res. 65 (12) (2012) 1790–1799.
[26]V. Ravi, R. Shankar, M. Tiwari, Analyzing alternatives in reverse logistics for end-of-life computers: ANP and balanced scorecard approach, Comput. Ind. Eng. 48 (2) (2005) 327–356. [27]K. Niebecker, D. Eager, B. Moulton, Collaborative and
cross-company project management within the automotive industry using the Balanced Scorecard, Int. J. Manage. Proj. Bus. 3 (2) (2010) 328–337.
[28]S.G. Jalali Naini, A.R. Aliahmadi, M. Jafari-Eskandari, Designing a mixed performance measurement system for environmental supply chain management using evolutionary game theory and balanced scorecard: a case study of an auto industry supply chain, Conserv. Recycl. 55 (6) (2011) 593–603. [29]N.F. Habidin et al, A proposed strategic balanced scorecard
model: strategic control system and organizational performance in Malaysian automotive industry, J. Bus. Manage. 1 (6) (2012) 39–44.
[30] W. Thanaraksakul, B. Phruksaphanrat. Supplier evaluation framework based on balanced scorecard with integrated corporate social responsibility perspective, in: Proceedings of the International MultiConference of Engineers and Computer Scientists; 2009.
[31]K. Zimmermann, S. Seuring, Two case studies on developing, implementing and evaluating a balanced scorecard in distribution channel dyads, Int. J. Logis.: Res. Appl. 12 (1) (2009) 63–81.
[32]A. Coskun, N. Bayyurt, Measurement frequency of performance indicators and satisfaction on corporate performance: a survey on manufacturing companies, Eur. J. Econ., Finance Adm. Sci. 13 (2008) 79–87.
[33]A. Azar et al, A BSC method for supplier selection strategy using TOPSIS and VIKOR: a case study of part maker industry, Manage. Sci. Lett. 1 (4) (2011) 559–568.
[34] E.M. Sabo´ia, et al., Strategic management indicators for internal logistics: a proposal based on the Balanced Scorecard for an automotive sector company, in 12th International Conference on Industrial Engineering and Operations Management, 2006. [35]F.E. Boran et al, A multi-criteria intuitionistic fuzzy group
decision making for supplier selection with TOPSIS method, Expert Syst. Appl. 36 (8) (2009) 11363–11368.
[36]T.L. Saaty, What is the Analytic Hierarchy Process?, Springer (1988)
[37]I. Millet, Ethical decision making using the analytic hierarchy process, J. Bus. Ethics 17 (11) (1998) 1197–1204.
[38]L.A. Zadeh, Fuzzy sets, Inf. Control 8 (3) (1965) 338–353.
[39]V.N. Salii, BinarynmathfrakL-relations, Izvestiya Vysshikh Uchebnykh Zavedenii. Matematika 1 (1965) 133–145.
[40]D. Dubois, H. Prade, Possibility Theory, Springer, 1988. [41]L.R. Liang et al, FM-test: a fuzzy-set-theory-based approach to
differential gene expression data analysis, BMC Bioinformatics 7 (Suppl. 4) (2006) S7.
[42]F. Kong, H. Liu, Applying fuzzy analytic hierarchy process to evaluate success factors of e-commerce, Int. J. Inf. Syst. Sci. 1 (3–4) (2005) 406–412.
[43]Masoud Rahiminezhad Galankashi et al, Prioritizing green supplier selection criteria using fuzzy analytical network process, Proc. CIRP 26 (2015) 689–694.
[44]Masoud Rahiminezhad Galankashi et al, Performance evaluation of a petrol station queuing system: a simulation-based design of experiments study, Adv. Eng. Softw. 92 (2016) 15–26.
[45]Masoud Rahiminezhad Galankashi et al, Assessment of supply chain strategies and analysis on the performance of companies deployed strategy using activity based approach, J. Teknol. 64 (2) (2013).
[46]Ibrahim Adel Eldosouky, Ahmed Hussein Ibrahim, Hossam El-Deen Mohammed, Management of construction cost contingency covering upside and downside risks, Alex. Eng. J. 53.4 (2014) 863–881.
[47]Remon Fayek Aziz, Sherif Mohamed Hafez, Yasser Ragab Abuel-Magd, Smart optimization for mega construction projects using artificial intelligence, Alex. Eng. J. 53 (3) (2014) 591–606.
[48]Usama Hamed Issa, Implementation of lean construction techniques for minimizing the risks effect on project construction time, Alex. Eng. J. 52 (4) (2013) 697–704. [49]Remon Fayek Aziz, Factors causing cost variation for
constructing wastewater projects in Egypt, Alex. Eng. J. 52 (1) (2013) 51–66.
[50]Remon Fayek Aziz, Sherif Mohamed Hafez, Applying lean thinking in construction and performance improvement, Alex. Eng. J. 52 (4) (2013) 679–695.