Procedia Computer Science 95 ( 2016 ) 287 – 296
1877-0509 © 2016 The Authors. Published by Elsevier B.V. This is an open access article under the CC BY-NC-ND license (http://creativecommons.org/licenses/by-nc-nd/4.0/).
Peer-review under responsibility of scientific committee of Missouri University of Science and Technology doi: 10.1016/j.procs.2016.09.337
ScienceDirect
Complex Adaptive Systems, Publication 6
Cihan H. Dagli, Editor in Chief
Conference Organized by Missouri University of Science and Technology
2016 - Los Angeles, CA
An Efficient Hybrid Intelligent Method for Electricity Price
Forecasting
Hiroyuki Mori
a,*, Kaoru Nakano
b aDept. of Network Design, Meiji Unversity, Nakano,Tokyo 164-8525, Japan bDept. of Electronics & Bioinformatics, Meiji Unversity, Kawasaki,Kanagawa 214-8571, Japan
Abstract
In this paper an efficient method is proposed for electricity price forecasting. This paper focuses on Locational Marginal Price (LMP) that efficiently maintains power markets by alleviating transmission network congestion. There are complicated behaviors of the time series due to uncertain factors in the power markets. From a standpoint of market players, a sophisticated method is required to forecast LMP effectively. The proposed method makes use of the hybridization of GP (Gaussian Process) of hierarchical Bayesian estimation, EPSO (Evolutionary Particle Swarm Optimization) of evolutionary computation and fuzzy c-means of allowing data to belong to two or more clusters. EPSO is used to improve the accuracy of parameters in MAP (Maximum a Posteriori) estimation for GP. The use of fuzzy c-mean is useful for increasing the number of learning data for GP to deal with spikes. The effectiveness of the proposed method is demonstrated for real LMP data.
© 2016 The Authors. Published by Elsevier B.V.
Peer-review under responsibility of scientific committee of Missouri University of Science and Technology.
Keywords:"Gaussian Process ;Hierarchical Bayesian Estimation; forecasting; EPSO; evolutionary computation; fuzzy c-mean; clustering"
* Corresponding author. Tel.: +81-3-5343-8292; fax: +81-3-5343-8113-.
E-mail address: [email protected]࠾࠺
© 2016 The Authors. Published by Elsevier B.V. This is an open access article under the CC BY-NC-ND license (http://creativecommons.org/licenses/by-nc-nd/4.0/).
Nomenclature N
C covariance matrix of from t1to tN
c scalar of K
xN1,xN1D given data
F cost function of fuzzy c-mean gjk attribute of fuzzy c-mean
gbest best solution in a group of populations
I unit matrix
K(x,i) kernel function of xandi
k vector elements K
xn,xN1
n 1,},N
m parameter of fuzzy c-mean such as m!1 mM dimension number in Mahalanobis kernel
N(x,i) normal distribution with average xand variance i
P(x|i) posterior distribution of xgiveni
pbesti best solution in population i
Q covariance matrix of yn
QM covariance matrix of Mahalanobis kernel nh
R basis function
rand uniform random number of [0, 1] t
i
S location of population iat time t n
t target variable
x7 transpose of matrix x t
i
V velocity of population iat time t h
w weights of Rnh
w0- w2 weights of PSO updating rule
wi3 initialvalue of random number for gbestin EPSO wi0*- wi3*adaptive weights of EPSO updating rule
n
y output of GP
n
x
x1,}, any point set
ij
G Kronecker delta
M
G parameter of Mahalanobis kernel such that GM !0
1 N
P average of predicted value at time N+1
Qk centre of cluster kin fuzzy c-mean
T hyperparameters
MAP
T MAP estimates of T
G
V width of Gaussian kernel 2
1 N
V . variance of predicted value at time N+1 2
w
V variance of wh
W learning rate
__x__Euclidean norm of vector x
1. Introduction
In recent years, power market plyers are concerned with maximization of profit and minimization of risk. Specifically, they are interested in the behavior of electricity price. As one of electricity prices, LMP is very important since it reflects demand conditions at each node in transmission networks and plays a key role to alleviate transmission network congestion [1-6]. As the deregulation of power networks is widely spread, power market players are afraid
that there is a high probability of transmission network congestion due to the limitation of transmission capacity. Once the congestion occur, it deteriorates power trading economics due to the cost burden of network congestion. As a result, it is a mainstream to pay for the network congestion cost. If possible, such a burden should be decreased in power system operation and planning. As a result, LMP has been introduced in PJM (Pennsylvania, New Jersey and Maryland), NYISO (New York Independent System Operator),etc. to alleviate the network congestion. It consists of energy cost, marginal loss and transmission congestion components and works to reinforce incentives for improving the availability of power networks. It may be defined as a marginal cost which supplies power for increased power demand at a certain node in a balanced power system.
The importance of LMP forecasting has been recognized in the conventional studies. In practice, power market players are concerned with the maximization of profit and the minimization of risk in purchasing or selling electricity. It is necessary for them to understand the behavior of electricity price in advance. However, time series of electricity price is often affected by power loads, weather conditions and sudden unexpected events. Sometimes it gives spikes that jump up electricity prices many times. The conventional methods on electricity price forecasting may be classified into two categories. One is statistical methods such as ARIMA, GARCH while the other is intelligent systems like ANN (Artificial Neural Network), fuzzy inference, neuro-fuzzy [7-14],etc. The statistical method has a drawback that it is not flexible in a sense that the parameter is fixed. The intelligent systems have good approximation for nonlinear systems, but they necessarily provide good results due to the complexity of data. In addition, it is very important to evaluate the uncertainties of the predicted LMP.
This paper proposes a GP-based method for LMP forecasting. GP is an extension of SVM (Support Vector Machine) makes use of hierarchical Bayesian estimation to evaluate the average and error bar of the predicted value [15-20]. The error bar corresponds to the lower and upper bounds of the predicted errors in evaluating the uncertainties of the predicted value. In order to construct a rigorous model, EPSO of evolutionary computation is introduced to improve MAP estimation in GP. EPSO is well-known for adaptive PSO to provide better results than PSO [21-23]. Furthermore, this paper introduces fuzzy c-means as a prefiltering technique [24]. The use of fuzzy c-means contributes to the increase of learning data so that the maximum errors, namely, errors on spikes decreases. The proposed method is successfully applied to real LMP data.
2. Gaussian Process
In this section Gaussian Process (GP) with MAP estimation is described [15-20]. It means GP with hierarchical estimation for probabilistic modelling. Although GP has a long history in many fields, this paper focuses on GP in machine learning that makes use of kernel functions and is useful for approximating nonlinear systems. Now, suppose that GP consists of joint Gaussian distributions for any point set x1,},xn and consider a regression model with weights whand basis functionRnh.
¦
{ H h nh h n w R y 1 (1) n n nh x R IAssuming that a priori distribution of wh is Gaussian with mean 0 and varianceV2w, we have the following equation.
Pw N
0,Vw2ICovariance matrix Q may be defined as T 2 T RR yy Q Vw Eqn. (3) may be rewritten as
Next, consider target variable tn that may be expressed as the variable that consists of yn and the Gaussian noise with mean 0 and varianceVv2. Then, a priori distribution of C may be written as
0,Q v2IN t
P V
Define the covariance matrix of t as CN gives
I RR I Q
CN Vv2 Vw2 TVv2 The elements i,j may be written as
2 1 2 v ij H h j h i h w Nij x x C V
¦
I I G VThe use of "kernel trick" in Support Vector Machine (SVM) avoids calculating the complicated inner product. The use of "kernel trick" gives
i j v ij wij Kx x
C V2 , V2G
Now, let us predict new target tN1with obtained targettN. A posterior distribution of tN1 may be written as
P
tN1|tN v tN,tN1CN11tN,tN1T Decomposing CN1into the following form,» ¼ º « ¬ ª c N N 1 T k k C C
We have the formula to update average PN1 and varianceV2N1. N N N1 kTC1t P k C kT 1 2 1 N N c V
It can be seen that covariance matrix CN1plays an important role to determine the above equation. However, it is necessary to determine the parameters in the covariance matrix. GP regards them as probabilistic variables to be evaluated by a posterior distribution from a priori distribution and the Bayes' theorem. Such parameters are referred to as hyperparameters that are involved in hierarchical Bayesian estimation. In practice, the performance of GP is dependent on the accuracy of hyperparameters. To determine the method is used due to the difficulty in calculating the exact solution.
In this paper, MAP (Maximum A Posteriori) estimation is employed to calculate the posteriori probability and estimate the point that maximizes the posteriori probability [15]. The performance of GP is dependent on the selection of the covariance matrix. To determine the appropriate covariance, MAP estimation assumes the parameters of the covariance matrix by evaluating the posteriori distribution with an assumed priori distribution of the parameters. Such parameters are referred to as hyperparameters.
Now, suppose that priori distribution of hyperparametersTmay be written as
t x Pt x TPT dTP N1| N1,D
³
N1| N1,D, |D (14)It can be seen that the above equation requires an approximate calculation due to the complex form of the integral in (14). According to the Bayes’ theorem, the above equation may be rewritten as
T P TPT
Taking the logarithm of the above equation gives
T P T PTP | ln | ln
ln D v D (16)
It should be noted that term P
T|D of (15) indicates a term to measure how much data is expressed by hyperparametersT. The first term in the right side of (16) may be written as T ln2S 2 2 1 ln 2 1 | lnPD CN tTCN1tN (17)MAP estimation makes use of the following approximate calculation:
P
tN1|xN1,D|PtN1|xN1,D,TMAP (18)To carry out the approximation of the above equation, this paper maximizes (16) with (17) and a priori distribution of TThe partial derivative of (17) with respect to hyperparameters TNmay be written as
N k N N N k N N k PD C C t C C t T T T T w w ¸ ¸ ¹ · ¨ ¨ © § w w w w 1 T 1 2 1 Tr 2 1 | lnAccording to the results of (19), the optimal hyperparameters may be evaluated by maximizing (16) with the gradient method
3. Fuzzy c-means
In this section, fuzzy c-means of clustering technique is explained [24]. Clustering means a method that classify a set of data into some clusters with data similarity. As one of clustering methods, k-means or c-means are well-spread in all the engineering fields. Fuzzy c-means was developed to solve difficulty in classifying a set of data close to the boundary of clusters. It is one of extensions of k-means in a way that a piece of data is allowed to belong to two or more clusters although k-means assigns a piece of data to one cluster. The k-means algorithm expresses the attribute as binary number while the fuzzy c-means represents the attribute in interval [0, 1]. In that sense, k-means and fuzzy c-means are referred to as hard and soft clustering, respectively. There are situations Now suppose that a set of data zj(j=1,2,…,J)is classified into Mclusters with centresQk(k=1,2,…,M). Also, the fuzzy membership functions of data
zjbelonging to cluster k may be written as 1 1 1 1 2 2 » » » » ¼ º « « « « ¬ ª ¸ ¸ ¸ ¹ · ¨ ¨ ¨ © §
¦
m K k j k i j jk z z g Q Q (20) where¦
M k jk g 1 1 (21)¦
¦
J j m jk J j j m jk k g z g 1 1 Q (22)¦¦
J j k j M k m jk z g F 1 2 1 Q (23)In the above equation, coefficients (gjk)mmeans a fuzzified attribute in fuzzy clustering.
The algorithm may be summarized as follows: Step 1: Give the initial values to centreQk.
Step 2: Fix centreQk and minimize Fwith respect to attribute gjk.
Step 3: Fix attribute gjkand minimize Fwith respect to centreQk.
Step 4: Repeat Steps 2-3 until the convergence criterion is satisfied.
4. EPSO
In this section, EPSO of evolutionary computation is described [22, 23]. It is based on PSO (Particle Swarm Optimization) that makes use of swarm intelligence [21]. EPSO is extended to apply evolutionary strategy to PSO in a way that the parameters are updated at each iteration.
First of all, PSO is outlined. In 1995, Kennedy and Eberhart developed PSO that made use of swarm intelligence to find out better solutions with multi-point search. The algorithm was designed to evaluate better solutions by sharing information on good solutions. PSO stems from analogy of foraging behavior of birds or fishes and focuses on the location and velocity of group agents. In other words, the location of agents in PSO correspond to the solution candidates. The updating rule of the solution may be written as
1 1 t i t i t i S V S
t i t i i t i ti wV w rand pbest S w rand gbest S
V 1 0 1䞉 䞉 2䞉 䞉
PSO updates the solution by changing the location and velocity of agents or populations. However, it is known that PSO has a drawback that the obtained solution is affected by the initial conditions of weights. Namely, it easily gets stuck in a local minimum.
Next, EPSO is described. In 2002, Miranda and Fonsceca proposed EPSO to overcome the drawback of PSO. Evolutionary Strategy (ES) was introduced into PSO to update the weights. The use of ES brings about reproduction of agents, mutation, and selection in PSO. The main difference between PSO and EPSO is that EPSO changes the weights at each iteration by the mutation while PSO does not. The updating rule of the solution may be rewritten as
1 1 t i t i t i S V S
t i i t i i i t i i t i w V w pbest S w gbest S V 0 1 2 1 1 , 0 N w wik ikWc 3 i w gbest gbest 1 , 0 3 3 w N wi i WcEPSO has a strategy to escape from a local minimum with the mutation in the neighbourhood of the best solution in a group of the solution candidates.
5. Proposed method
In this paper a GP-based method is proposed to predict one-step ahead electricity price with several uncertainties. GP has advantages that it provides more accurate predicted average values and error bars. As a result the use of GP provides the users to take a catbird seat in power markets. To improve the performance of GP, this paper makes use of fuzzy c-means as a prefilitering technique and EPSO to evaluate better hyperparameters. In addition, the Mahalanobis kernel is used to capture data distribution without the assumption that data is scattered around the centre
[25]. Fig. 1 shows the concept of the proposed method, where fuzzy c-means classifies data into three clusters, GP is constructed at each cluster and EPSO works to evaluate better hyperparameters at each GP. The use of fuzzy c-means make the leaning of GP easier due to data similarity at each cluster. In addition, outliers such as spikes are assigned
to a cluster so that the model accuracy is improved as a whole. As a conventional method, k-means of hard clustering was used to deal with prefiltering data. For the cluster with spikes, the model accuracy deteriorates due to shortage of learning data. This paper replaces k-means with fuzzy c-means of soft clustering to increase the number of learning data. Therefore, it is expected that the use of fuzzy c-means improves the model accuracy. Also, EPSO is used to evaluate the hyperparameters in MAP estimation. The conventional method uses the gradient method, but this paper employs EPSO by setting the solution obtained by the gradient method to be the initial solution. That is because the solution obtained by the gradient method is locally optimal and the use of the solution seems more efficient in evaluating a globally optimal solution or its approximate ones wth EPSO of evolutionary computation. Furthermore, this paper utilizes the Mahalanobis kernel to improve the performance of GP. The conventional GP uses the Gaussian kernel as follows:
¸ ¸ ¸ ¹ · ¨ ¨ ¨ © § 2 2 2 exp , G j i j i x x x x K VThis paper employs the Mahalanobis kernel in (31) due to good performance in a way that data distribution is expressed by hyper oval rather than a hyper cube. It may be written as
¸¸ ¹ · ¨¨ © § ' ' exp ' ,x x x T 1 x x x M M M Q m K G
The algorithm of the proposed method may be summarized as follows: Step 1: Set initial conditions and normalize input data.
Step 2: Classify input data into Kclusters.
Step 3: Prepare a priori distribution and evaluate the hyperparamer at each cluster with EPSO Fig.1. Concept of the proposed method.
Input Data Cluster 1 Output GP 1 Fuzzy C-means GP 2 GP 3 EPSO EPSO EPSO Cluster 2 Cluster 3
Step 4: Maximize the cost function of (17) to obtain TMAPat each cluster.
Step 5: Evaluate the average and variance of the predicted value with obtainedTMAP,(13) and (14). 6. Simulation
6.1. Simulation Conditions
The proposed method was applied to real LMP data of in Boston of ISO New England. One-step ahead prediction of LMP was made to demonstrate the performance of the proposed method. As learning and test data, the followings were used:
Learning data: hourly LMP data from July 1 to 31 in 2011 and 2012 which amounts to 1488 data. Test data: hourly LMP data from July 1 to 31 in 2013 which amounts to 744 data.
The proposed method was compared with other methods in terms of the average and maximum errors as well as the variance of errors. For convenience, the following methods were defined:
Method A: MLP (Multi-Layer Perceptron) of ANN Method B: GP with the Gaussian kernel (Conventional GP) Method C: GP with the Mahalanobis kernel
Method D: GP with the Mahalanobis kernel and k-means as the prefiltering technique
Method E: GP with the Mahalanobis kernel, k-means as the prefiltering technique and EPSO for MAP estimation Method F: GP with the Mahalanobis kernel, fuzzy c-means as the prefiltering technique and EPSO for MAP
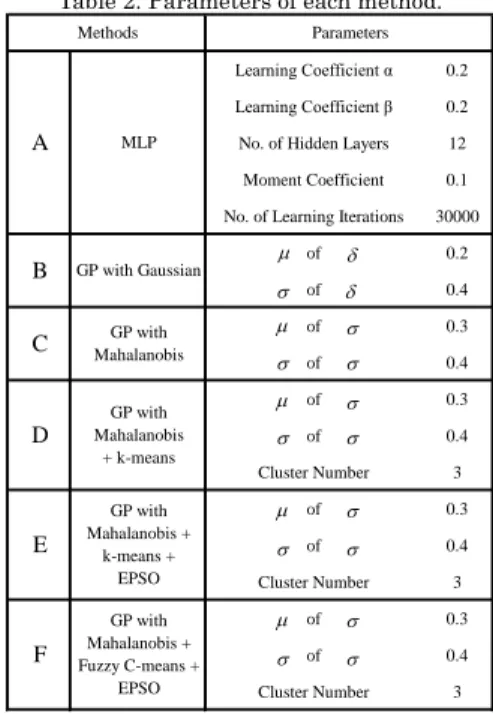
Table 1 shows input and output variables for Methods A-F. Also, Table 2 gives parameters of each method that were tuned up by preliminary simulation.
Table 1. Input and output variables.
Variables Contents Time T (1䈈24[hour]) Day-ahead demand at Time T
Day-ahead LMP at Time T Day-ahead energy component at Time T Day-ahead marginal loss component at Time T
Real time LMP at Time T Real time energy component at Time T Real time marginal loss component at Time T
Dry bulb temperature in degrees Fahreneit Dew Point temperature in degrees Fahreneit
Real Time LMP at time T+1
T x1 T x2 T x3 T x4 T x5 T x6 T x7 T x8 y T x9 T x10
Table 2. Parameters of each method.
/HDUQLQJ&RHIILFLHQWĮ 0.2 /HDUQLQJ&RHIILFLHQWȕ 0.2 No. of Hidden Layers 12
Moment Coefficient 0.1
No. of Learning Iterations 30000
of 0.2 of 0.4 of 0.3 of 0.4 of 0.3 of 0.4 Cluster Number 3 of 0.3 of 0.4 Cluster Number 3 of 0.3 of 0.4 Cluster Number 3 F GP with Mahalanobis + Fuzzy C-means + EPSO D GP with Mahalanobis + k-means Parameters A B C Methods GP with Mahalanobis GP with Gaussian MLP E GP with Mahalanobis + k-means + EPSO P V V V V G P V V V P G P V V V P V V V
6.2. Simulation results
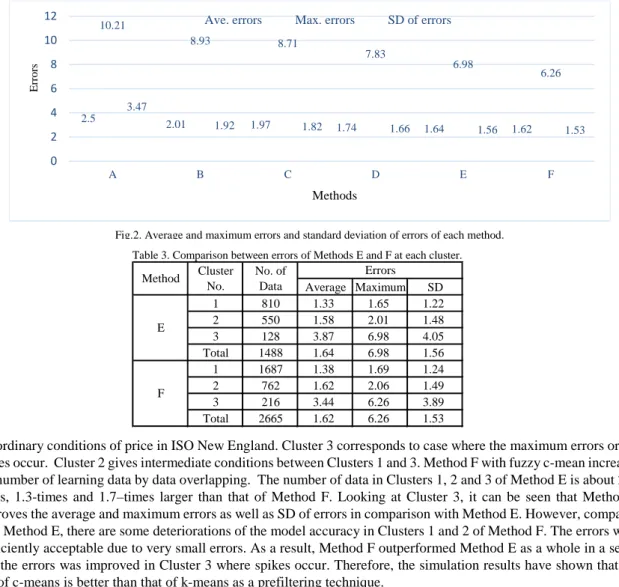
Fig. 2 shows the average, maximum errors and standard deviation (SD) of errors for Methods A-F. Method C improved 21.2% and 1.99 % of the average errors, 14.7% and 2.46%, and 45.8% and 5.21% of SD for Methods A and B, respectively. It can be seen that GP has better performance than MLP of ANN and the use of the Mahalanobis kernel gave better results than that of the Gaussian kernel. That is because, the Mahalanobis kernel has better function to capture data distribution with hyperoval appropriately. Method D succeeded in reducing 11.7 % of the average error, 10. 1% of the maximum error, and 8.79% of SD for Method C. It was confirmed that the use of prefiltering technique was effective for enhancing the model accuracy. Also, Method E reduced 5.75% of the average error, 10.9% of the maximum error and 6.02% of SD for Method D, which means that EPSO contributes to the reduction of errors by evaluating better hyperparameters. Furthermore, a comparison was made between Methods E and F. Method F of the proposed method reduced 1.22% of the average error, 10.3% of the maximum error and 1.92% of SD for Method F. It can be observed that the use of fuzzy c-mean of soft clustering is better than that of k-means of hard clustering. That is because fuzzy c-means allows a piece of data on the boundary to belong to two or more clusters.
Table 3 shows the average error, the maximum error and SD at each cluster of Methods E and F. Cluster 1 shows
the ordinary conditions of price in ISO New England. Cluster 3 corresponds to case where the maximum errors or the spikes occur. Cluster 2 gives intermediate conditions between Clusters 1 and 3. Method F with fuzzy c-mean increases the number of learning data by data overlapping. The number of data in Clusters 1, 2 and 3 of Method E is about 2.0-times, 1.3-times and 1.7–times larger than that of Method F. Looking at Cluster 3, it can be seen that Method F improves the average and maximum errors as well as SD of errors in comparison with Method E. However, compared with Method E, there are some deteriorations of the model accuracy in Clusters 1 and 2 of Method F. The errors were sufficiently acceptable due to very small errors. As a result, Method F outperformed Method E as a whole in a sense that the errors was improved in Cluster 3 where spikes occur. Therefore, the simulation results have shown that the use of c-means is better than that of k-means as a prefiltering technique.
Fig.2. Average and maximum errors and standard deviation of errors of each method. 2.5 2.01 1.97 1.74 1.64 1.62 10.21 8.93 8.71 7.83 6.98 6.26 3.47 1.92 1.82 1.66 1.56 1.53 0 2 4 6 8 10 12 A B C D E F E rrors
Ave. errors Max. errors SD of errors
Table 3. Comparison between errors of Methods E and F at each cluster.
Average Maximum SD 1 810 1.33 1.65 1.22 2 550 1.58 2.01 1.48 3 128 3.87 6.98 4.05 Total 1488 1.64 6.98 1.56 1 1687 1.38 1.69 1.24 2 762 1.62 2.06 1.49 3 216 3.44 6.26 3.89 Total 2665 1.62 6.26 1.53 F Errors E Method Cluster No. No. of Data Methods
7. Conclusion
This paper has proposed an efficient method for electricity price forecasting. The proposed method made use of Gaussian Process of hierarchical Bayes estimation with the Mahalanobis kernel for the predictor engine, EPSO of evolutionary computation for evaluating better hyperparameters in MAP estimation and fuzzy c-means of soft clustering as a prefiltering technique. The proposed method was successfully applied to real LMP data of New England ISO, USA. The simulation results have shown that the proposed method provides better results than MLP and the conventional Gaussian Process.
References
1. Vogt LJ. Electricity pricing. Boca Raton, FL: CRC Press; 2010.
2. Harris C. Electricity markets pricing, structures and economics.New York, NY: Wiley; 2006.
3. Ma Y, Luh PB, Kasiviswanathan K, Ni E. A neural network-based method for forecasting zonal locational marginal prices.Proc. of IEEE PES General Meeting 2004;1, p.296-302.
4. Leevongwat I, Rastgoufard P. Forecasting locational marginal pricing in deregulated power markets.Proc. of IEEE PES PSCE 2009; p.1-9 . 5. Litvinov E, Zheng T, Rosenwald G, Shamsollahi P. Marginal loss modeling in LMP calculation.IEEE Transactions on Power Systems, 2004;19:
p.880-888
6. Li Z, Daneshi H. Some observations on market clearing price and locational marginal price.Proc. of IEEE PES General Meeting 2005,2005;
2: p.2042-2049.
7. Mori H, Awata A. Normalized RBFN with hierarchical deterministica annealing clustering for electricity price forecasting.Proc. of IEEE PES General Meeting 2007, 2007; p.1-7.
8. Mori H, Kosemura N, Kondo T, Numa K. Data mining for short-term load forecasting.Proc. of IEEE PES Winter Meeting 2002, 2002;.1: p.623-624.
9. Mori H, Awata A. A hybrid method of clipping and artificial neural network for electricity price zone forecasting.Proc. of PAMPS 2006, 2006; p.1-6.
10. Garcia RC, Contreras J, Akkeren Mv, Garcia JBC. A GARCH forecasting model to predict day-ahead electricity prices.IEEE Trans. on Power Systems,2005;20: No.2, p.867-874.
11. Wang AJ, Ramsay B. A neural network based estimator for electricity spot-pricing with particular reference to weekend and public holidays.
Neurocomputing, 1998;23: issues 1-3, p.47- 57.
12. Iyer V, Fung CC, Gedeon T. A fuzzy-neural approach to electricity load and spot-price forecasting in a deregulated electricity market. Proc. of IEEE TENCON 2003, 2003; 4: p.1479-1482
13. Yamin HY, Shahidehpour SM, Li Z. Adaptive short-term electricity price forecasting using artificial neural networks in the restructured power markets.International Journal of Electrical Power & Energy Systems,2004; 26: No.8, p.571-581.
14. Hong YY, Lee, CF. A neuro-fuuzy price forecasting approach in deregulated electricity markets.Electricity Power Systems Research, 2005;
73: No.2, p.151-157.
15. Mori H, Ohmi M. Probabilistic short-term load forecasting with Gaussian processes.Proc. of IEEE Intelligent Systems Application to Power Systems 2005 (ISAP2005), 2005; p.452-457.
16. Mori H, Nakano K. Application of Gaussian process to locational marginal pricing forecasting.Procedia Computer Science, 2014;36: p.220-226.
17. Neumann M, Kersting K, Xu Z, Schulz D. Stacked Gaussian process learning.Proc. of IEEE ICDM' 09, 2009; p.387-396
18. Usha TM, Balamurugan SA Knowledging on Tamil Nadu Electiricity Board (TNEB) and electricity load demand forecasting by Gaussian processes using real time data. Proc. of ICCCNT 2013, 2013; p.1-8.
19. Rasmussen CE, Williams CKI. Gaussian processes for machine learning. Cambrige, MA: The MIT Press; 2006. 20. Bishop, CM.Pattern recognition and machine learning. New York, NY: Springer; 2006.
21. Kennedy J, Eberhart R. Particle swarm optimization.Proc. of IEEE Neural Networks 1995,1995;4: p.1942-1948.
22. Miranda V, Fonseca N. EPSO-best-of-two-worlds meta-heuristic applied to power system problems.Proc. of IEEE CEC 2002,2002; p.1080-1085.
23. Miranda V, Fonseca N. EPSO-evolutionary particle swarm optimization, a new algorithm with applications in power systems.Proc. of IEEE PES T&D 2002, 2002; 2: p.745-750.
24. Dunn JC. A fuzzy relative of the ISODATA process and its use in detecting compact well-separated clusters.Journal of Cybernetics, 1973; 3: p. 32-57.