Worcester Polytechnic Institute
Digital WPI
Doctoral Dissertations (All Dissertations, All Years) Electronic Theses and Dissertations
2017-04-21
Theory and Practice: Improving Retention
Performance through Student Modeling and
System Building
Xiaolu Xiong
Worcester Polytechnic Institute
Follow this and additional works at:https://digitalcommons.wpi.edu/etd-dissertations
This dissertation is brought to you for free and open access byDigital WPI. It has been accepted for inclusion in Doctoral Dissertations (All Dissertations, All Years) by an authorized administrator of Digital WPI. For more information, please [email protected]. Repository Citation
Xiong, X. (2017).Theory and Practice: Improving Retention Performance through Student Modeling and System Building. Retrieved from
Theory and Practice: Improving Retention Performance
through Student Modeling and System Building
by Xiaolu Xiong
A Thesis
Submitted to the Faculty of the
WORCESTER POLYTECHNIC INSTITUTE In partial fulfillment of the requirements for the
Degree of Doctor of Philosophy in
Computer Science by
April 2017 APPROVED:
Professor Joseph E.Beck, Thesis Advisor
Professor Neil T.Heffernan, Committee member
Professor George T.Heineman, Committee member
Abstract
The goal of Intelligent Tutoring systems (ITSs) is to engage the students in sustained reasoning activity and to interact with students based on a deep understanding of student behavior. In order to understand student behavior, ITSs rely on student modeling methods to observes student actions in the tutor and creates a quantitative representation of student knowledge, interests, affective states. Good student models are going to effectively help ITSs customize instructions, engage student’s interest and then promote learning. Thus, the work of building ITSs and advancing student modeling should be considered as two interconnected components of one system rather than two separate topics.
In this work, we utilized the theoretical support of a well-known learning science theory, the spacing effect, to guide the development of an ITS, called Automatic Reassessment and Relearning System (ARRS). ARRS not only validated the effec-tiveness of spacing effect, but it also served as a testing field which allowed us to find out new approaches to improve student learning by conducting large-scale ran-domized controlled trials (RCTs). The rich data set we gathered from ARRS has advanced our understanding of robust learning and helped us build student models with advanced data mining methods. At the end, we designed a set of API that supports the development of ARRS in next generation ASSISTments platform and adopted deep learning algorithms to further improve retention performance predic-tion. We believe our work is a successful example of combining theory and practice to advance science and address real-world problems.
Acknowledgements
I would like to express my gratitude to my advisor, Professor Joseph Beck, who spent countless hours with me in our meetings, and always kept his cool when I wrote something naive or even stupid.
My thanks are also due to my Professor Neil Heffernan. The ASSISTments project is such a wonderful research platform to work with, all thanks to the time and effort he devoted to create and advance it.
Thanks also to Professor George Heineman and Dr. Piotr Mitros, for providing feedback and suggestions so I can bring my thesis to a higher level.
My gratitude also goes to my colleges at ASSISTments lab, my study at WPI would be many years longer without their help and support.
Contents
1 Introduction 1
1.1 Intelligent Tutoring System . . . 1
1.2 Adaptive learning system . . . 3
1.3 ASSISTments: An evolving intelligent tutoring system . . . 7
1.4 Issues addressed in the dissertation work . . . 10
2 Automatic Reassessment and Relearning System (ARRS) 12 2.1 Introduction . . . 12
2.2 Automatic Reassessment and Relearning System (ARRS) . . . 15
2.3 The effectiveness of ARRS . . . 18
2.3.1 Measuring effectiveness by effect size of learning gain . . . 19
2.3.2 ARRS improves student’s long-term retention performance . . 20
2.4 Mastery speed and retention performance . . . 24
2.5 Personalized Adaptive Scheduling System (PASS) . . . 30
2.5.1 The impact of PASS . . . 33
2.6 ASSISTments Workflow: building assistment relationships for the next generation ASSISTments . . . 40
2.6.2 ASSISTments as an authoring tool to support adaptive
learn-ing and education research . . . 42
2.6.3 ASSISTments Workflow . . . 48
3 Modeling Retention Performance 60 3.1 Introduction . . . 60
3.2 Student Modeling . . . 61
3.3 Modeling retention performance . . . 63
3.3.1 Data set and Features . . . 65
3.3.2 Evaluation and Analysis . . . 72
3.4 Modeling retention performance with deep learning . . . 87
3.4.1 Issues of deep knowledge tracing model . . . 90
3.4.2 Modeling retention performance with deep learning . . . 92
4 Conclusion 102
List of Figures
1.1 A screen shot of ASSISTments tutor interface . . . 8
2.1 The enhanced ITS mastery cycle . . . 14
2.2 Workflow design of Automatic Reassessment and Relearning System (ARRS) . . . 17
2.3 Pre-post test performance comparison of homework only vs homework + ARRS . . . 22
2.4 Workflow of Personalized Adaptive Scheduling System (PASS) . . . . 31
2.5 Post test performance comparison of ARRS vs PASS . . . 38
2.6 Next generation ASSISTments’ model structure . . . 41
2.7 An example of simple study within an assignment . . . 44
2.8 An example of multiple-assignment experiment workflow . . . 47
2.9 ASSISTments SDK API Block Diagram . . . 49
2.10 Conceptual class diagram of Workflow API . . . 53
2.11 Workflow ER digram . . . 54
3.1 A subset of the Common Core skill map . . . 70
3.2 Stability test of PFA and ARP models . . . 83
3.3 Stability test of ARP and ARP 5-feature models . . . 87
3.5 DRP hyperparameter optimization . . . 99
List of Tables
2.1 Performance comparison of all students (maximizes external validity . 21
2.2 Performance comparison of students who completed all 5 skill builders 23
2.3 Relationship between mastery speed and retention test performance . 25
2.4 Retention performance by mastery speed bins and test delays . . . . 27
2.5 Mapping between mastery speed and level 1 retention delays . . . 32
2.6 Average days spent between level 1 and level 2 reassessment tests . . 35
2.7 Average test counts between level 1 and level 2 reassessment tests . . 36
2.8 Long-term retention performance comparison and sample size (in
parenthesis) . . . 37 3.1 Feature rankings . . . 75
3.2 Model performance of PFA and ARP models . . . 78
3.3 Testing performance of PFA, ARP and ARP 5-feature models . . . . 86
3.4 Replicate DKT experiments with corrected ASSISTments 2009-2010
data set . . . 92
3.5 Prediction performance comparison of DRP model and ARP 5-feature
model . . . 95 A.1 Pre- and post-test performance comparison on homework completed
List of Algorithms
1 Stability test against over-fitting (m, d, n) . . . 82 2 Random subset feature selection (n, k) . . . 85
Listings
2.1 WorkflowManger interface . . . 50 2.2 WorkflowNode interface . . . 51 2.3 WorkflowProceedCondition interface . . . 52 2.4 WorkflowProceedAction interface . . . 52 2.5 MasteryLearningNode implementation . . . 55 2.6 AssignArrsOnCorrectnessAction implementation . . . 56 2.7 AssignmentFinishCondition implementation . . . 58Chapter 1
Introduction
1.1
Intelligent Tutoring System
In the early 1970s, a few researchers defined a new and ambitious goal for computer-based instruction. They adopted the human tutor as their educational model and sought to apply artificial intelligence techniques to realize this model in ”intelligent” computer-based instruction [NMB10]. This is the birth of intelligent tutoring sys-tems (ITSs). The goal of ITSs is to engaging the students in reasoning activity and to interact with the student based on a deep understanding of the student’s behav-ior. ITSs are characterized by giving students and electronic form, natural language dialogue, simulated instrument panel, or another user interface that allows them to enter the steps required for solving the problem. The point is ITS gives feedback and hints on each step to promote student learning. If such systems realize even half the impact of human tutors, the payoff of society to be substantial [CKA97].
After decades of development, studies have shown that ITSs are performing as effective as human tutoring when comparing them with the same standard of learning performance. Inspired by two most plausible factors that help human tutors
effective at teaching, feedback and scaffolding [Van11], step-based tutoring has been benefited from creating fine granularity of user interface to utilize interactive between students and computer tutor. The reasons why feedback and scaffolding help to tutor are such: the frequent feedback of human tutoring makes it much easier for students to find flaws in their reasoning and fix their knowledge because human tutors encourage students to explain their reasoning as they go and usually intervene as soon as they hear the incorrect reasoning. The other factor, scaffolding is also common in human tutoring. Experiments manipulating scaffolding’s usage suggest that is is an effective instructional method. To sum up, the best explanation so far is that human tutors better at scaffolding students and giving feedback that helps students to engage in interactive and constructive behaviors as they self-repair and construct their knowledge [Van11].
On the other hand, a study known as Bloom’s “2 sigma problem” [Blo84] shows that human tutoring has an effect size (defined as the difference between two means divided by a standard deviation for the data [Coh88]) ofd = 2.0 relative to classroom teaching without tutoring, which is more than twice over any ITS tutoring. A closer look at this study suggests that large effect size seems to be due mostly to hold the students to a higher standard of mastery. The definition of mastery differs from system to system. In this particular study, the students had to score 80% on a mastery exam before being allowed to continue to the next unit, and students in the classroom control took the exams but always went on to the next unit regardless of their scores. So the Bloom article is, as Bloom intended it to be, a demonstration of the power of mastery learning rather than a demonstration of the effectiveness of human tutoring.
Compared to improving human tutoring, studies have shown that there are many ways of improving the performance of ITS, that is, step-based tutors and
substep-based tutors. Researchers have found many pedagogical mistakes and missed
op-portunities in existing ITSs’ performance as well [BdCR+09, dB09, MV06]. Merely
finding and fixing these pedagogical mistakes may produce a 2 sigma effect size [Van11]. Another approach can be even automated. For instance, a study of
adap-tive pedagogical strategy making has shown that a d = 0.84 improvement over
original tutoring system [CVLJ11] by applying a machine learning technique (rein-forcement learning) to log data from a substep-based tutoring in order to adjust the parameters that controlled its pedagogical decision.
In short, from the results we see so far we can say that: for ITS, the granularity of user interface of step-based helps computers work as effective as human tutoring. Furthermore, it is clear that there are at least two approaches to developing a sys-tem that can deliver the two times of effectiveness than no tutoring, that is through promoting a high standard of mastery learning and re-engineering the tutor-student interactions with adaptive learning environments. These two approaches have been adopted by my work here and I will describe how I utilize them to develop an adap-tive learning system which helps improve student’s long-term retention performance by scheduling retention tests and relearning assignments.
1.2
Adaptive learning system
Feedback and scaffolding are in fact two forms of adaptivity and individualization. A tutor, either human or computer, needs to decide about what activity to do next is based on the student’s behavior, so the tutor is adapting its behavior to the students. To be more specifically, feedback and scaffolding are “micro-adaptive” methods which allow the tutor decides whether to remind silent, to give feedback, to give a hint, to do the next step for the student, and so forth [Van11].
The term adaptive is defined as a capability to change when necessary in order to deal with different situations. In the context of ITS, Adaptive learning is con-sidered to be an alternative to the traditional “one size fits all” approach and has encouraged the development of teaching and learning toward a dynamic learning process of learning [BA10]. Adaptive learning is about creating a learner experience that purposely adjusts to various conditions (personal characteristics, pedagogical knowledge, the learner interactions, and the outcome of actual learning processes) over a period of time with the intention to increase predefined success criteria. An adaptive system should be capable of: managing explicitly defined learning routes adapted to each user, monitoring the activities of users; interpreting these on the basis of domain-specific models; inferring user requirements and preferences out of the interpreted activities, appropriately representing them in terms of user models; and finally acting upon the available knowledge on users and the subject matter at hand, to dynamically facilitate the learning process. In short, adaptive learning has the following advantages [SS08]:
“
• optimization of individual learning performance;
• formal representation of the knowledge domain for assembly of knowledge
objects to encourage a particular educational trajectory;
• inclusion of various learning styles and strategies for the inference of learners’ preferences;
• performance evaluation mechanisms for continuous assessment of achievement
of learning goals; and
”
Most of researchers have suggested than four main approaches can be identified to present all adaptive learning system [BA10]:
1. Macro-adaptive approach
The components of macro-adaptive approach that define the general guide-lines for ITS are mainly based on a student’s profile. These components are learning goals or levels of detail, delivery systems, intellectual abilities and prior achievement, cognitive and learning styles, academic motivation, and personality. Learners differ from each other in learner characteristics such as intellectual capabilities, learning preferences, cognitive and learning styles, prior knowledge and experience and self-efficacy. These characteristics affect ITS in different ways. For example, learners’ preferences are taken into account in various ways such as adapting language, presentation of learning content and group models. On the other hand various systems in the scope of adap-tive hypermedia, as with methods like adapadap-tive navigation support, focus on learner control.
2. Aptitude-treatment interaction approach
This approach suggests different types of instructions and/or different types of media for different students, that is, it adapts instructional strategies to stu-dents’ aptitudes. One of the most important aspects of the aptitude-treatment interaction approach is the user’s control over the learning process according to the abilities of the students by giving them full or partial control over the style of the instruction or the way through the course. There are three levels of control, complete independence, partial control within a given task sce-nario, and fixed tasks with control of pace. Several studies also found that
the success of different levels of learner control is strongly dependent on the students aptitudes, that is, it is better to limit the control for students with low-prior knowledge knowledge or to enhance learning for students who have high performance
3. Micro-adaptive approach
This approach requires monitoring the learning behavior of the student while running specific tasks and adapting the instructional design afterwards, based
on quantitative information. When compared to the macro-adaptive and
the aptitude-treatment interaction approach, the micro-adaptive approach is rather based on on-task measurements. The student behavior and performance are observed by measuring response errors, response latencies and emotional states. Such measures considered during the course of tutoring can be ap-plied on the manipulation and optimization of instructional treatments and sequences on a much more refined scale. Thus, micro-adaptive instructional models using on-task measures are likely to be more sensitive to the students needs.
4. Constructivist-collaborative approach
This approach focuses on how the student actually learns while sharing her/his knowledge and activities with others. An important element which differenti-ates this approach from the first three is the use of collaborative technologies which are considered often as main component of online learning. The learner has an active role in the learning process constructing her/his own knowledge using her/his experiences in a context in which the target domain is integrated. Akhras et al. [AS00] argued that constructivistic learning might benefit from a systems intelligence including mechanisms of knowledge representation,
rea-soning, and decision-making. Therefore, an adaptive system provides learning by focusing on the way of gaining knowledge and should take into account the context, learning activities, cognitive structures of the content, and the time extension.
The first three approaches are restricted to an old fashioned view on computer-aided learning and focus on the content and the learning process itself. With respect to new learning theories and technology, this approach treats topics like constructivism and adaptive collaboration. However a modern system based on adaptation should consider all of these approaches to provide a wide range of possibilities in ITS.
1.3
ASSISTments: An evolving intelligent
tutor-ing system
Most of work described here is conducted in the ASSISTments platform, a web-based intelligent tutoring system focuses on mathematics tutoring. ASSISTments was first created in 2004 as a joint research conducted by Worcester Polytechnic Institute and
Carnegie Mellon University [RPA+09]. Its name, came from the idea of combining
assisting the student with automated assessment of the students proficiency at a fine-grained level [Gon14]. Thousands of middle- and high-school students were using ASSISTments for their daily learning, homework and preparing the MCAS tests. Just in the school year of 2014-2015, there were over 50,000 students using the system as part of their regular math classes across the states.
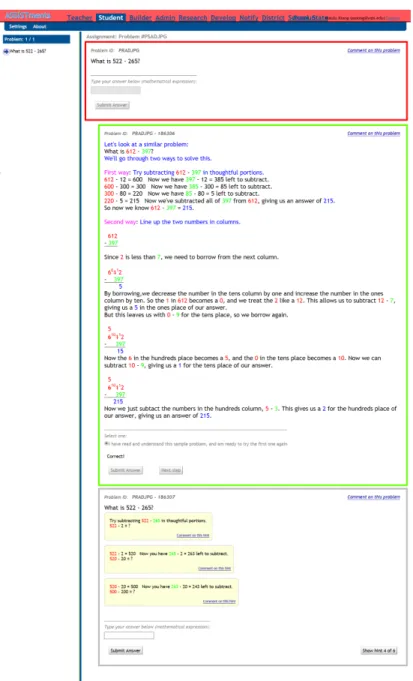
The ASSISTments is a typical step-based tutoring system. The core component of ASSISTments is an user interface called “Tutor” that interactives with students. A screen shot of ASSISTments tutor is shown in Figure 1.1. A student practices
Figure 1.1: A screen shot of ASSISTments tutor interface. This particular instance of ASSISTments tutor is a showing an example of scaffolding problems.
a problem in a linear manner and once the student enters an answer, the tutor is responsible to give feedback and/or help. Each problem in ASSISTments bundles together a main question for students to solve and the questions associated tutoring steps that can used to help students. There are two typical kinds of tutoring steps associated with the main question, there are:
1. Scaffolding questions: when a student gave a wrong answer on the main ques-tion, ASSISTments presents a series of scaffolding questions so as to break the main question down into steps. The student must answer each scaffolding question correctly in order to proceed to the next scaffolding question.
2. Hints: Hints are messages that provide insights and suggestions for solving a specific question. Typically, there are 2 to 5 hints associated with each scaffolding and main questions. After viewing a hint, the student is allowed to make one or more attempts to answer the question. If the student continues to have difficulties in solving this question, he/she can ask for more hints until finally a bottom-out hint is presented which provides the student the correct answer. The bottom-out hints are necessary to avoid the problem of a student becoming stuck and unable to proceed within the tutor.
It is also important to note that as a computer-based tutoring system, ASSIST-ments collects large amount of information from students and how they interact with the system. Beyond basic information such as the correctness of student re-sponse and the problem presented, the system log every student action while they interact with the system, so that the system is able to know more about students. Usually, students perform multiple actions when solving a question, The system logs all student actions which include: to give a response to a main question, to request a hint and to answer a scaffolding question. The system also time-stamped these
actions, so that not only what a student did is recorded, when he/she did it and how long it took is also known.
Using the structure of ASSISTments problems, and the effectiveness of step-based tutoring system, a key concept called the skill builder problem set was con-structed to address the need of reaching mastery in learning. A skill builder problem set usually focuses on one knowledge component or skill and it contains large num-ber of problems which have similar structure but different correct answers. Defining mastery may vary between systems. One measure of mastery includes next problem correctness, another is performance on a transfer questions, and yet another is per-formance on a delayed retention test. In the default settings of ASSISTments skill builder problem sets, achieving mastery is defined as answering three consecutive questions correctly in one skill builder problem set. Study shows that is a simple, yet effective way to determine mastery within an ITS [KWTH16].
1.4
Issues addressed in the dissertation work
This dissertation focuses on improving student learning and advancing cognitive science by constructing an adaptive tutor system and applying data mining and machine learning technologies on educational data sets. The work consists of the following three parts:
1. In Chapter 2, we describe the work of building an adaptive learning envi-ronment to improve students’ long-term retention performance. Automatic
Reassessment and Relearning System (ARRS) is a system that utilizes
spac-ing effect theory to assign expanding retrieval assignments to students. Along with ARRS’ adaptive algorithms, we have tests show that we can improve students’ retention learning performance significantly.
2. In Chapter 3, we describe our work on modeling students’ long-term retention performance. Intelligent tutoring systems, including ARRS, use student mod-els to understand students’ knowledge levmod-els. Therefore, being able to predict students’ performance after long delays is very crucial. In this part, we used innovative data mining methods to produce accurate predictions of student long-term retention performance. We show that not only can we utilize what we have learned in student modeling to improve the adaptive algorithms of ARRS system, we have also created a new performance metric to measure predictive models’ stability.
3. In the last part of this work, we explain our work of extending our work in Chapter 2 and 3. Along the development of next generation ASSISTments, we develop a set of modules that supports building generic assignment workflows to support several ASSISTments’ adaptive learning system, including ARRS. Inspired by the recent development of deep learning, we also experiment new approaches of using deep neural networks to model students’ long-term re-tention performance. Then we evaluate deep learning models with existing models in both prediction performance and interpretability.
Chapter 2
Automatic Reassessment and
Relearning System (ARRS)
2.1
Introduction
Currently, most ITSs present a sequence of problems and evaluate student perfor-mance directly after the student finishes solving or attempts to solve these problems to see if the student mastered the given skill [Min12]. The practices on the given skills usually stops after a student achieved mastery. The exact definition of mas-tery varies, it typically involves recent students performance level, and the process of detecting mastery does not involve the mechanism for the system to review stu-dents knowledge after a time period; nor does it know about stustu-dents long-term
performance. However, studies of psychology and EDM [And14, CPV+06, SE94]
suggested that students do not always retain what they have learned. Therefore, the local measure of student performance is insufficient and dangerous for ITS to promote a student just on the basis of short-term performance. This applies specif-ically to a cumulative subject such as mathematics: we are more concerned with
students capability to remember the knowledge that they acquired over a long period of time.
Previous student models focus on estimating student current knowledge, which is an efficient use of data to test students’ latent knowledge level, but provides limited guidance for tutorial decision making. Some researchers have carried out
work on long-term performance prediction. Qiu et al. [QQL+11] extended the
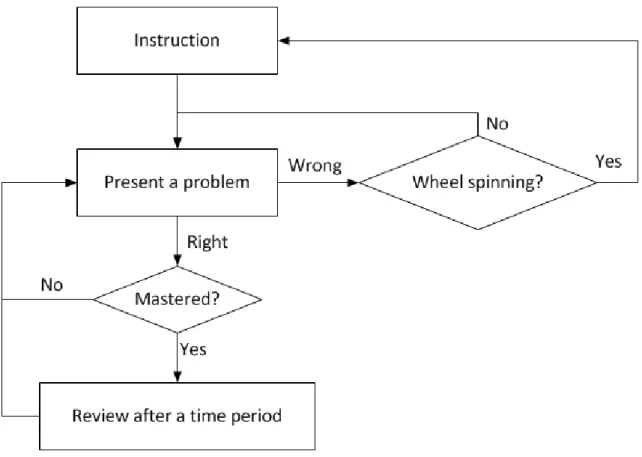
Knowledge Tracing (KT) model [CA94], to take into account that students exhibit the forgetting feature when a day elapses between problems in the tutor system. Pavlik and Anderson [PA05] studied alternative models of practice and forgetting what had been learned; this confirmed most importantly the standard spacing effect in various conditions and showed that wide spacing of practice provides increasing benefits as practice accumulates. This leads to students forgetting less afterwards as well. Furthermore in Wang and Becks work [WB12], the notion of mastery learning was expanded to take into account the long-term effect of learning and this identified several features; which are relevant to students long-term knowledge. In addition, they proposed an enhanced system of an ITS mastery cycle that can be used to discover new problems in the EDM field which can then lead to a higher mastery learning level. Figure 2.1 shows the structure of this system.
Our following work focuses on the diamond of the left side, the problem of designing a system that helps students better retain the skills they have learned and thus improve students long-term performance. As a matter of fact, the ability of retain a skill in long-term is one of the three indicators of robust learning [BGCO12]. Luckily, there is a well-established theory that can guide us to design such a system,
these theory are known as the spacing effect, which means repeatedly reviewing
learned information spaced out over time makes these items easier to remember [CVR+08]. Based studies of spacing effect, expanding retrieval practice [RB11] is
Figure 2.1: The enhanced ITS mastery cycle. This workflow aims to help students to achieve higher mastery learning level. Our work focuses on the diamond of the left side, the problem of designing a system that student better retain the skills they have learned.
often regarded as a superior technique for promoting long-term retention relative to equally spaced retrieval practice. Expanding retrieval practice works by, after the student learns a skill, having the student perform the skill at gradually increasing spacing intervals between successful retrieval attempts. Research has shown that spacing practice has a cumulative effect so that each time an item is practiced it receives an increment of strength [PA05].
2.2
Automatic Reassessment and Relearning
Sys-tem (ARRS)
Inspired by the need of improving students’ long-term retention performance in AS-SISTments and the design of the enhanced ITS mastery cycle [WB12], we developed
an extension called theAutomatic Reassessment and Relearning System (ARRS) in
the ASSISTments platform. Before we discuss ARRS, it is important to notice that the operation of ARRS is depend on another important compound of ASSISTments, the skill builder problem sets. Each skill builder problem set consist of hundreds of problems, and these problems are based on a specific skill. If a student uses the tutoring while working on skill builder problem sets, e.g: hint or break this problem into steps, the problem will be marked as incorrect. What makes the skill builder problem sets different from other regular problem sets is they adopt a simple notion of mastery, 3 consecutive correct responses (3-CCR), which means students must answer three questions correct in a row to complete a skill builder then the workflow of ARRS begins. Note that three problems for a skill represent the lower boundary for the amount of practice students require. However, if students make mistakes, they are required to obtain three correct answers in a row to additional problems. In fact, some students require over 20 practice attempts to reach mastery.
ASSIST-ments limits the daily practice number for a skill at 10 attempts, so these students need multiple days to master a skill.
The default workflow of ARRS is relatively simple, see Figure 2.2: after class-room teaching of a certain skill, teachers use ASSISTments to assign a problem set of that skill to students and students should first master that assigned problem set then ARRS assign 4 levels of reassessment tests to students: ARRS will then automatically reassess a student on the same skill 7 days later with the first level of reassessment test built from the same set of problems the student already mastered (i.e, for the same skill). If students answer the reassessment tests correctly, we treat them as they are still retaining this skill and promote him to the second level of reassessment test, and ARRS will continue to test two weeks later, a month later, and then finally two months after previous test. If a student fail a reassessment test, he will be given an opportunity to relearn the topic with relearning problems and be re-tested again after the same amount of delays (in number of days) in between tests.
Note that different from the above default behavior of ARRS, teachers have the option to make the system assign tests to students even if they have not yet started acquiring a skill or have not achieved skill mastery.
In the summer of 2012, we adapted the idea of enhanced ITS mastery cycle and implemented ARRS workflow into ASSISTments. ARRS was formally utilized by ASSISTments in September of 2012. Four years after the deployment of ARRS in ASSISTments, over 35,000 students have already used the ARRS system.
Figure 2.2: Workflow design of Automatic Reassessment and Relearning System (ARRS). ARRS automatically reassesses a skill that a student mastered 7 days ago. If the student fail a reassessment test, he/she will be given a opportunity to relearn the topic.
2.3
The effectiveness of ARRS
The first question we are interested in is whether ARRS can help improve students’ long-term retention performance and we conducted a randomized controlled trial to find out the answer of it . On February 2014, 111 freshman Algebra students in a middle school of New Jersey were given a pretest using ASSISTments to assess their prior knowledge in each type of assignment that would be administered during the six week study. Students had approximately 40 minutes to complete this pretest and all students received the same test on ASSISTments. After the test, students from various Algebra classes were assigned 3 sets of skill builder problem sets per week during the six week. Each set of 3 skill builders was released every Friday from February 28th through April 11th with one skill builder due on Monday night, Wednesday night, and Friday night, respectively. In the meantime, we randomly allocated students into two conditions: 55 students were assigned to the control group which can’t access ARRS practices on a set of 5 skill builder problem sets, and 56 students were assigned to the experimental group who can access ARRS practices on every skill builder problem sets. The default setting of ARRS extends the length of skill long-term learning process to at least 108 days, although these long delays of ARRS practices were aiming to improve student long-term retention, but some reassessments and relearning assignments wont be finished within the time frame of one semester. To insure every student has the chance to receive a reasonable number of ARRS practices, we built a customized ARRS schedule for this study. This study made sure that when the students complete a skill builder assignment, they would be assigned a reassessment of that particular skill 3 days later. If successfully completed, a second reassessment would be administered to the student 4 days after the first reassessment was completed. If the first reassessment
were not successful, the students would have to relearn the original skill before assigning the two reassessments. It is important to notice that the neither skill builder nor ARRS assignments are not mandatory, even for students in the ARRS condition, which means that some students may not complete these assignments as our required.
2.3.1
Measuring effectiveness by effect size of learning gain
In this study, we asked whether ARRS would affect students long-term performance on a set of 5 skill builder problem sets. In order to determine the answer of our questions, we examined students pre- and post-test performance in the two groupsof students, ARRS and control. In order to represent the effect of ARRS and
access it’s practical significance, we choose the standardized mean difference effect size statistic, commonly referred as the effect size or Cohen’s d. This effect size is defined as the difference between the mean of the intervention group and the mean of the control group on a given outcome measure divided by the pooled standard deviations for these two groups, as follows:
ES = XT −XC
sp
(2.1)
Where XT is the mean of the intervention sample on an outcome variable, XC
is the mean of the control sample on that variable, and sp is the pooled standard
deviation. The pooled standard deviation is obtained as the square root the weighted mean of the two variances, defined as:
sp =
s
(nT −1)s2T + (nC −1)s2C nT −nC−2
(2.2) wherenT and nC are the number of respondents in the intervention and control
groups, andsT andsC are the respective standard deviations on the outcome variable
for the intervention and control groups.
The effect size is typically reported to two decimal places and, by convention, has a positive value when the intervention group does better on the outcome measure than the control group and a negative sign when it does worse. Note that this may not be the same sign that results from subtraction of the control mean from the intervention mean. For example, if low scores represent better performance, e.g., as with a measure of the number of errors made, then subtraction will yield a negative value when the intervention group performs better than the control, but the effect size typically would be given a positive sign to indicate the better performance of the intervention group [LPY+12].
In our study of understanding ARRS’s effectiveness, we used each students’ learning gain, computed by using post-test performance subtracting the pre-test score, as the outcome measure. Using learning gain instead of only the post-test performance is because learning gain is assessed relative to normal student academic growth, and learning gain can provide a better representation of how much our
ARRS intervention would accelerate the academic growth [LPY+12].
2.3.2
ARRS improves student’s long-term retention
perfor-mance
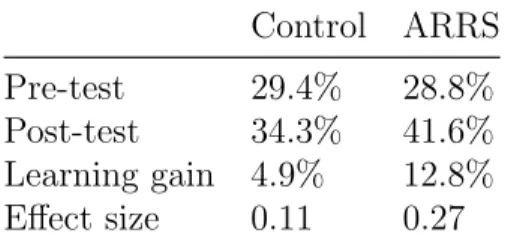
There were 8 students, who were absent for pre-test or post-test, we excluded from the following analysis (n = 103). The pre-test percentage correctness of control and experimental groups were very close (29.4% vs 28.8%).
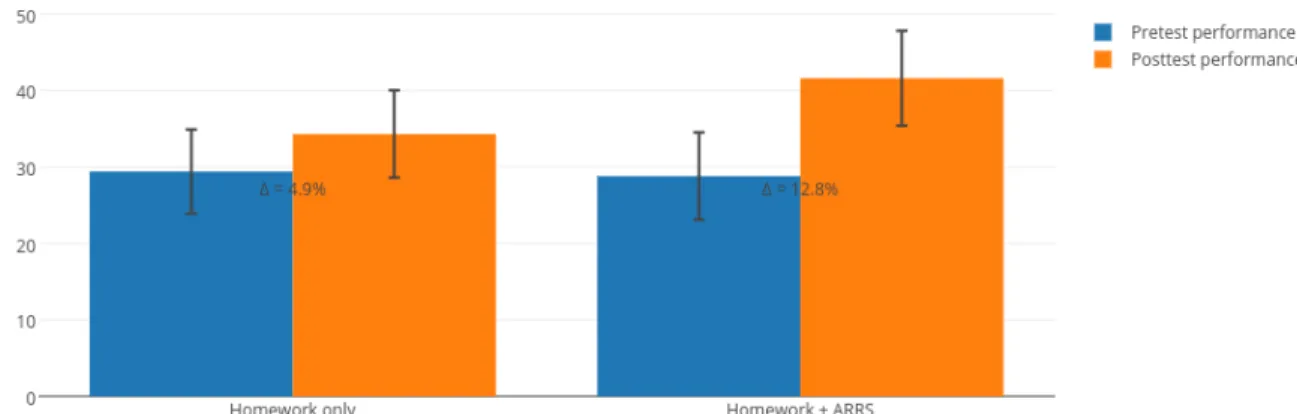
As we expected, students in ARRS condition had higher post-test performance than students in control group, but the improvement on post-test scores is not particularly large (34.3% vs 41.6%). However, the more important result to notice
here is the advantage of ARRS on learning gain, students in ARRS condition had much larger learning gain (12.8%) compared to students in control condition (4.9%). and we see that combining homework and ARRS is 2.5 times effective than just using homework in terms of effect size (0.11 vs 0.27). Table 2.1 and Figure 2.5 show the ARRS experiment results for all the students who took the post-test.
Table 2.1: Performance comparison of all students (maximizes external validity). This table contains all 103 student participated in our experiment. Learning gain is computed by using post-test performance minus pre-test performance.
Control ARRS
Pre-test 29.4% 28.8%
Post-test 34.3% 41.6%
Learning gain 4.9% 12.8%
Effect size 0.11 0.27
However, as we mentioned in the experiment design, it is not uncommon for students to not always complete assignments and if they didnt finish homework skill builders, no ARRS assignments will be assigned to them. In other words, some students in ARRS condition in fact worked as in the No-ARRS condition. Including such data in the study makes it difficult to determine the true effects of ARRS on certain students. To account for students who did not finishing the homework skill builders, we also looked how students performed if they finished these five skill builders. Apparently that each skill builders has different number of students who finished it, so we constructed Table A.1 to show experiment results of these skill builders separately. We have observed the students in ARRS condition not only always have higher post-test performance bu also achieve higher learning gain effect size expect the last skill builder PSABHZN (1.11 vs 0.99, p = 0.85). These results demonstrate again how ARRS and spaced practices can help students to improve their long-term performance.
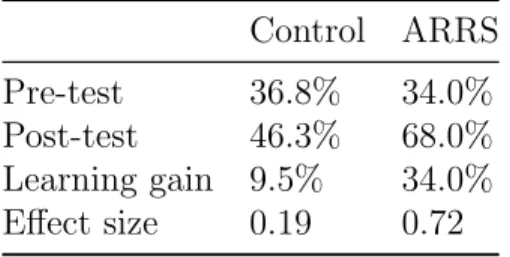
Figure 2.3: Pre-post test performance comparison of homework only vs homework + ARRS. Students in homework + ARRS condition have higher post test performance. For those whom have been accounted in Table A.1, there is a subset of stu-dents who finished all five homework skill builders, we believe that the post-test performance on these students should reflect the desired condition specified by the study. That is, all students finished their homework skill builders, but only some they can access the ARRS practice. We found out that there were 10 students from ARRS condition and 19 students from control condition who met this requirement. Although this approach maximizes internal validity, it also introduces a selection bias. Students who finished all their skill builders are not a random sample of the population, but rather are those who watch their homework more closely and paid more attention on their study. These non-random select effects make these students not perfectly representative of population as a whole. The tension between internal and external validity is common in field research and we also presented this part of data in Table 2.2: students in ARRS group has much higher post-test performance (68% vs 46.3%) and learning gain (34% vs 9.5%) when comparing to students in control group, as a results, we see a almost 4 time higher effect size close to on the
post-test performance (0.72 vs 0.19), Although, the difference on post-test is still not reliable (p = 0.23), but considering the small sample size and large effect size, it should be safe to say that using ARRS has improved students long term retention performance remarkably.
Table 2.2: Performance Comparison of students who completed all 5 skill builders. The table only contains students who finished all 5 homework skill builder assign-ments. In control condition, there are 19 students, and in the ARRS condition there are 10 students. Control ARRS Pre-test 36.8% 34.0% Post-test 46.3% 68.0% Learning gain 9.5% 34.0% Effect size 0.19 0.72
Despite this experiment suffering from the issue of relatively small sample size, it still shows us that spaced repetitions via reassessment and relearning are effective in supporting learning by improving students’ post-test performance. Another in-teresting student performance data is how students performed on their reassessment tests, more precisely, how students performed the first time they encounter a skill after mastering that skill, we called it the retention performance. In the students for completed all 5 skill builders, the overall retention performance is 66%. Note that this value only coves the 10 ARRS condition students, but since we have already estimated that student performance was balanced between the control condition and the ARRS condition, it is sensible to apply this retention performance on the control condition and see how forgetting affect students’ performance, which is a 20% performance decrease after skill mastery.
2.4
Mastery speed and retention performance
ARRS has a one-size-fits-all design that always assigns the first reassessment tests to a students seven days after skill mastery and fourteen days after passing the first reassessment, then it’s two weeks and one month and at last, two months later after the previous level. Students’ retention performance is a valuable measurement of skill mastery and degree of robust learning [BGCO12], thus understanding how students’ perform on the first level reassessment tests (seven days after skill mastery) has been become the next topic of our research.During our analysis our retention performance, we discovered a new feature,
mastery speed, has strong power to predict students’ retention performance. Mastery speed is the number of problems required to achieve mastery (3-CCR). We believe it represents a combination of how well a student know this skill originally, and how quickly he can learn the skill. We first noticed students have quite different values of mastery speed. High-knowledge students can easily answer 3 consecutive problems correctly while some low-knowledge students need more than ten opportunities to achieve mastery. In order to better comprehend mastery speed and to avoid over-fitting, we categorized possible mastery speed value into interpretable bins:
• High mastery level (3-4 problems): students answered 3 problems correctly in
a row or answered the first problem incorrectly but three consequent problems correctly after that.
• Medium mastery level (5-7 problems): students used some opportunities to
practices and they had approximately equal numbers of correct and incorrect attempts.
and endured very long sequences of problems, but eventually achieved three correct responses in a row.
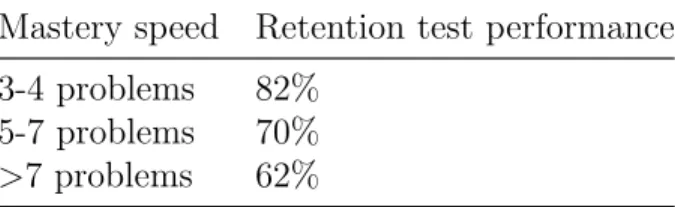
We also observed that, in general, the slower the mastery speed, the lower the probability that a student can answer reassessment tests correctly. Table 2.3 shows the relationship between student mastery speed and retention test performance. Table 2.3: Relationship between mastery speed and retention test performance. We see that slower mastery speed indicates lower probability of answering reassessment tests correctly.
Mastery speed Retention test performance
3-4 problems 82%
5-7 problems 70%
>7 problems 62%
This clear correlation between mastery speed and retention intrigued us to look deeper on how mastery speed interacts with delayed tests and spacing effect and it also suggests that students probably need personalized reassessment schedules fit their different learning patterns. So we decided to start the exploring the optimal retrieval schedules for different levels of students based on their mastery speed. We first conducted an experiment to investigate how different retention intervals affect students’ retention performance. There were several objectives for this experiment. A central goal was to investigate knowledge-related differences in terms of spac-ing and retention interval. As we mentioned before, students who receive retention tests have demonstrated mastery in the initial problem set, which we refer to as the mastery learning problem set. We already observed these students have signif-icantly differences in the fixed-schedule retention tests. Thus, it is worth to find out how mastery speed affects the retention performance given different intervals. This experiment tested students with different retention intervals to explore this question.
In this study, we have 672 middle and high school students from 34 classes as our experiment participants [XB14]. Teachers of these classes enabled ARRS in ASSISTments voluntarily, and they assigned mathematics mastery learning problem sets according to whatever instructional content they would normally cover in class. Teachers also required their students to use ASSISTments to finish their homework on a daily basis. Students were randomly allocated to one of four conditions which applied with different retention intervals: 174 students were assigned to the 1-day condition, 170 students were assigned to 4- day retention test condition, 162 students and 166 students were assigned to 7-day and 14-day condition. Students worked on their assignments in various environments include school computer labs, home computers and mobile devices. Prior to this experiment, students and teachers already had experiences of using ASSISTments and working with ARRS.
Students were randomly assigned to one of four retention interval conditions: 1-day, 4-day, 7-day, or 14-day. The differences among these conditions were the in-terval between achieving mastery and receiving the reassessment test. For example, Students in the 1-day condition received the corresponding retention tests the day after they finished the mastery learning problem sets; while students in 14-day con-ditions received reassessment test 14 days after they finished the mastery learning problem sets. It is important to notice that all reassessment tests were released only on weekdays; this particular behavior of ARRS was designed to cooperate with teachers, and it delayed the assigning of the retention tests which were scheduled to be released on Saturdays and Sundays.
This experiment began on September 15, 2013 and ended on December 15, 2013. During these three months, students constantly received mastery learning problem sets as homework assignments from their teachers. Once a student answered three consecutive questions correctly in a mastery learning problem set, a retention test
was scheduled based on which condition the student was in and ready to be assigned (e.g., 1, 4, 7, or 14 days after mastery). For mastery learning problems sets, to finish on time, students were required to complete it within one day of when the teacher
assigned it. Similarly, for ARRS tests, which were generated by ASSISTments
according to the appropriate schedule interval, students had one day to complete these tests. However, it was not uncommon for students to not always complete assignments on time. In fact, we see that students only completed about 40% of ARRS assignments on time.
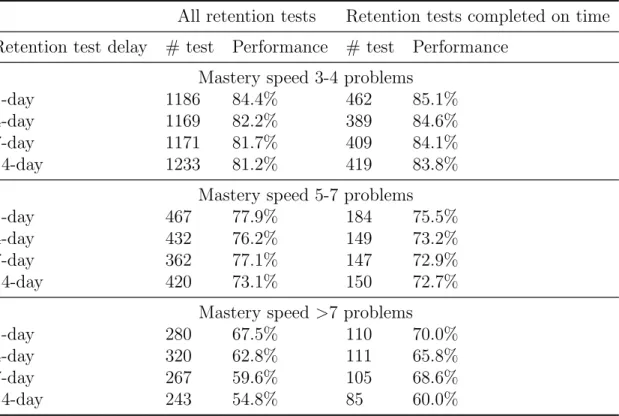
Table 2.4: Retention performance by mastery speed bins and test delays. Students were randomly put into different test delays. This table demonstrated a main ef-fect of mastery speed: students with slower mastery speed had significantly lower performance than students with a faster mastery speed.
All retention tests Retention tests completed on time
Retention test delay # test Performance # test Performance
Mastery speed 3-4 problems
1-day 1186 84.4% 462 85.1%
4-day 1169 82.2% 389 84.6%
7-day 1171 81.7% 409 84.1%
14-day 1233 81.2% 419 83.8%
Mastery speed 5-7 problems
1-day 467 77.9% 184 75.5%
4-day 432 76.2% 149 73.2%
7-day 362 77.1% 147 72.9%
14-day 420 73.1% 150 72.7%
Mastery speed >7 problems
1-day 280 67.5% 110 70.0%
4-day 320 62.8% 111 65.8%
7-day 267 59.6% 105 68.6%
14-day 243 54.8% 85 60.0%
In this study, we asked whether a different retention interval would affect stu-dents retention performance. We were particularly interested in whether or not longer spacing would impede students retention. In order to determine if different
retention interval affected students performance, we examined students retention test performance in different conditions.
As we expected, students in longer retention interval had lower retention per-formance than students in shorter retention interval, but none of the differences are particularly large, even the average 1-day performance (80.4%) and average 14-day performance (76.0%) only differed by 4.4%. We also noticed that students in the 4 days and 7 days conditions had very close retention performance, namely 77.6% and 77.5%, and this can be explained by the some portion of 4 days retention tests had been delayed one or two days to skip weekends.
When considering whether there were changes in retention performance of stu-dents with different mastery speed, we grouped the data by three identified mastery speed bins, then we also examined students retention test performance. Table 2.4 shows the retention performance by mastery speed bins and test delays.
The left part of Table 2.4 shows how students performed on retention tests, and includes data from all students. Including data from all students results in high external validity as it ensures that our results generalize to other, similar, populations of learners. However, we have seen some tests were completed more than one week later after they were due. Including such data in the study makes it difficult to determine which experimental condition the student was in. How should we analyze students who were in the 7-day condition but completed their retention test 14 days later? To account for students not being conscientious in completing retention tests on time, we have selected tests which were finished on time (finished no more than one day after released and made available to students). As a result, performance on these tests reflects retention performance on the intervals specified by the study. That is, a student in the 7-day condition was answering his retention test after a delay of between 7 and 8 days, but 14 days would not be possible.
Although this approach maximizes internal validity, it also introduces a selection bias. Students who finish their assignments on time are not a random sample of the population, but rather are those who watch their assignment schedules more closely, and those who cared more about finishing assignments on time. These non-random selection effects make these students not perfectly representative of the population as a whole. This tension between internal and external validity is common in field research, and we present both sets of data. We also noticed consistent decrease in retention performance with longer retention intervals across every groups of students, whether they were high mastery level, medium mastery level or low mastery level students. The results from Table 2.4 also demonstrated a main effect of mastery speed on retention performance: students with slower mastery speed had significantly lower performance than students with a faster mastery speed (p <0.01); this statement is true even when we comparing 1-day performance of students with slow mastery speed versus 14-day performance of students with fast
mastery speed (67.5% for mastery speed >7 problems versus 81.2% for mastery
speed on 3 or 4 problems). Another interesting effect is that students with slower mastery speed had larger decrease in retention performance as retention intervals got longer. For example, high mastery level student had a decrease of 3.2% between 1 day tests and 14 days tests but retention performance of low mastery level students dropped 12.7%. The horizontal comparisons on Table 2.4 also suggest that students who finished test on scheduled intervals were more likely to retain skills, confirming our suspicion above about these students not being a representative sample.
With this experiment, we believe we have revealed the relationships between master speed and retention performance in different test delays, and most impor-tantly, these relationships can be used to help us determine what kinds of learning techniques and reassessment schedules are most suitable for enhancing learning and
retrieving. More importantly, we formed a hypothesis that reassessment test delays probably should vary, rather than be fixed, based on the students’ knowledge of mastery speed.
2.5
Personalized Adaptive Scheduling System (PASS)
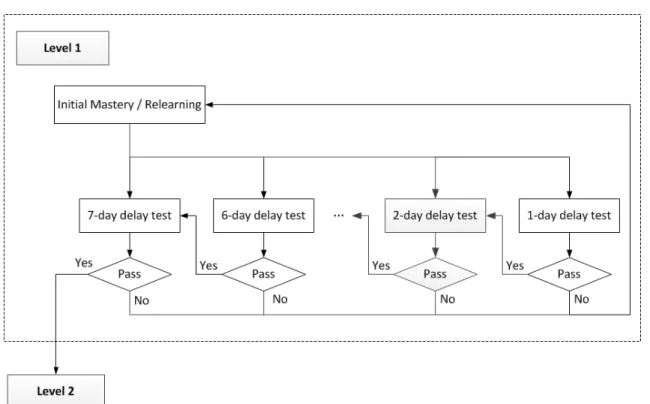
Although ARRS helps students review knowledge after a time period and shows effect on improving students’ long-term performance, it neither knows a students knowledge level, nor does it has any mechanism to change the retention schedule based on a particular students performance. Here we formed a hypothesis that we can improve students long-term retention levels by adaptively assigning students with gradually expanding and spacing intervals over time and we proposed to design and develop such a system, called Personalized Adaptive Scheduling System (PASS), as shown in Figure 2.4. PASS enables ARRS to schedule retention tests for students based on their knowledge levels. In the spring of 2014, we enhanced the traditional ARRS with the PASS and deployed it in ASSISTments.
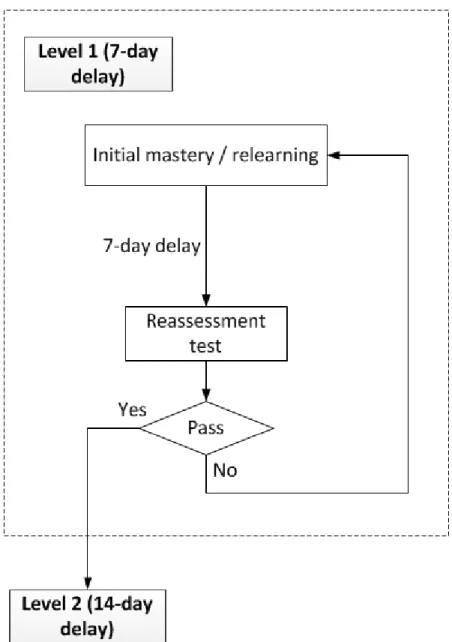
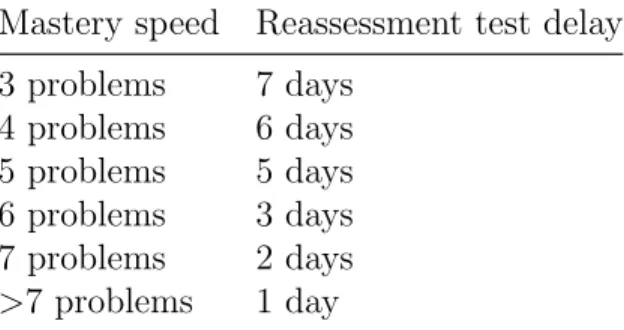
The current workflow of PASS aims to future improve students long-term reten-tion performance by setting up personalized retenreten-tion test schedules based on their knowledge levels. Here we rely on the mastery speed of a skill as an estimate of a students knowledge level and, consequently, predictor of retention performance. We retained the ARRS’ design of 4 expanding intervals of retention tests for each skill; however, PASS alters how the first interval behaves. When a student initially mas-ters a skill, we use his mastery speed to decide when to assign his first reassessment test. The mapping between mastery speed and retention delay intervals of the level 1 test is shown in Table 2.5. When a student passes the first test, PASS will sched-ule another test with a delay of 1 day longer. Once the student passes the 7-day
Figure 2.4: Workflow of Personalized Adaptive Scheduling System (PASS). We rely on mastery speed to decide when to assign a student’s first reassessment test. When a student passes the first test, PASS will schedule another test with a delay of 1 day longer
delay test, he is promoted to level 2 with a delay of 14 days. From that point on the intervals are the same as in the ARRS system. Note that mastery speed can be extracted from both students initial learning and relearning processes. Therefore, when a student fails a retention test, a relearning assignment will be assigned to the student immediately. How quickly the student relearns this assignment will be used to set the interval for his next test. The mechanism of level 2 to level 4 tests is simpler. When a student fails a retention test, the retention delay will be reduced to the previous level (e.g., from 56 days to 28 days). It will be increased to the next level if the student passes the delayed retention test.
Table 2.5: Mapping between mastery speed and level 1 retention delays. We use mastery speed of a skill as an estimate of a student’s knowledge level. Slower mastery speed means assigning reassessment tests with shorter delays
Mastery speed Reassessment test delay
3 problems 7 days 4 problems 6 days 5 problems 5 days 6 problems 3 days 7 problems 2 days >7 problems 1 day
Here is an example of a student working with PASS in ASSISTments. Lets assume he needed 4 attempts to achieve three correct responses in a row in an initial learning assignment, so his mastery speed on this skill was 4. PASS then scheduled the first level 1 retention test for him to complete 6 days after the initial mastery. 6 days later, the student passed the retention test and PASS scheduled a 7-day retention test. Then a week later, the student passed the 7-day retention test and moved to the level 2 retention tests.
2.5.1
The impact of PASS
After the deployment of PASS in ASSISTments, several key issues need to be an-swered in order to realize the potential benefits of personalized expanding retention intervals and scheduling for students. We first conducted a study in ASSISTments to compare the new PASS with the traditional ARRS without PASS. In addition, this study explored the influence of personalized scheduling on students long-term performance, student learning patterns and how they interact with our tutoring system.
The objectives of this study are the following: A central goal was to investigate the long-term retention performance impact of personalized spacing schedules. We enabled PASS for all classes that were using ARRS on May 15, 2014; we expected students in these classes might be assigned homework during the next few months and thereby become the participants in the study. We ended this study on Septem-ber 1, 2014 and found that 2,052 students from 40 classes were using PASS in the summer of 2014 [XWB15]. Teachers of these classes assigned 93 different home-work assignments to their students. Since traditional ARRS had been deployed in ASSISTments for over two years and a lot of data have been accumulated in the system, we extracted previous summers ARRS-enabled classes that used the same assignments as the historical control group. 2,541 students from 57 classes in the summer of 2013 were qualified to act as historical control group. During these two summer periods, students consistently received mathematics problem sets as homework assignments from their teachers. Once they answered three consecutive questions correctly in a problem set, students in the PASS condition would be given reassessment tests based on their mastery speed. If a student answered a reassess-ment test correctly, he was then given another reassessreassess-ment test with a longer delay until he passed the level 1 test with a 7-day delay. On the other hand, students
in traditional ARRS condition got 7-day delay reassessment tests after the mastery and went on with the 14-day tests if they answered the 7-day tests correctly. In this study, we defined how students performed on the 14-day retention tests (14 days after passing the level 1 test and at least 21 days after the initial mastery learn-ing) as the metric of long-term performance. It is important to note that students usually receive several homework assignments and they may perform differently in these assignments, which means a student would have multiple tests that should be accounted for in the long-term performance. However, it is also possible that students do not complete assignments. Specifically, if a student has not finished the outcome retention test of a homework assignment by the end of this study, we cannot take this record into account.
Reassessment test completion rate was calculated based on the number of home-work assignments that had outcome tests answered divided by the total number of homework assignments. Days spent is the time interval between the start time of level 1 reassessment tests and the start time of outcome tests. Test count accounts for how many level 1 retention tests a student has to answer before this student can proceed to outcome tests. Long-term retention performance was calculated as the ratio of number of questions answered correctly in outcome tests to number of all questions answered in outcome tests.
At the end of this study, the first result we noticed was that a lot of homework assignments in both groups did not have the records for associated outcome tests. In other words, a lot of students did not reach the 14-day retention tests. In the tradi-tional ARRS condition, a total of 8404 homework assignments had been assigned to students but only 1,558 (18.5%) of these assignments had 14-days retention tests an-swered. When looking at the PASS condition, the retention test completion rate was even lower, only 1,029 (13.6%) of total 7,589 homework assignments had outcome
tests answered. In one sense these low completion rates could result from the fact these homework and retention tests were assigned to students during the summer vacation so that perhaps many students did not treat these assignments seriously. The data also indicated the difference in the completion rates of the two conditions were statistically significant (p <0.001). We hypothesized that this was due to the fact that students in the PASS condition took more tests in order to pass the 7-day delay tests. Remember, some medium- and low-knowledge students had to pass a number of shorter-delay tests to even reach the 7-day and then 14-day reassessment tests. To address this hypothesis, we investigated how many days were needed to reach the 14-day test from the beginning of level 1 retention tests. The data was grouped by the three identified mastery speed bins to represent high-, medium- and low mastery level students on their homework assignments.
Table 2.6: Average days spent between level 1 and level 2 reassessment tests. The minimum possible days between level 1 and level 2 tests is 14 days, achievable by ARRS students who answered the 7-day test correct, and then take level 2 tests immediately when available. Other students take more tests thus spend more days.
Initial mastery speed ARRS PASS
3 - 4 problems 16.8 19.0
5 - 7 problems 17.7 33.2
>7 problem 17.3 32.3
Table 2.6 describes the differences in average days spent between ARRS and PASS conditions. The minimum possible delay is 14 days, achievable for ARRS students who answer the 7-day test correctly, and then take their ARRS tests when it is immediately available. Students who fail the first ARRS tests would have to take one or more additional 7-day tests until they respond correctly and could be promoted to the 14-day test. For the PASS condition, 14 days is a lower bound only for those students with an initial mastery speed of 3, as slower mastery speeds would
require multiple first-level tests before being promoted to the 14-day interval. As expected, students in the PASS condition spent more time in the practices of level 1 retention tests; especially for medium- and low-knowledge students who spent nearly two more weeks in the process of passing the 7-day delay tests relative to ARRS students. Table 2.7 demonstrates that students in the PASS condition had more tests to answer by showing the average test count of the two conditions therefore it took them more days to reach 14-day tests.
Table 2.7: Average test counts between level 1 and level 2 reassessment tests. The table shows student in PASS condition had more tests to answer.
Initial mastery speed ARRS PASS
3 - 4 problems 1.3 1.2
5 - 7 problems 1.4 3.3
>7 problem 1.6 3.7
After found out that PASS made students take more practices in the retention tests, we became more curious about the impact of PASS on long-term retention performance. It is important to emphasize that students were balanced with respect to proficiency in the ARRS and PASS conditions given their close homework perfor-mance level: 71.0% correct versus 71.2%. An initial analysis on long-term retention performance across all students showed the PASS condition (83.4%) outperformed the ARRS condition (77.2%) with a reliable but small improvement (p<0.01, effect size = 0.15). When considering the performance changes in different knowledge level of students, we again grouped the data by three identified mastery speed bins; then we examined students long-term retention performance with p-values and effect sizes in Table 2.8.
The comparison of long-term retention performance shows that all three groups of students in the PASS condition outperformed those in the ARRS condition, al-though the improvements were not all statistically significant; only students with
medium mastery level performed reliably better with an effect size of 0.27. For students with high mastery level, the benefit of using PASS was limited; this sug-gests that solely relying on 7-day delay tests is sufficient for this population. Our previous study in 2.3 also suggested that high-knowledge students have high resis-tance against forgetting. On the other hand, providing low mastery level students with more spaced retention tests and relearning assignments did not stop the decay of knowledge even after these students had approximately 3 additional relearning assignments on the same skill, and we only noticed a small effect size (0.12) im-provement on the retention performance. Because PASS employs a higher stand of mastery and retention, thus few low knowledge students reached outcome tests; we in fact noticed that only 51 tests had been completed, so this also prevented us from achieving a higher effect size in PASS condition. Another notable result was when we compared Table 2.8 vertically: we could see that PASS helped to close the performance gap between different groups of students. In fact, in the PASS condi-tion, the long-term performance of medium-knowledge students even outperformed the high-knowledge students. Of course, the small sample size suggests us we need more data to validate this result.
Table 2.8: Long-term retention performance comparison and sample size (in paren-thesis). PASS improved retention performance across all groups of students. How-ever, only students with medium mastery level had reliable improvement with an effect size of 0.27 in PASS condition.
Initial mastery speed ARRS PASS p-value Effect size
3-4 problems 81.8% (978) 84.0% (889) 0.2266 0.06
5-7 problems 73.1% (327) 84.5% (97) 0.0209 0.27
>7 problems 64.8% (253) 70.6% (51) 0.4301 0.12
The work of PASS makes three contributions. First, the work behind this project helped to design and deploy a personalized expanding interval scheduling system that utilizes spacing effect in the field. Through the participation of thousands
Figure 2.5: Post test performance comparison of ARRS vs PASS. All groups of students in PASS condition have high test performance. Students in medium level performance have the largest learning gain (d = 0.27).
of students, we carried out a study to test the idea of assigning students with different delays of retention tests to help them better retain skills. As the first study on this system, PASS system explores the path of improving ITSs to help students achieve robust learning via personalized expanding retrieval practices. The second contribution of PASS is a validation of the hypothesis that students long-term performance can be improved by giving them tests that are well spaced out and scheduled appropriately, before gradually expanding the spacing between these tests. Most importantly, our study demonstrates the importance of individualization in scheduling retention tests, as it shows that students with medium mastery level can match up their long-term performance with high mastery level students by using PASS. The third contribution of PASS is the confirmation of concept of finding the optimal retention interval by using mastery speed as a measurement of students knowledge level. By using mastery speed to group students, we can distinguish different learning and retention patterns among students with different knowledge
levels. In the process of work, we have noticed that there has been other work on retention, such as the personalized spaced review system [LSPM14]; however, this work focuses on fact retrieval and is able to make far stronger assumptions of when students are exposed to content. Our work examines a procedural skill, in a classroom context where we cannot be sure what material teachers cover in class and we are not aware of all homework assignments, thus we cannot be sure when students last saw a skill.
PASS project have been introduced to the field for just a few months, so we are still at the initial phase of study. Our goal is to find the optimal spacing schedules for students and the best way to boost their performance in long-term mathematics learning. There are many further problems that we are interested in: What should we do to help low mastery level students, considering the improvement we saw in the study was inconclusive, particularly given the increased amount of practices they received? From the data we collected, it was obvious that there were some areas that can be improved. For example, we simulated a scenario to improve the retention performance of low mastery level students to match up to the performance level of high-knowledge students (84.0%) and also improve completion rates to the level of ARRS condition so we could collect 228 data points. Given these optimistic assumptions, there intervention would have an effect size of 0.45.
2.6
ASSISTments Workflow: building assistment
relationships for the next generation
ASSIST-ments
2.6.1
Introduction
The current generate ASSISTments platform has been developed for the past ten
years 1. As a web-based application, the core component of ASSISTments platform
is a web server written in Ruby on Rails, a web framework uses the modelviewcon-troller (MVC) pattern to organize sub-applications. Although ASSISTments plat-form has been actively updated and maintained to extend functionalities and fix program errors, however, some issues of it have become huge obstacles, preventing ASSISTments adopting new technologies, more importantly, making ASSISTments can no longer work with users as well as developers effectively. The most concerning issue of them all is the fact that the software infrastructure of ASSISTments is widely out of date. For example, ASSISTments is still using Ruby 1.86, which was released in 2007, and along with other a decade-ago software packages. Another growing pain of current ASSISTments is a phenomenon known as the ”software rot”. Due to lack of effective supervising and auditing mechanisms in ASSISTments’ software development life cycle, a huge part of ASSISTments code base has become obscure, redundant, faulty. Because of software rot, making any change to current system is extremely time consuming and error-prone.
Fortunately, developers of ASSISTments team are fully aware of these issues, and are making effort to ensure we can learn from these problems. In fact, the de-velopment of the next generation of ASSISTments (TNG) has already being carried
Figure 2.6: Next generation ASSISTments’ model structure. This design separates different responsibilities into separate layers of modules so that each layer encapsu-lates a single part of the functionality provided by the whole system.
out. TNG is powered by Java and Spring Framework, and uses completely different development paradigm from current Ruby platform. It separates different responsi-bilities into separate layers of modules so that each layer encapsulates a single part of the functionality provided by the whole system. The design details of TNG is beyond the scope of this work, but a simple illustration of ASSISTments TNG’s model structure is shown is the following diagram 2.
As an important part of ASSISTments, it is crucial to include Automatic Re-assessment and Relearning System (ARRS) in the TNG development. During the discussions of developing ARRS for TNG, we believe it is possible to develop a set of API not only meets the requirements of ARRS but also can be generalized to serve as the backbone of some other components of ASSISTments, components that involves the idea of guiding students through a