i
THESIS FOR THE DEGREE OF DOCTOR OF PHILOSOPHY
Applied Bioinformatics in
Saccharomyces cerevisiae
Data storage, integration and analysis
Kwanjeera Wanichthanarak
Department of Chemical and Biological Engineering
CHALMERS UNIVERSITY OF TECHNOLOGY
Gothenburg, Sweden 2014
ii
Applied Bioinformatics in Saccharomyces cerevisiae
Data storage, integration and analysis KWANJEERA WANICHTHANARAK ISBN 978-91-7597-032-5
© KWANJEERA WANICHTHANARAK, 2014.
Doktorsavhandlingar vid Chalmers tekniska högskola Ny series nr 3731
ISSN 0346-718X
Department of Chemical and Biological Engineering Chalmers University of Technology
SE-41296 Gothenburg Sweden
Telephone +46 (0)31 7721000
Cover: Yeast databases and data analysis Back cover: Taken by K. Kusonmano
Printed by Chalmers Reproservice Gothenburg, Sweden 2014
iii
Applied Bioinformatics in
Saccharomyces cerevisiae
Data storage, integration and analysis
Kwanjeera Wanichthanarak
Systems and Synthetic Biology, Department of Chemical and Biological Engineering, Chalmers University of Technology
Abstract
The massive amount of biological data has had a significant effect on the field of bioinformatics. This growth of data has not only lead to the growing number of biological databases but has also imposed the needs for additional and more sophisticated computational techniques to proficiently manage, store and retrieve these data, as well as to competently help gaining biological insights and contribute to novel discoveries.
This thesis presents results from applying several bioinformatics approaches on yeast datasets. Three yeast databases were developed using different technologies. Each database emphasizes on a specific aspect. yApoptosis collects and structurally organizes vital information specifically for yeast cell death pathway, apoptosis. It includes predicted protein complexes and clustered motifs from the incorporation of apoptosis genes and interaction data. yStreX highlights exploitation of transcriptome data generated by studies of stress responses and ageing in yeast. It contains a compilation of results from gene expression analyses in different contexts making it an integrated resource to facilitate data query and data comparison between different experiments. A yeast data repository is a centralized database encompassing with multiple kinds of yeast data. The database is applied on a dedicated database system that was developed addressing data integration issue in managing heterogeneous datasets. Data analysis was performed in parallel using several methods and software packages such as Limma, Piano and metaMA. Particularly the gene expressions of chronologically ageing yeast were analyzed in the integrative fashion to gain a more thorough picture of the condition such as gene expression patterns, biological processes, transcriptional regulations, metabolic pathways and interactions of active components. This study demonstrates extensive applications of bioinformatics in the domains of data storage, data sharing, data integration and data analysis on various data from yeast S.cerevisiae in order to gain biological insights. Numerous methodologies and technologies were selectively applied in different contexts depended upon characteristics of the data and the goal of the specific biological question.
Keywords: Bioinformatics, database design, database system, gene expression analysis,
iv
List of publications
The thesis is based on the work in the following publications:
I. Wanichthanarak K., Cvijovic M., Molt A. and Petranovic D. (2013). yApoptosis: yeast
apoptosis database. Database (Oxford), 2013, bat068.
II. Wanichthanarak K., Nookeaw I. and Petranovic D. (2014). yStreX: Yeast Stress
Expression Database. Database (Oxford). (Resubmitted after revision)
III. Pornputtapong N.*, Wanichthanarak K.*, Nilsson A., Nookeaw I. and Nielsen J. (2014). A dedicated database management system for handling multi-level data in systems biology. Source Code for Biology and Medicine. (Submitted)
IV. Wanichthanarak K., Wongtosrad N. and Petranovic D. (2014). Genome-wide
expression analyses of the stationary phase model of ageing in yeast. Mechanisms of Ageing and Development (Submitted)
Additional publication not included in this thesis:
V. Munoz A.J.*, Wanichthanarak K.*, Meza E.* and Petranovic D. (2012). Systems biology of yeast cell death. FEMS Yeast Research, 12(2):249-65.
v
Contributions
I. Designed and developed the database. Curated data and performed network analysis. Drafted and edited the manuscript.
II. Designed and developed the database. Curated data and performed transcriptome and integrative analysis. Drafted and edited the manuscript.
III. Participated in designing the database system and coding the parser class. Supervised the development of the database and data population, and implemented case studies. Took part in writing and editing the manuscript.
IV. Performed transcriptome and integrative analysis. Supervised the work in time-series analysis. Drafted and edited the manuscript.
Additional publication not included in this thesis:
vi
Abbreviations
AIF Apoptosis-inducing factor
AMID Apoptosis-inducing factor-homologous mitochondrion-associated inducer of death AP-MS Affinity purification mass spectrometry
BioPAX Biological Pathway Exchange BP Biological process
ChIP Chromatin immunoprecipitation CLS Chronological lifespan
CVT Cytoplasm to vacuole targeting DEA Differential expression analysis DNA Deoxyribonucleic acid
EF Experimental factor
ESR Environmental stress response GEO Gene Expression Omnibus
GO Gene ontology
GSA Gene set analysis H2O2 Hydrogen peroxide JSON JavaScript object notation
KEGG Kyoto Encyclopedia of Genes and Genomes MAPK Mitogen-activated protein kinase
NCBI National Center for Biotechnology Information PCD Programmed cell death
PDI Protein-DNA interaction PDS Post-diauxic shift PKA Protein kinase A
PPI Protein-protein interaction
PSI-MI Proteomics standards initiative molecular interaction RLS Replicative lifespan
RNA Ribonucleic acid ROS Reactive oxygen species
S.cerevisiae Saccharomyces cerevisiae
SBML Systems biology markup language SD Synthetic complete medium SQL Standard query language STRE Stress response element TCA Tricarboxylic acid cycle TF Transcription factor TOR Target of rapamycin Y2H Yeast two-hybrid
vii
List of figures and tables
Figure 1 Components and pathways of yeast apoptosis ...5
Figure 2 Ageing paradigms in yeast ...6
Figure 3 Stress-response and lifespan regulatory pathways ...7
Figure 4 Bioinformatics and systems biology ...10
Figure 5 Architecture of centralized and federated databases ...12
Figure 6 Networks of apoptosis genes ...19
Figure 7 Networks of yeast PCD ...22
Figure 8 Overview of visitors to yApoptosis ...22
Figure 9 Analysis workflow...23
Figure 10 Screenshot of navigations between different web pages ...25
Figure 11 Part of the consensus heatmap of TF gene sets ...26
Figure 12 Yeast data repository architecture ...30
Figure 13 Resulting queries from a yeast data repository...31
Figure 14 Venn diagram of significant genes and enriched functional terms ...33
Figure 15 Heatmap of enriched metabolic pathways from GSA ...35
Figure 16 Consensus network of all identified active subnetworks ...38
Table 1 List of software packages and resources for gene expression analysis ...13
Table 2 Yeast apotosis genes and human orthologues ...21
Table 3 List of yeast data in the yeast data repository and resources ...29
viii
Table of contents
1. Introduction ...1
1.1 Thesis structure ...2
2. Background ...3
2.1 Yeast Saccharomyces cerevisiae ...3
2.1.1 Yeast apoptosis ...3
2.1.2 Yeast ageing ...5
2.1.3 Yeast stress responses ...8
2.2 Bioinformatics and systems biology ...9
2.3 Biological database design and development ...10
2.4 Gene expression analysis ...12
2.5 Biological networks ...14
3. Results and discussion ...16
3.1 Design and development of yeast databases ...16
3.1.1 Paper I: Yeast apoptosis database ...16
3.1.2 Paper II: Yeast stress expression database ...23
3.1.3 Paper III: Yeast data repository ...28
3.2 Bioinformatics applications in transcriptome analysis ...32
3.2.1 Paper IV: Genome-wide expression analyses of the stationary phase model of ageing in yeast ...32
4. Conclusions and perspectives ...39
Acknowledgements ...41
ix
Preface
This thesis is submitted for the partial fulfillment of the degree doctor of philosophy. It is based on work carried out between 2010 and 2014 at the Department of Chemical and Biological Engineering, Chalmers University of Technology, under the supervision of Assoc. Prof. Dina Petranovic. The research was funded by the Knut and Alice Wallenberg Foundation, the European Research Council and the Chalmers Foundation.
Kwanjeera Wanichthanarak May 2014
1
1. Introduction
Saccharomyces cerevisiae or the baker’s yeast is one of the famous model organisms and it has been extensively used in molecular biology, biotechnology and for study of processes related to human health and disease (Petranovic and Nielsen, 2008). The operating principles of fundamental cellular mechanisms, such as DNA replication, DNA recombination, cell division, protein homeostasis and vesicular trafficking, are well conserved among yeast and higher eukaryotes (Fields and Johnston, 2005; Winderickx, et al., 2008). Indeed, it was reported that yeast genes have mammalian homologues, for instance, RAS1 and RAS2 are homologues of the mammalian RAS proto-oncogenes (Botstein, et al., 1997). Conducting studies with yeast (either by classical complementation assays for human proteins that have a yeast homologue or by humanized yeast systems for human proteins that do not have a yeast counterpart) have contributed to reveal the functional roles or the biological consequences of mutations of human proteins (Botstein and Fink, 2011; Winderickx, et al., 2008). Nowadays yeast has relatively comprehensive sets of omics data such as genome, transcriptome, interactome and metabolome. These data facilitate research in the field of systems biology that observes more than individual genes and proteins but considers how these molecules interact and work together to establish the properties of living cells.
After the development of high-throughput DNA sequencing technologies, bioinformatics became an essential discipline to extract information in genome sequences (Barnes, 2007). The term informatics has been described by Altman (2012) that “it is the study of how to represent, store, search, retrieve and analyze information (Altman, 2012)”. The biological data can be the information stored in the DNA sequences, RNA expression, three-dimensional protein structures, protein interactions, clinical data, and published literature. Bioinformatics thus involves beyond the alignment of DNA sequences. It is an area of science that uses various methodologies and computational technologies to structurally store biological information, to answer biological enquiries, to have new biological findings and to guide experimental design. Bioinformatics databases and software tools become indispensable parts of life sciences research these days. The main objective of this thesis is to apply key domains of bioinformatics including database development and data analysis on data generated by studying yeast, particularly yeast cell death, ageing and stress pathways. The main intention of yApoptosis (Paper I) is to show how building a dedicated database which stores and collects specific molecular and cell biology information (focus on a specific pathway) and that it can easily be accessed, searched and shared, contributes to the development of this particular field of research. Given the growing amount of transcriptome data, and the facing challenge of efficiently utilizing such data, we developed the
2
yStreX database with integrated analyses (Paper II) where readily-processed data and analyses are collected and can be rapidly retrieved. This database was developed to facilitate exploitation of transcriptome data in the area of yeast stress responses.
To understand biological processes, systems biology research imposes integration of biological data from different levels. This issue puts challenges in data integration areas including establishing data standards and implementing computational tools and infrastructures. An effort is presented in this study by designing a database system and applying this system to build a yeast data repository containing multiple types of biological data (Paper III).
Data analysis was a key step performed throughout this PhD study for generating data to be stored in the databases and for studying a specific process (i.e. yeast ageing in Paper IV) using several software packages e.g. Limma package (Smyth, 2004) to identify differentially expressed genes compared to control. The integrated analysis was conducted by using biological networks such as metabolic pathways, transcriptional regulatory interactions and networks of biological processes as a scaffold for incorporating transcriptome data which results in a reduced dimension and a systemic view of the data to aid biological interpretation. Besides, integrating transcriptome and interactome data contributed to identification of functional modules which illustrates how molecules interact together under the ageing condition.
1.1 Thesis structure
The thesis contains two main parts. The first part is divided into four chapters containing extended descriptions of the work and related information. Chapter 1 gives the short introduction and the objective of the work in this thesis. Chapter 2 provides background of the topics related to the work in this thesis. In Chapter 3, the brief summaries of background and results from all papers are presented. This chapter is divided into two sections on database design and development, and data analysis. Chapter 4 concludes key aspects and perspectives of all the work. The second part is the collection of the research articles with the order following the sections in Chapter 3.
3
2. Background
2.1 Yeast
Saccharomyces cerevisiae
The budding yeast Saccharomyces cerevisiae is a unicellular organism that has been recognized as a favorite model organism for eukaryotes. It was the first eukaryotic organism that had entire genome completely sequenced and yeast genome has proved to be a useful reference for the sequences of human and other higher eukaryotic genes (Goffeau, et al., 1996; Schneiter, 2004). The Saccharomyces Genome Database (SGD) is the main resource for the budding yeast (Cherry, et al., 2012). It contains piles of information about yeast genome, proteins and other related features.
Yeast has been used for both molecular research and industrial applications as there are several dominant features including ease of cultivation, well-studied organism, well-established molecular biology toolboxes and a bunch of molecular datasets generated from high-throughput technologies (Petranovic and Nielsen, 2008). Interestingly, about 40% of genes of human heritable disease have homologues in yeast (Oliver, 2002). This shows that yeast has a potential to be used in pharmaceutical and medical applications including as a platform for protein productions and as a toolbox for revealing biological insights of molecular mechanisms (Hou, et al., 2012; Munoz, et al., 2012). Examples of research on complex biological processes conducted in yeast include programmed cell death (PCD) and ageing (Carmona-Gutierrez, et al., 2010; Longo and Fabrizio, 2012). In addition, yeast genome-wide data serve as valuable resources for further research and applications in bioinformatics and systems biology.
2.1.1 Yeast apoptosis
Apoptosis is one form of PCD that was also reported in yeast. Yeast cells undergoing apoptosis show typical apoptotic features e.g. phosphatidylserine externalization, cytochrome c release, depolarization of mitochondrial membrane potential, chromatin condensation and DNA fragmentation (Madeo, et al., 2009).
To ensure proper development and maintain homeostasis, apoptosis in higher eukaryotes occurs under certain circumstances such as during cell differentiation, response to infection, removal of damaged cells, ageing and response to different stresses (Sharon, et al., 2009). In a unicellular organism like yeast, the purpose of apoptosis is comparable to metazoan as it arises during ageing, mating and stress-inducing to eliminate damaged or old cells, thereby promoting survival of major population (Carmona-Gutierrez, et al., 2010).
4
Generally speaking, yeast apoptosis pathways include dependent and caspase-independent pathway (Madeo, et al., 2009). The first pathway involves induction of yeast metacaspase by various stimuli such as H2O2, acetic acid, hyperosmotic stress, ageing and other
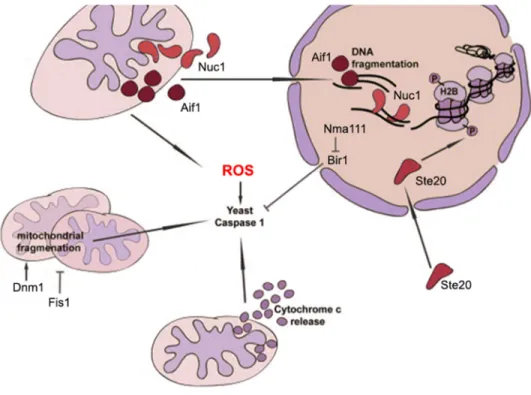
agents. The gene YCA1 encodes a metacaspase which specifically catalyzes protein substrates and in turn triggers apoptosis (Mazzoni and Falcone, 2008). For caspase-independent process, the apoptosis-inducing factor 1 (AIF1) was one of implicated players (Madeo, et al., 2009). It translocates from mitochondria to the nucleus upon apoptotic stimulus and causes chromatin condensation and DNA fragmentation. The other players in caspase-independent pathways include NUC1, NMA111 and STE20. NUC1 is a yeast orthologue of mammalian endonuclease G (EndoG) and Nuc1 was found translocating to the nucleus from mitochondria upon apoptosis induction (Buttner, et al., 2007). Nma111 (nuclear mediator of apoptosis) localizes in the nucleus and Bir1, an inhibitor-of-apoptosis protein in yeast, is a substrate of its serine protease (Fahrenkrog, et al., 2004). Ste20 phosphorylates histone H2B at serine 10 causing chromatin condensation (Ahn, et al., 2005). It is also a part of pheromone-induced apoptosis resulting from an enhancement of mitochondrial respiration and cytochrome c release (Carmona-Gutierrez, et al., 2010; Pozniakovsky, et al., 2005).
Mitochondria are an organelle that has been considered to play an important role in ageing and apoptosis. For instance, release of cytochrome c from mitochondria after acetic acid treatment was found to induce apoptosis in yeast (Ludovico, et al., 2002), though, it is still skeptical how cytochrome c leads to caspase activation and apoptosis (Carmona-Gutierrez, et al., 2010). It is widely known that mitochondria are a main source of reactive oxygen species (ROS) in cells. These ROS arise as the products of cellular metabolism during aerobic respiration (Farrugia and Balzan, 2012). They have deleterious effects to a wide variety of molecules, such as nucleic acids, proteins and lipids. Changing mitochondrial morphology can also affect ROS production. It was demonstrated that inhibition of mitochondrial fission by deleting Dnm1 extends lifespan, and increases stress tolerance (Braun and Westermann, 2011; Cheng, et al., 2008; Perrone, et al., 2008). Mitochondrial fragmentation together with mitochondrial dysfunction and accumulation of ROS are general hallmarks of cell death (Braun and Westermann, 2011).
In brief, apoptosis can be induced by various stimuli both externally and internally. It involves several genes, proteins, cellular mechanisms and organelles such as mitochondria and nucleus as depicted in Figure 1. Besides, homologues of mammalian were found in yeast, such as a yeast caspase (Yca1), nuclear mediator of apoptosis (Nma111), endonuclease G homologue (Nuc1), apoptosis-inducing factor (Aif1) and yeast AMID (Ndi1) (Frohlich, et al., 2007; Madeo, et al.,
5 2009), which make yeast a promising research tool for elucidating cell death pathways in human and other higher eukaryotes.
Nowadays, research in yeast PCDs yeast still undergoes. It is not only about apoptosis but also covers other PCDs including autophagy and necrosis, and ageing processes. It remains several challenges to understand, for instance, how cells switch between those different PCD subroutines or how cells decide to live or die.
Figure 1 Components and pathways of yeast apoptosis. Upon apoptosis induction, it leads to activation of several apoptotic key players such as the yeast caspase Yca1. Apoptosis also engages other processes including mitochondrial fragmentation, cytochrome c release, DNA fragmentation and histone modification. Figure adapted from (Madeo, et al., 2009).
2.1.2 Yeast ageing
In general ageing is a process associated with progressive decline in the competence to compete against cellular stress and damage (Sharon, et al., 2009). It is also an endogenous stimulus of apoptosis. There are two ageing paradigms described in yeast: replicative lifespan (RLS) and chronological lifespan (CLS) (Figure 2). RLS is measured by the number of replications a mother cell produces before dying while CLS is the survival time of non-dividing populations in long-term cultivation (Longo and Fabrizio, 2012).
6
In both types, yeast cells die exhibiting markers of apoptosis such as accumulating oxygen radicals and caspase activation (Sharon, et al., 2009). Similar to cell death, yeast has been widely used as a model to study ageing processes. The yeast replicative ageing is a potential model for the ageing process of proliferating cells such as human stem cell, whereas chronological ageing serves as a model for the ageing of post-mitotic cell types such as brain and muscle (Rockenfeller and Madeo, 2008). In this thesis, CLS is the main focus.
Figure 2 Ageing paradigms in yeast. Two ageing paradigms have been described in yeast including replicative (top panel) and chronological lifespan (bottom panel).
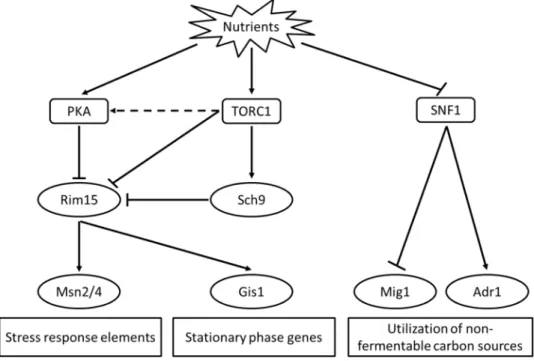
Unlike RLS, CLS is directly influenced by the availability of nutrients. Lacking of nutrients causes cells to enter diauxic shift and stationary phase showing several physiological changes such as low transcription rate, reduced metabolism, low protein synthesis, thick cell walls and non-budding. Yeast cell also accumulates storage molecules such as glycogen, triacylglycerol, polyphosphate and trehalose (Galdieri, et al., 2010). Signal transduction pathways that regulate longevity and stress responses were identified and were found evolutionally conserved. They are target of rapamycin (TOR), protein kinase A (PKA) and Snf1 pathway (Fabrizio and Longo, 2003; Galdieri, et al., 2010) (Figure 3).
These signaling pathways control transcriptions of downstream genes through different transcription factors (TF). In particular, during exponential phase, TOR and PKA pathway negatively regulate Rim15 protein kinase which in turn positively controls stress response TFs
7 such as Msn2, Msn4 and Gis1 (Wei, et al., 2008). In contrast, under calorie restriction genes containing the stress response element (STRE) (e.g. CTT1, DDR1, HSP12 and TPS2) or post-diauxic shift motif (PDS) (e.g. SSA3 and GRE1) in their promoters are transcriptionally induced by those TFs respectively as a result of deficiency in the signaling pathways (Orzechowski Westholm, et al., 2012; Pedruzzi, et al., 2000; Wei, et al., 2008). Snf1 is a protein kinase that inactive in the presence of glucose. Its target includes Adr1 (that activates transcription of genes implicated with utilization of non-fermentable carbon sources), and Mig1 (that represses transcription of genes in the presence of glucose) (Galdieri, et al., 2010).Under carbon stress, it was also found to regulate TFs Msn2 and Hsf1 (Hahn and Thiele, 2004).
Figure 3 Stress-response and lifespan regulatory pathways. Stress responses and lifespan are regulated by signaling pathways (represented by rounded rectangular) including TOR, PKA and SNF1 pathway. Downstream components of the signal transduction pathways (represented by oval) further control genes involving in important processes such as stress responses, stationary growth and catabolism of non-fermentable carbon sources (represented by square). Figure adapted from (Galdieri, et al., 2010).
To summarize, longevity is determined by the capability to endure various stresses e.g. oxidative stress and genomic instability. It involves several lifespan regulatory pathways that control downstream players to exhibit, for instance, metabolic switches, anti-oxidant activities and other cellular protection processes to prolong the lifespan (Longo and Fabrizio, 2012).
8
2.1.3 Yeast stress responses
Changes in environmental systems can disturb internal homeostasis of cells which then might result in cellular malfunctions, no growth or death. Thus, living organisms have to adapt rapidly in order to survive under the new environment.
Yeast develops stress-response strategies by remodeling of its gene expression program to deal with fluctuations in, for example, pH, temperature, nutrient condition, osmotic pressure, oxygen level, drugs and toxic compounds (Gasch, et al., 2000). The reprogramming of gene expression can be captured by DNA microarrays as demonstrated in (Causton, et al., 2001; Gasch, et al., 2000; Knijnenburg, et al., 2009). These genomic studies allow us to gain insights into the regulation of responses to stressful conditions.
In most studies, yeast responds to environmental shifts through changes in genomic expression of thousands genes (Gasch and Werner-Washburne, 2002). Among those, around 900 genes changes commonly in diverse environments and they are denoted as the environmental stress response (ESR) genes. There are approximately 300 genes induced in several stresses and these genes are in carbohydrate metabolism (e.g. FBP26, TPS1,2,3 and GSY2), in protein folding (e.g. HSP26,42,78 and SSA3), in protein degradation (e.g. UBC5,8 and UBI4) and in oxidative stress response (e.g. CTT1 and SOD1) (Causton, et al., 2001; Gasch, et al., 2000; Gasch and Werner-Washburne, 2002). Most of these ESR genes contain STRE motif (AGGGG) in their promoters targeted by Msn2 and Msn4, which may be considered as general stress transcription factors. However, genes in the ESR are regulated by different TFs which are condition-specific, e.g. Yap1 and Hsf1 regulate ESR genes in response to oxidative stress or heat shock, respectively (Gasch, et al., 2000; Gasch and Werner-Washburne, 2002). Furthermore, around 600 common-repressed genes involve in RNA metabolism, ribosomal proteins and protein synthesis indicating that cells try to reserve energy during their adaptation to new conditions (Causton, et al., 2001; Gasch and Werner-Washburne, 2002).
The expression of ESR genes has been reported to be mediated by a number of signaling pathways which are activated by specific upstream signals, such as MAPK HOG pathway is active in response to osmotic stress. In contrast, pathways like PKA and TOR as shown in Figure 3 have been implicated to repress ESR genes. The capability of the cell to withstand and response appropriately is certainly vital and required to determine its cellular lifespan.
9
2.2 Bioinformatics and systems biology
Nowadays bioinformatics becomes a major part of most life sciences research (Marcus, 2008). Bioinformatics is a highly interdisciplinary field that drives knowledge discovery from biological data using computational-based analysis. It applies concepts and methods from many areas such as mathematics, statistics, genetics, computer science, physics, chemistry, medicine and biology to dig into information embedded in various biological data including data from high-throughput technologies, 3D protein structures, clinical data and scientific literature (Marcus, 2008).
The main aims of bioinformatics can be described in three areas: 1) to facilitate data management, access and sharing by structurally collecting biological data and existing information in the form of databases, such as GenBank DNA sequence database (Benson, et al., 2013), ArrayExpress functional genomics database (Rustici, et al., 2013) and BioGRID interaction database (Stark, et al., 2011), 2) to develop algorithms and tools for solving biological questions, for example a reporter feature algorithm for identifying enriched biological features of a gene list (Oliveira, et al., 2008), Cytoscape for visualization of interaction networks (Shannon, et al., 2003) and metaMA for meta-analysis (Marot, et al., 2009), and 3) to apply tools and methods for extracting useful knowledge from the data, for instance genome annotations, pathway reconstruction and genome-wide expression analysis (Luscombe, et al., 2001). In this thesis, my work focuses on two roles of bioinformatics including database development and data analysis.
Availabilities of high-throughput experiments these days have leaded us to consider cells as systems where systems properties ascend from the whole rather than individual parts (Palsson, 2006). Systems biology can be considered as an approach to understand biological systems that underlie with networks of interacting components (Munoz, et al., 2012). It also brings together biologists, mathematicians, computer scientists, engineers and physicists to explore complex biological systems.
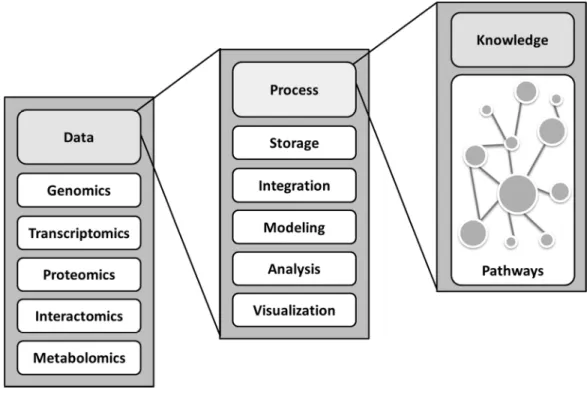
The main objective of systems biology is to obtain a quantitative representation of the system of interest which can be in the form of a mathematical model. This model is used in behavior prediction under different conditions or it is used as a scaffold for integrative analyses (Kohl, et al., 2010; Munoz, et al., 2012). The model may then be improved in an iterative fashion. To achieve these, it involves the exploitation of biological datasets including those generated from high-throughput technologies (metabolomics, transcriptomics and interatomics) and the uses of computation approaches to integrate these products for the model reconstruction and for further analyses (Figure 4).
10
Figure 4 Bioinformatics and systems biology. Bioinformatics and systems biology are closely related with the ultimate goal to gain insights into biological systems. Systems biology studies biological systems as the integration of interacting components e.g. genes, proteins, metabolites and reactions. To integrate and analyze varied data from multiple sources, computational frameworks are required. This is where bioinformatics comes into play.
2.3 Biological database design and development
In the era of high-throughput technologies, we have seen an explosion of biological data in both the amount of data and types of data. Efficient computational infrastructure such as database system and web application for managing such data is unsurprisingly required (Berger, et al., 2013). There are a large number of public biological resources available these days and the development of such repositories continually grows.
Biological databases contain information from life sciences research ranging from raw high-throughput data to results from various analyses. Such databases can be classified in to different categories as listed in Nucleic Acids Research online Molecular Biology Database Collection (Fernandez-Suarez, et al., 2014), for instance nucleic acid sequence and structure databases (e.g. GenBank), protein sequence and structure databases (e.g. UniProt (Apweiler, et al., 2004)), metabolic and signaling pathways databases (e.g. KEGG, http://www.genome.jp/kegg/), organism-specific databases (e.g. SGD), and microarray and gene expression databases (e.g.
11 ArrayExpress). These databases are important resources for systems biology research to obtain biological insights. Proficient data management, storing and retrieving are important matters for progressing data integration and analyses (Berger, et al., 2013), however building a biological database is not a trivial task.
Biological data are complex (e.g. hierarchical structures of gene ontology), heterogeneous (i.e. composing of different types) and highly dynamic (e.g. data updates and new discoveries) (Ozsoyoglu, et al., 2006). These characteristics pose challenges in choosing existing technologies and designing database schema. In several biological databases, relational databases are used since a standard query language (SQL) is very well known and well standardized (Stein, 2013). The relational database, however, requires a predefined schema. Changing data contents might need revision of the database schema. Besides, complex and heterogeneous data result in a sophisticated schema which reduces query performance afterword. Recently NoSQL databases (e.g. document-oriented databases, graph databases and object-oriented databases) have emerged particularly for big data applications, heterogeneous data contents and data structures with complex relationships (Stein, 2013). Though such next generation databases are not much used in current biological databases (i.e. Cellular Phenotype Database (http://www.ebi.ac.uk/fg/sym) is only one example found), they become promising technologies for handling the massive amount of next generation sequencing data in this era.
Because high-throughput data are important for systems research to gain meaningful information. Different strategies, databases and software applications have been designed and developed toward facilitating integration of those data from various sources. Gene ontology (GO) (Ashburner, et al., 2000), Biological Pathway Exchange (BioPAX) (Demir, et al., 2010), Proteomics standards initiative molecular interaction XML format (PSI-MI) (Kerrien, et al., 2007) and Systems Biology Markup Language (SBML) (Hucka, et al., 2003) are examples of standards for representation and exchanges of biological information in which ontologies are for controlling a vocabulary of terms (Ashburner, et al., 2000) and the rest are for pathway data exchanges (Stromback and Lambrix, 2005).
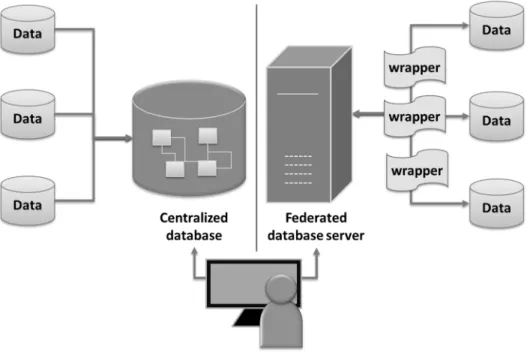
The models used to integrate data in several databases and web applications include centralized and distributed model (Sreenivasaiah and Kim do, 2010). The former model has a unified schema and transfers data from diverse resources into one central repository, whereas the later has central interface to automate access across resources without data transfer. The centralized model is widely used in data warehouse (e.g. BioWarehouse (Lee, et al., 2006), cPath (Cerami, et al., 2006) and Pathway Commons (Cerami, et al., 2011)) because of its key advantages including performance and data consistency. However, its major problems are an issue on data update and
12
database expansion. Federated databases such as BioMart (Kasprzyk, 2011) apply the distributed model which resolve mentioned issues, instead they are limited by query speed over internet and facing interoperability of exchange protocol among data sources (Lee, et al., 2006; Sreenivasaiah and Kim do, 2010). Figure 5 illustrates the architecture of centralized and federated databases.
Figure 5 Architecture of centralized and federated databases. Figureon the left is the architecture of centralized system where data are transferred to store in one central repository. Figure on the right is the federated system that contains uniform interface for accessing data at remote sources.
2.4 Gene expression analysis
According to the central dogma of molecular biology, gene expression is the process when DNA sequence is transcribed into a gene product or RNA. Microarray and recently RNA sequencing (RNA-seq) are extensively used to measure gene expression levels which have been applied in several contexts including investigating gene functions, revealing regulatory patterns, studying co-expression and identifying putative markers.
Transcriptome data are accessible in several public databases such as ArrayExpress (Rustici, et al., 2013) and Gene Expression Omnibus (GEO) (Barrett, et al., 2013). Computational and statistical methods play an important role in processing and retrieving information in expression datasets. One of the most famous platforms is Bioconductor which contains R software packages for analysis of microarray and other high-throughput genomic data (Reimers and Carey, 2006). Table 1 lists resources and software packages used in this study for gene expression analysis.
13 Table 1 List of software packages and resources for gene expression analysis
Name Description Reference
Affy R package for low-level analysis of Affymetrix GeneChip (Gautier, et al., 2004) PLIER R package for normalizing Affymetrix probe-level expression
data
(Hubbell, et al., 2005)
Limma Linear model for differential expression analysis (Smyth, 2005) metaMA R package for effect size and p-value combination method in
meta-analysis
(Marot, et al., 2009)
Piano R package for integrative analysis including various methods for gene set analysis
(Varemo, et al., 2013)
BioNet R package for the integrative analysis of gene expression data in the context of biological networks to identify functional modules
(Beisser, et al., 2010)
GEO Database of raw/processed functional genomic data including microarray and next-generation sequencing data
(Barrett, et al., 2013)
ArrayExpress Functional genomic data repository including raw/processed microarray and next-generation sequencing data. Data are imported from GEO and from direct submission
(Rustici, et al., 2013)
Typical types of gene expression analyses include the identification of differentially expressed genes in conditions of interest comparing to reference condition using methods such as t-test statistic. Gene clustering is for pattern finding and genes grouped together are highly correlated in terms of expression profiles. Gene set enrichment analysis or gene set analysis (GSA) is an approach to discover significant biological themes or gene sets under specific states based on the incorporation of differential expression evidence to priori biological knowledge such as biological processes and metabolic pathways (Varemo, et al., 2013). This analysis helps the biological interpretation of a large gene list. There are a number of GSA methods available these days, for instance the mean of gene-level statistics (e.g. t-values) is simply set as a gene set statistic, and the reporter feature algorithm combines gene-level statistics (e.g. p-values) for a gene set (Oliveira, et al., 2008).
Nowadays there are a large number of gene expression data generated providing an important chance to increase statistical power, reliability and generalizability of analysis results. Meta-analysis is a statistical method which combines results from multiple-related studies to obtain homogeneous effects and heterogeneity across related studies (Ramasamy, et al., 2008). Several meta-analysis techniques have been implemented, for example vote counting, p-value
14
combination and effect size combination, the choice of which is subject to an objective of study. For the effect size combination approach which was used in this thesis, an effect size is a degree of the strength of an event or effect. In the meta-analysis, the effect size is calculated from each study and then combined to an overall size of the effect for each gene (Choi, et al., 2003; Feichtinger, et al., 2012). This method is preferential over p-value combination because it provides the magnitude of the effect.
Furthermore, availability of interactome data such as protein-protein interaction (PPI), genetic interaction and protein-DNA interaction (PDI) or transcription factor bindings allows us to perform analysis in the context of network-based analysis. Integration of transcriptome data to the network scaffold can contribute to module or subnetwork discovery. Here, gene expression results are the input for calculating the score of a module. With a search algorithm active modules with high score can be identified (Dittrich, et al., 2008). Such analysis aids our understanding of how molecules work together to drive cellular processes under a particular condition (Berger, et al., 2013).
2.5 Biological networks
Complex biological processes are executed from interactions and regulations of a number of molecules. Through high-throughput experiments, various large-scale datasets have been generated and they have been assembled into different biological networks. Biological networks compose of nodes which are biological components such as gene or protein, and edges that represent interactions among the nodes. Thus far, about five types of biological networks have been characterized: protein–protein interactions (PPIs), protein phosphorylation networks, transcription factor binding networks, metabolic pathways and genetic interactions (Zhu, et al., 2007). PPIs and transcription factor binding networks are briefly described below.
PPIs are usually represented as undirected graph. They can be identified by a variety of methods such as yeast two-hybrid (Y2H), affinity purification mass spectrometry (AP-MS) and X-ray crystallography (Koh, et al., 2012). Y2H is capable to identify a huge number of binary interactions while AP-MS is to screen interactions between several proteins. X-ray crystallography provides very detailed structure of chosen interactions. Several interaction databases are available to date. STRING database includes protein interactions from both experiments and computational predictions (Franceschini, et al., 2013). BioGRID database contains both protein and genetic interactions. It comprehensively curates interaction data generated from both low- and high-throughput experiments (Stark, et al., 2011).
15 Transcription factor-binding networks have been identified from direct experiments including combining chromatin immunoprecipitation with microarrays (ChIP-chip) and combining ChIP with DNA sequencing (ChIP-seq). They can also be discovered by predicting targets of a transcription factor (TF) based on binding site preferences and the sequence of promoter (Blais and Dynlacht, 2005). YEASTRACT database is an online resource that contains regulatory associations among TFs and their target genes in yeast (Teixeira, et al., 2013). This information was deducted from ChIP-chip assays and from genome-wide expression analysis where TFs were knocked out (Teixeira, et al., 2006).
Generally speaking, cellular networks are huge and complex. They can be decomposed into groups of interacting components or modules. Network modules are densely connected molecules that are formed to achieve specific functions (Kwoh and Ng, 2007; Zhu, et al., 2007). Modules can be concluded into two types: a protein complex and a functional module (Spirin and Mirny, 2003). A protein complex (e.g. complexes of TFs) comprises groups of proteins forming molecular machinery to perform a specific activity, whereas functional modules are groups of molecules that orchestrate a particular process. Functional modules can be identified by incorporating gene expression data to locate active subnetworks that have significant expression changes under specific conditions (Aittokallio and Schwikowski, 2006). The concept of network motifs is to explain patterns of subgraphs that occur recurrently in complex networks (Zhang, et al., 2005). Motifs have been investigated for better understanding of network architecture.
Though incompleteness and errors in interaction networks may limit and bias results from network analyses, the exploration of these biological networks still contributes to novel insights in understanding how cellular mechanisms are driven by underlining molecular components.
16
3. Results and discussion
In this chapter, I will summarize the publications that are the basis of this thesis. They can be divided in to two main parts. The first part is about the design and implementation of yeast databases. The second part presents the application of bioinformatics approaches for the analysis of yeast ageing microarray data.
3.1 Design and development of yeast databases
Yeast is a model organism that has been used extensively to study essential cellular processes such as apoptosis, ageing and stress responses. As a result, a large amount of yeast-related data including comprehensive knowledge and genome data is available these days. Three yeast databases in Paper I-III were designed and developed by addressing different issues. Paper I focuses on collecting and structurally organizing related-information of a specific cell death pathway. Paper II facilitates exploitation of transcriptome data. Paper III concerns the integration of multi-level data.
3.1.1 Paper I: Yeast apoptosis database
Since apoptotic markers in yeast including DNA fragmentation, chromatin condensation and an exposure of phosphatidylserine at the cytoplasmic membrane were discovered by Madeo et al. (Madeo, et al., 1997), yeast has been used as a model organism for studying apoptosis subsequently. Apoptosis can be triggered by both endogenous triggers such as ageing and external stimuli including chemical and physical stress. The apoptotic core machinery and related pathways have been described and some have been found conserved in yeast such as apoptosis-inducing factor (AIF), endonuclease G and caspase pathway (Munoz, et al., 2012). Novel knowledge and important components are continually identified. Though, this information is dispersed in literature.
A yeast apoptosis database (yApoptosis) was implemented concerning a need of the research community for well organization of information. So that vital information can easily be shared, accessed and enhance research in yeast cell death areas. It also introduces a collaborative channel among research groups. The database was designed to collect information of curated apoptotic and related genes such as supported literature, human homologues, genome and functional information. In particular, a gene will be included into the database if it follows at least one of the following criteria:
1) It is annotated to the GO term ‘apoptotic process’ (GO: 0006915). There are 29 genes in the database that are assigned with this GO term.
17 2) It directly regulates the basic machinery of apoptosis. For example, PDS1 was included in the database because after apoptosis is induced, the caspase-like protease Esp1 is released from the anaphase inhibitor Pds1 (Yang, et al., 2008).
3) It belongs to another pathway that induces apoptosis downstream. For instance, we included RAS2 since it was reported that osmotin-induced cell death is regulated by PHO36 via a RAS2 signaling pathway (Narasimhan, et al., 2005).
Vital information for each gene such as detailed description, pathway information, protein sequence, GO annotations, links to original literature explaining the role of this gene in apoptosis and crucial external links are provided. These links to external resources facilitate exploration of other biological contexts of apoptosis genes. They include links to SGD for comprehensive biological information, UniProt for functional information of proteins, InterPro for information on protein families and domains (Hunter, et al., 2012), PSICQUIC View for molecular interactions (Aranda, et al., 2011), and Gene Expression Atlas for expression profiles in various conditions (Kapushesky, et al., 2010). This information is manually curated.
Based on extensive curation, the functional network of yeast apoptosis was drawn and also included to illustrate activities and relations between apoptotic-related components (e.g. triggers, genes and processes) in different locations (Figure 6A). Apart from cytoplasm, we found that the most number of apoptosis genes locate in mitochondria, nucleus and vacuole respectively. Mitochondria not only play a role in supplying cellular energy, it has also been accepted that mitochondria are important in execution of apoptosis both yeast and mammalian. Mitochondrial events triggering apoptosis in both mammals and yeast include mitochondrial fragmentation, collapse of membrane potential and release of AIF and cytochrome c, however the sequence of these incidences have not been confirmed (Eisenberg, et al., 2007). Components of mitochondrial death pathways in yeast (e.g. NDI1, MMI1 and DNM1) and their human orthologous (red boxes) are displayed in Figure 6A. In mammalian cells, activation of caspase by cytochrome c through caspase-9-Apaf1 pathway is well defined. Though yeast has a metacaspase Yca1 as an orthologue of mammalian caspases, yeast orthologue of Apaf1 has not been identified (Mazzoni and Falcone, 2008). An observation of how yeast caspase is activated would contribute to a complete picture of apoptosis process.
The relational database management system MySQL was applied and the friendly web interface was provided. We included typical functions to facilitate data query such as ‘browse’, ‘quick search’ and ‘search’ which allows specifying cellular location or process to constrain the query. The interactive representation of apoptosis networks was addressed to aid data visualization.
18
The apoptosis genes were further used in two analyses. The first analysis is predicting protein complexes from PPIs to find the complexes where apoptosis genes are a subunit using the algorithm ClusterONE (Nepusz, et al., 2012). The algorithm uses a greedy growth procedure to grow a cohesive group and calculates the cohesiveness score from edge weights to determine the possibility for a group of proteins to be a protein complex. The algorithm can also detect overlapping protein complexes based on the assumption that proteins might possess multiple functions. We found 11 apoptosis genes encoding protein subunits in 9 protein complexes. 5 complexes such as nuclear cohesin complex, small nucleolar ribonucleoprotein complex, decapping enzyme complex, chromatin silencing complex and GID complex were included in the MIPS benchmarks (Pu, et al., 2009). Apoptosis protein subunits of those complexes are Mcd1, Lsm1-4, Dcp1-2, Sir2 and Fyv10, respectively. Figure 6B shows an example of predicted complexes, GID complex, involving in proteasomal degradation of gluconeogenic enzymes: phosphoenolpyruvate carboxykinase and fructose-1,6-bisphosphatase (Santt, et al., 2008). Fyv10 is a protein subunit of the complex and it was also reported to have an anti-apoptotic role (Khoury, et al., 2008) suggesting that Fyv10 may possess dual roles.
The second analysis is to identify network modules in the integrated network of PPIs and transcription regulation interactions of apoptosis genes. We used the algorithm CyClus3D which use different types of network motifs to query the integrated network (Audenaert, et al., 2011). It allows us to find more realistic modules and investigate functional relationships between interaction types. Using this method we found 7 modules that have the same pattern of interactions. This simple pattern indicates transcriptional co-regulation of pairs of apoptosis proteins interacting together to perform their function (Figure 6C). For instance, it was reported that an oxidative stress-induced cell death in yeast is sensed by the Dre2-Tah18 complex (Vernis, et al., 2009). Higher doses of H2O2 destabilize its interaction causing delocalization of Tah18 to
mitochondria and cell death afterword. This protein pair is regulated by Yap1, TF responds to oxidative stress. It can be seen from the network that different TFs control common pair of the proteins. This aspect supports the fact that cells have condition-specific TFs (such as Gcn4 acts in response to amino acid starvation) but they maintain common responses downstream (Gasch and Werner-Washburne, 2002).
19
Figure 6 Networks of apoptosis genes. A) Functional network of yeast apoptosis. Human orthologues are in red boxes while yeast genes are in yellow boxes. Diagram legends can be found in detail from yApoptosis webpage (http://ycelldeath.com/yapoptosis/index.php). B) GID protein complex. An apoptosis-related gene, FYV10 is in purple box. C) Identified motif clusters. A directed edge represents transcriptional regulation while undirected edges are PPIs. Color of edges presents members of a cluster.
A)
20
Programmed cell death (PCD) is considered as a complex process under tightly molecular controls. Based on morphological studies, there are three different phenotypes defined for PCD: apoptosis, necrosis and autophagy (Zappavigna, et al., 2013). As mentioned in the previous section, typical features of apoptosis include phosphatidylserine externalization, the condensation of chromosome and DNA fragmentation. Cell death by necrotic program shows important morphologies including increase in cell volume and plasma membrane rupture causing release of intracellular contents. Necrosis in yeast occurs after brutally exposing cells to chemical or physical substances. It also has been described to be the last fate of an apoptotic dead cell that has the loss of plasma membrane integrity due to the collapse of cellular system (Ludovico, et al., 2005). Besides necrosis is suggested to have correlations with ageing as markers of necrosis were found among dead cells in chronologically ageing colonies (Eisenberg, et al., 2010). Autophagy is a catabolic process that is conserved in eukaryotic cells. It involves the degradation of cytoplasmic components by lysosome in mammalian or vacuole in yeast to generate an amount of molecules to be recycled. Therefore, autophagy is induced in nutrient-limited conditions and it is crucial for regulation of organelle homeostasis such as degrading damaged mitochondria (Cebollero and Reggiori, 2009). In addition, an ageing process has been associated with autophagy in particular through TOR pathway (i.e. increasing autophagy results in lifespan extension.). It can be seen that autophagy itself serves a cytoprotective process (Madeo, et al., 2010; Rubinsztein, et al., 2011).
Research in yeast PCD is still ongoing. As mentioned in the previous paragraph, there are opening questions that need to be resolved. Studies on yeast necrosis are also at very beginning comparing to apoptosis and autophagy. Figure 7 illustrates molecular components in yeast PCD subroutines derived from published literature (Carmona-Gutierrez, et al., 2010; Cebollero and Reggiori, 2009; Eisenberg, et al., 2010). It can be seen that some components are shared among PCD types e.g. NUC1 and RAS2. Investigation of interplay among cell death machineries may contribute to understanding of how a cell decides its fate. Key players of mammalian PCD are presented in yeast genome supporting the use of yeast as a simple model for observing complex scenarios of mammalian PCD. The list of yeast orthologues of mammalian apoptosis components was retrieved from the database and summarized in Table 2.
In conclusion, yApoptosis is the first part of a yeast cell death database (yCellDeath) that has been established to gather information on various aspects of yeast PCD. yApoptosis represents a kind of specific repositories for sharing information and communicating between scientific communities. The total number of visitors after publishing the paper in October 2013 until May 2014 is 360 visitors. Among them, 45.6% are new visitors while 54.4% are returning visitors. An
21 overview of visitors is shown in Figure 8. The relational database was chosen by considering its ease of use and well standardization. We also performed network analyses using the collected genes as seed nodes to illustrate the applications of the database. The database structure of yApoptosis and data generation processes can be a blueprint for developing other PCD databases in the yCellDeath compendia.
Table 2 Yeast apotosis genes and human orthologues
Yeast Mammalian Function in apoptosis
AIF1 AIF Lead to chromatin condensation and DNA degradation (Wissing, et al., 2004)
AIM14 NADPH oxidases Control non-mitochondrial ROS production (Rinnerthaler, et al., 2012)
BIR1 XIAP Inhibitor of apoptosis protein (Walter, et al., 2006) BXI1 Bax inhibitor-1 (BI-1) Inhibitor of BAX protein (Cebulski, et al., 2011)
CDC48 VCP Mutation causes ER stress (Carmona-Gutierrez, et al., 2010) CDC6 CDC6 Require for DNA replication (Blanchard, et al., 2002)
CPR3 Cyclophilin D Participate in refolding protein after import into mitochondria (Liang and Zhou, 2007)
DNM1 DRP1 Mitochondrial fragmentation (Fannjiang, et al., 2004) DRE2 Ciapin1 Anti-apoptosis by binding to Tah18 (Vernis, et al., 2009) ESP1 Separin Caspase-like protease targets Mcd1 (Yang, et al., 2008)
MCD1 RAD21 (human cohesion) Decrease mitochondrial membrane potential (Yang, et al., 2008) NDI AMID Increase ROS production in mitochondria (Li, et al., 2006) NMA111 Omi/HtrA2 Serine protease targets anti-apoptotic protein Bir1 (Walter, et al.,
2006)
NUC1 Endonuclease G (EndoG) Major mitochondrial nuclease (Buttner, et al., 2007) PET9 VDAC Mitochondrail permeabilization (Pereira, et al., 2007) POR1 ANT Mitochondrail permeabilization (Pereira, et al., 2007) RNY1 RNASET2 Cleave tRNA (Thompson and Parker, 2009)
Tat-D Nuclease DNA degradation (Qiu, et al., 2005)
22
Figure 7 Networks of yeast PCD. The figure illustrates three modes of PCD: apoptosis (blue), necrosis (green), and autophagy (yellow). Different phenotypes represent in grey boxes. Nodes marked in red involve in more than one mode of PCD. Solid edges denote either triggering or inhibition. Dashes denote putative genes or interactions that have not been confirmed. Figure adapted from (Munoz, et al., 2012).
Figure 8 Overview of visitors to yApoptosis. A) The number of visitors in weeks. B) The number of visitors by countries. The color-scale is based on the number of visitors. Visiting statistics were generated from Google Analytics (http://www.google.com/analytics/) starting from October 2013 to May 2014.
A)
23
3.1.2 Paper II: Yeast stress expression database
Similar to other organisms, yeast has to face several kinds of changes in its environments, for example fluctuations in pH, temperature, nutrient level, osmotic pressure, amount of oxygen, and the presence of various agents like toxic compounds and drugs. Appropriate responses to these variations are inevitably required for competitive fitness and cell survival. It was found that the stress-response schemes in yeast count significantly on genome-wide transcriptional changes (Causton, et al., 2001). As a result several studies used genome-wide expression experiments such as microarray to measure gene expression levels of yeast under different environments (Causton, et al., 2001; Gasch, et al., 2000). Nowadays, most gene expression data are deposited in public repositories such as ArrayExpress (Rustici, et al., 2013) and GEO (Barrett, et al., 2013). Even though these data are made available online, efficient utilization of the data from those databases is not straightforward.
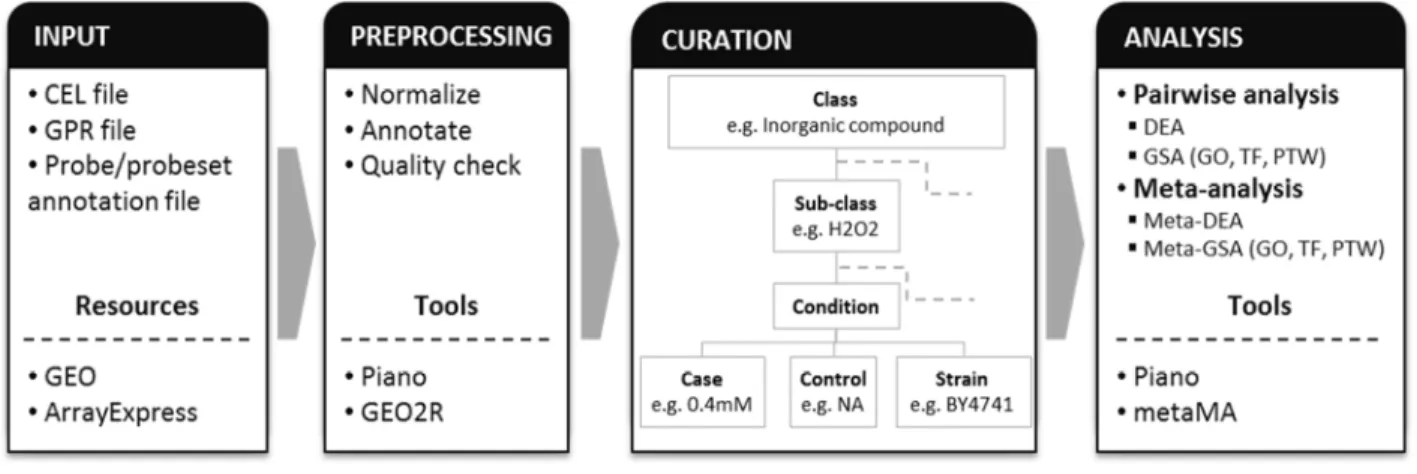
We therefore developed a yeast stress expression database (yStreX) showing an effort to enhance exploitation of transcriptome data in the area of yeast stress responses. We adapted the concepts of Experimental factors (EFs) and EF values used in Gene expression atlas database (Kapushesky, et al., 2010) to describe experimental conditions in a united way allowing comparison between independent experimental setups and meta-analyses among related studies). Figure 9 shows the workflow of data preparation and analysis.
Figure 9 Analysis workflow. The diagram shows the workflow of data preparation and analyses. Microarray datasets were retrieved from GEO and ArrayExpress database and were preprocessed before curated into defined experimental classes and sub-classes. Statistical analyses were performed including DEA, GSA and meta-analysis. Data sources and tools used are also listed in the boxes.
24
Typical tasks of gene expression analyses including differential expression analysis (DEA), gene set analysis (GSA) and meta-analysis were performed on microarray datasets generated from different stress-induced conditions. R is the main platform for statistical computing in this study. Limma R package (Smyth, 2005) was used to calculate gene-level statistics (including fold-changes, t-values and p-values) for each gene on each experimental condition. For GSA, Reporter algorithm (Oliveira, et al., 2008) was used to compile significant gene sets on three classes of existing biological knowledge: GO, TF and pathway (PTW) in each experimental condition. Meta-analysis was performed on datasets from two or more independent, but relevant studies using a moderated effect size combination in metaMA R package (Marot, et al., 2009). The effect size was calculated for each gene in each study and then was combined before assessing for DE genes of a specific condition. The resulting test statistics, or we call meta-z-scores, were used in GSA for computing significant gene sets. Detailed descriptions about statistical analyses can be found in Paper II.
The document-oriented database MongoDB (Chodorow and Dirolf, 2010) was used to store dataset information and results from the analyses as JavaScript object notation (JSON) documents. The web interface with different functions to access and explore the analysis results including statistical values of genes and enriched biological features was provided. Mainly there are two approaches to query the data: 1) searching by a gene or a set of genes for conditions where the queried genes significantly expressed, and 2) querying by a condition to retrieve a set of differentially expressed genes from the meta-analysis of related studies.
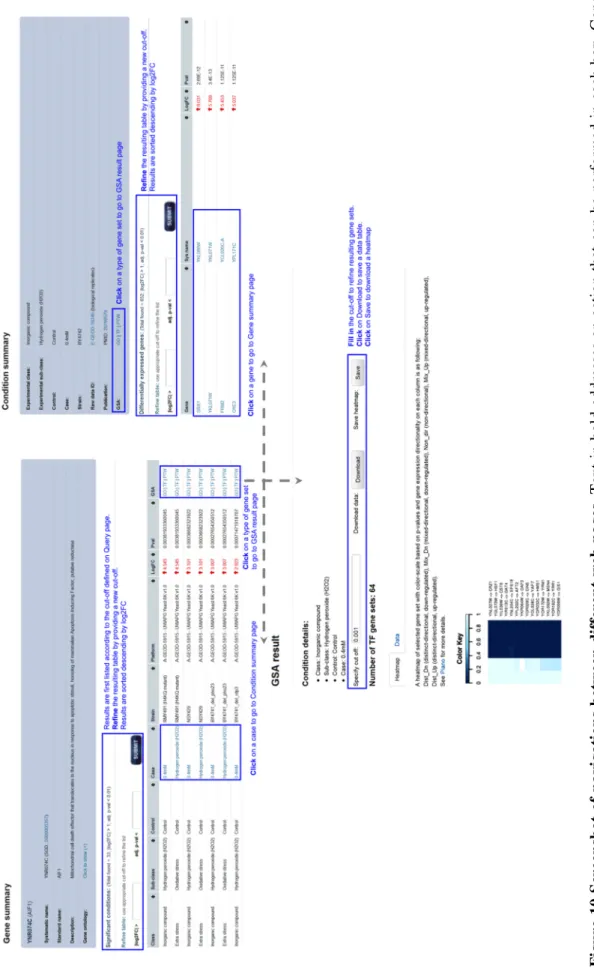
Two examples were included to show applications of the database. The first example illustrated concurrent query of 51 apoptosis-related genes from yApoptosis database to find significant genes under oxidative stress induction by H2O2. It also showed database features and navigations
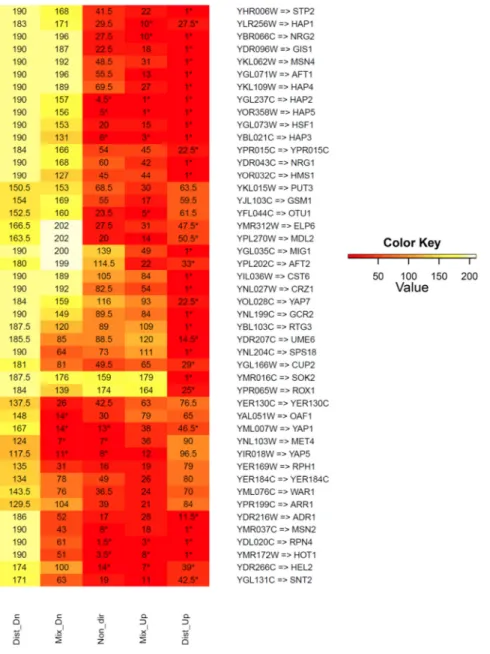
between different pages such as Gene summary, Condition summary and GSA result (Figure 10). The second example showed the results from the meta-analysis, which combines gene expression data from independent, but related experiments. In this example, these experiments compared Rapamycin treated (TOR complex 1 (TORC1) inhibition) to untreated condition. It has been described TOR pathway coordinate signals with other signaling pathways including Sch9 and PKA pathway to regulate stress response, cell growth, ribosome biogenesis, and other cellular processes (Cheng, et al., 2007; Wei, et al., 2009). In accordance with the report in literature, common stress response TFs such as Gis1, Msn2 and Msn4 were found enriched in up-regulated genes. The consensus heatmap of TFs gene sets is shown in Figure 11.
2 5 F ig u re 1 0 S cr ee n sh o t o f n a v ig a ti o n s b et w ee n d if fe re n t w eb p a g es . T ex t in b o ld a d d re ss es a n a ct io n t h at c an b e p er fo rm ed i n e ac h b o x . G en e su m m ar y p a g e co n ta in s in fo rm at io n a b o u t a g en e an d C o n d it io n s u m m ar y p ag e in cl u d es d et ai ls a b o u t a se le ct ed c o n d it io n . G S A r es u lt p ag e co n ta in s b o th t h e h ea tm ap a n d t h e d at a ta b le o f th e se le ct ed g en e se t, T F g en e se ts i n t h is e x am p le . T h e co lo r in te n si ty i s b as ed o n p -v al u es . 25
26
Figure 11 Part of the consensus heatmap of TF gene sets. The heatmap is a result from GSA on TF gene sets. The studies compared Rapamycin treated to untreated condition. The color-scale is based on the consensus score represented also by a number. Significant gene sets (p-value < 0.05) are marked with an asterisk. Each column indicates the gene expression directionality of the genes belonging to the TF gene sets.
27 In summary, yStreX is an online repository that highlights the needs to efficiently utilize and distribute gene expression data. It includes not only readily-analyzed gene expression but also enriched biological features of gene lists which would help scientists in the field to make sense of the data. A friendly web interface provided enables fast access and assists inference from these resulting data. Besides, creating the specific compendia of transcriptome data is enable us to perform meta-analyses regardless of different platforms and laboratories which can enhance statistical power, reliability and generalization of results.
The database aims to serve experimental molecular biologists who do not wish to re-analyze data. This aspect is usually a limiting factor for databases that just have a collection of raw data. Though such databases can be used in broader applications, they expect users to know in advance how to process the data and how to carry out data analysis. To compromise this issue, a link back to the original data was provided allowing users to access raw data and achieve additional work which might not be in the extent of the yStreX.
yStreX was developed on a document-oriented NoSQL database showing the use of a next generation database. The NoSQL database was chosen as it has appeared to be a preferred database choice for big data applications and a predefined schema is not needed in contrast to typical relational databases (Couchbase, 2013). The last aspect benefits for scaling out the database when the amount of data grows in the future.
We also demonstrated by two examples how the database can be exploited. In addition to these, pre-analyzed gene expression data can be broadly applied, for instance integrating to network scaffolds for identification of functional modules or using as additional information to improve PPI confidence (Bader, et al., 2004; Beisser, et al., 2010).
28
3.1.3 Paper III: Yeast data repository
The main aim of systems driven research such as systems biology is to understand how molecules, pathways and networks organize to drive complex biological systems (Sreenivasaiah and Kim do, 2010). This is usually done by integration of data from different levels including genome, transcriptome, proteome, metabolome, interactome and reactome to formulate a model that describes how the systems work (Ideker, et al., 2001). Advances in high-throughput technologies these days have resulted in explosive generation of multi-level of omics data which is, therefore, beneficial for driving systems biology research. However it is a challenging issue for data integration when facing with complex, heterogeneous, highly dynamic, incomplete and disassembling characteristics of those data.
With those in mind, a database system for handling multi-level data was developed. The database system aims to solve the vital issues in data management and to facilitate data integration, modeling and analysis within a single database. The database schema was adapted from ontology classes of BioPAX (Demir, et al., 2010) and implemented using an object-oriented concept. This concept represents a biological component as an object containing important attributes and a variety of relationships. It is applicable for heterogeneous and sophisticated biological data (Cooray, 2012; Okayama, et al., 1998).
A yeast data repository was then developed on top of the database system to represent a sole database environment or a centralized database underlining with multiple levels of yeast data (e.g. genome information, annotation data, interaction data and metabolic model) from different resources. List of the data is summarized in Table 3 and Figure 12 illustrates the database architecture.
We demonstrated usability and applications of the yeast data repository to achieve different tasks. A simple web interface was provided including a basic query interface which allows searching for different objects such as gene, protein and metabolite. Search results include not only the matched object but also other essential objects related to the resulting object. Figure 13A schematically presents results from querying a gene INO1. In general, it has been described that DNA makes RNA and RNA encodes protein. A protein then performs its function e.g. as an enzyme in a biochemical reaction. Based on yeast data in the database, related objects such as interacting partners of encoded protein, metabolites of the reaction catalyzed by INO1-encoded protein and TFs regulating expression of INO1 were reported as the part of the queried results. Furthermore, two research cases were conducted. First, the pheromone pathway segment was retrieved from PPI data using a protein receptor Ste3 as a starting protein and a TF Ste12 as an ending point. Reconstruction of PPI networks can contribute to identification of unknown