The effects of caloric restriction- and exercise-induced weight loss on left
ventricular diastolic function
Matt M. Riordan,1,3Edward P. Weiss,2,4Timothy E. Meyer,2Ali A. Ehsani,2Susan B. Racette,2 Dennis T. Villareal,2Luigi Fontana,2,5John O. Holloszy,2and Sa´ndor J. Kova´cs1
1Cardiovascular Biophysics Laboratory, Cardiovascular Division, Department of Internal Medicine, and2Division of Geriatrics and Nutritional Science, Washington University School of Medicine;3Department of Biomedical Engineering, School of Engineering and Applied Science, Washington University, Saint Louis, Missouri;4Department of Nutrition and Dietetics, Saint Louis University, Saint Louis, Missouri; and5Division of Food Science, Human Nutrition and Health, Istituto Superiore di Sanita´, Rome, Italy
Submitted 24 October 2007; accepted in final form 21 December 2007 Riordan MM, Weiss EP, Meyer TE, Ehsani AA, Racette SB, Villareal DT, Fontana L, Holloszy JO, Kova´cs SJ.The effects of caloric restriction- and exercise-induced weight loss on left ven-tricular diastolic function. Am J Physiol Heart Circ Physiol 294: H1174–H1182, 2008. First published December 27, 2007; doi:10.1152/ajpheart.01236.2007.—Little is known about the effects of weight loss on diastolic function. Furthermore, it is not known whether both caloric restriction (CR)- and exercise (Ex)-induced weight loss have salutary effects on diastolic function. Therefore, we assessed the effects of yearlong CR (n ⫽ 12) and Ex (n ⫽ 13) interventions, which induced⬃12% weight loss, on diastolic function in healthy, nonobese (body mass index⫽23.5–29.9 kg/m2) men and women aged 50 to 60 yr. Recordings of Doppler transmitral flow and Doppler tissue imaging were acquired and analyzed by conventional approaches and a validated parameterized diastolic filling (PDF) formalism. Isovolumic relaxation time decreased after weight loss in both groups (P⬍0.05). Septal peak early mitral annular velocity (E⬘) increased (P⬍ 0.01) and peak E-wave velocity/E⬘ decreased (P⬍ 0.05) after weight loss in the CR group. Based on the PDF-derived indexes, CR resulted in a decrease in global ventricular stiffness (k) and increases in longitudinal (septal annulus motion) stored elastic strain (x⬘o), peak force (k⬘xo⬘), and peak stored strain energy (1/2k⬘x⬘o2). In the Ex group, kwas unchanged, although septal x⬘oand 1/2k⬘x⬘o2 increased significantly and k⬘x⬘o (P ⫽ 0.13) tended to increase. We conclude that weight loss, whether induced by CR or Ex, has salutary effects on diastolic function.
diet; echocardiography; tissue Doppler imaging; diastole
SEVERAL STUDIES HAVE SHOWNthat body weight has an effect on
diastolic function (1, 16, 31, 32). In particular, obesity has been demonstrated to have adverse effects on diastolic function independent of comorbidities and other physiological and de-mographic characteristics (32). Substantial weight loss in mor-bidly obese subjects, induced by gastric bypass, has been reported to improve diastolic function (1, 31). However, it is not known whether moderate weight loss improves diastolic function in individuals with high-normal or overweight body mass index (BMI). In addition, although the restriction of caloric intake and exercise (Ex) are commonly employed weight loss strategies, it is not known whether either or both of these weight loss interventions are effective for improving diastolic function. Therefore, the purpose of the present study
was to determine whether modest weight losses induced by caloric restriction (CR) and Ex have beneficial effects on diastolic function in asymptomatic, healthy, nonobese, middle-aged men and women. Since we intended to study the cardiac effects of CR and Ex rather than the effects of CR and Ex interventions on the general public (i.e., our interest was the efficacy rather than the effectiveness of CR and Ex), we excluded subjects who did not fit these criteria or did not comply with these interventions.
In this investigation, in addition to assessing left ventricular (LV) geometry and function via conventional echocardio-graphic methods, we analyzed LV diastolic function with an established model of LV filling and wall motion [known as the parameterized diastolic filling (PDF) formalism (14)] with validated clinical utility to better understand the physiological changes that affect filling as a result of weight loss. We hypothesized that diastolic function improves in response to moderate weight loss in healthy, nonobese men and women, regardless of whether weight loss is induced by CR or Ex. This study was part of a larger trial [comprehensive assess-ment of long-term effects of reducing intake of energy (CALERIE)] designed to study the feasibility of long-term CR in humans (20).
METHODS
Participants.Forty-eight healthy men and women with an ejection fraction (EF) of⬎50% were recruited from the St. Louis metropolitan area and enrolled in the study. The subjects were 50 to 60 yr of age, had BMI values of 23.5–29.9 kg/m2, and were weight stable for at least 3 mo before enrollment. Exclusion criteria included1) a history or clinical evidence of diabetes, coronary artery disease, stroke, or lung disease;2) a resting blood pressure (BP) over 170 mmHg systolic and/or 100 mmHg diastolic; 3) a recent history or evidence of malignancy; and4) smoking. For at least 6 mo before baseline testing, all candidates were sedentary (defined as exercising less than 20 min per day or less than twice per week) and did not have changes in medications that would affect study outcomes. All women were postmenopausal.
Eligible study participants were randomly assigned to the CR, Ex, or a control group in a 2:2:1 ratio. Echocardiographic data were not collected from the control group participants; therefore, these subjects were not included in the analyses for the present report. Nineteen participants were enrolled in each intervention group (CR and Ex),
Address for reprint requests and other correspondence: S. J. Kova´cs, Cardiovascular Biophysics Laboratory, Washington Univ. Medical Center, Box 8086, 660 S. Euclid Ave., St. Louis, MO 63110 (e-mail: sjk@wuphys. wustl.edu).
The costs of publication of this article were defrayed in part by the payment of page charges. The article must therefore be hereby marked “advertisement” in accordance with 18 U.S.C. Section 1734 solely to indicate this fact. First published December 27, 2007; doi:10.1152/ajpheart.01236.2007.
and because one participant in each group dropped out before fol-low-up testing, 18 participants in each group successfully completed the study. Data from several of the subjects who completed the study were excluded from the analyses for the present report for the following reasons: 1) missing data (CR group, n ⫽ 2); 2) LV hypertrophy at baseline (CR group,n⫽1); and3) poor intervention compliance, as evidenced by little or no weight loss (⬍4.5% of initial body weight) by the end of the study (CR group,n⫽3; and EX group, n⫽5). Therefore, the analyses in the present report are based on 12 CR group participants (4 men and 8 women) and 13 Ex group participants (6 men and 7 women). Additional data were missing for some outcomes due to technical problems during sonography; the exact sample sizes for each outcome are indicated in the tables.
The study was approved by the Washington University School of Medicine Human Studies Committee and the General Clinical Re-search Center Scientific Advisory Committee. Written, informed con-sent was obtained from each participant before data acquisition.
CR intervention. The objective in the CR intervention was to decrease the subjects⬘energy intake by 16% during the first 3 mo and by 20% during the remaining 9 mo of the yearlong intervention. The CR group subjects met with dieticians on a weekly basis during which weights were measured and a consultation was provided to maximize compliance. As a general strategy for reducing energy intake, the participants were encouraged to reduce food portion sizes and to substitute foods with low energy density for those with high energy density.
CR intervention compliance has been reported in detail previously. However, in brief, energy intake decreased by 12%, as determined by doubly labeled water (with corrections for body composition changes) and by 15% according to 7-day food diaries (20). Physical activity energy expenditure did not change significantly according to 7-day physical activity recall questionnaires (⫺4%, nonsignificant) (29). Maximal oxygen uptake did not change when expressed relative to body weight (⫹4%, nonsignificant) but decreased by 7% when ex-pressed in absolute terms (30).
Ex intervention. The Ex intervention was designed to induce a similar energy deficit as would result from the CR intervention, but by increasing energy expenditure by 16% during the first 3 mo and by 20% during the remaining 9 mo while maintaining energy intake at baseline levels. Specific exercise energy expenditure goals were calculated as described previously (29) and given to the subjects during weekly meetings with exercise trainers. The subjects exercised in our facility or on their own while using wristwatch-type heart rate (HR) monitors (S610; Polar Electro Oy, Kempele, Finland). These monitors stored exercise-specific data for HR, gross energy expendi-ture, exercise duration, and the number of exercise sessions per-formed. Data from the HR monitors were downloaded to a study computer on a weekly basis. On average, and as reported previously for a slightly larger sample that included noncompliant subjects (29), the participants exercised ⬃6 days per wk for about 60 min per session at⬃70% of maximal HR while walking, performing elliptical machine exercise, cycling, and running.
Ex intervention compliance has been reported in detail previously. However, in brief, physical activity energy expenditure increased by 36% according to 7-day physical activity recall questionnaires (29), and maximal oxygen consumption increased by 28% when expressed relative to body weight or by 16% in absolute terms (30). Energy intake did not change (0% change) according to doubly labeled water (with corrections for body composition changes) and 7-day food diaries (⫹2%, nonsignificant) (20).
Body weight.Fasted, gowned body weight was measured after the subject’s first morning void. Height was measured using a wall-mounted stadiometer and was used along with body weight to calcu-late BMI.
BP.Systolic and diastolic BP were measured with an oscillometric BP monitor (Dinamap Procare 200; GE Healthcare, Waukesha, WI) with the subject in the supine position. In the CR group, BP was
measured in the morning after a 12-h fast; in the Ex group, BP was measured at least 48 h after the last exercise session. A certified nurse measured the BP, and the measurement process was monitored reg-ularly to ensure adherence to the protocol.
Echocardiography.A standard two-dimensional Doppler echocar-diographic examination was performed in accordance with American Society of Echocardiography (ASE) guidelines using a commercial echocardiographic imaging system (SONOS 5500; Hewlett-Packard, Andover, MA) equipped with a 3-MHz transducer (7). The participant was supine or in the left lateral position for the examination. Doppler transmitral flow velocity images (E-waves and A-waves) were ac-quired in the four-chamber view according to ASE criteria (7). LV annular velocities were recorded with pulsed-wave Doppler tissue imaging (DTI) (18). Annular velocities were recorded from the apical window with the Doppler sample volume placed at the septal and lateral aspects of the mitral annulus from the four-chamber view. Gain and filter settings were optimized to obtain the sharpest velocity profile without losing the low-velocity signals at a sweep rate of 100 mm/s. M-mode recordings were obtained at the near mid-LV level in accordance with ASE criteria (7). LV internal dimensions and wall thicknesses were measured using the Penn convention, and LV mass was calculated according to the cubic formula proposed by Devereux and Reichek (5). LV mass data are presented as LV mass index (LVMI; LVMI ⫽ LV mass/body surface area). End-diastolic and systolic volumes were calculated from diastolic and end-systolic diameters obtained from M-mode, respectively. All record-ings were stored on a video home system (VHS) tape.
Doppler analysis.For all subjects, three to five transmitral Doppler E- and A-wave images and DTI E⬘- and A⬘-wave images were selected, clipped, and converted to eight-bit grayscale images with Paint Shop Pro 7 (Jasc Software, Minnetonka, MN). These images were used to characterize global and longitudinal diastolic filling (DF) based on conventional and PDF-based analyses. The diastolic function indexes were determined from the average values obtained from the selected Doppler transmitral flow and DTI images.
Conventional echocardiographic indexes of diastolic function were measured from the transmitral Doppler E- and A-wave contours and included deceleration time (DT), peak E- and A-wave velocity (E and A, respectively), E/A, E-wave velocity-time integral (VTIE), and isovolumic relaxation time (IVRT). As is the custom, these parameters were all measured manually, with DT calculated using standard triangle approximation for E-wave shape (7). IVRT was measured on the Doppler tracing as the time between the closure of the aortic valve and the opening of the mitral valve as evidenced by the leading edge of the E-wave (7).
Conventional indexes of longitudinal diastolic function were de-rived from the DTI contours using the same analytical approach as described for the transmitral Doppler analysis. The calculated indexes included peak early and late mitral annular velocity (E⬘ and A⬘, respectively) and their ratio (E⬘/A⬘). Additionally, E/E⬘was calculated as an index of LV filling pressure (9).
PDF-derived indexes of global diastolic function were assessed from the transmitral Doppler images. E-waves were fit by a blinded observer using model-based image processing according to the PDF formalism. Methodological details about the PDF formalism and its validity have been previously presented in depth (2, 8, 13a, 14, 21–23). In brief, the PDF formalism expresses the velocity contour of the E-wave in terms of the equation of motion of a damped simple harmonic oscillator released from rest at a given displacement via an inertial term, elastic (stiffness) term, and damping (relaxation/viscos-ity) term. In fitting the solution to the simple harmonic oscillator equation of motion to each E-wave contour, lumped parameters that quantify LV chamber stiffness (k), chamber relaxation/viscoelasticity (c), and stored elastic strain (xo) can be uniquely determined. Addi-tional PDF-derived indexes includekxo, which reflects the peak force in the spring and corresponds to the peak atrioventricular pressure gradient that generates the E-wave (2, 14), and 1/2kxo2, which is
the stored potential elastic energy capable of generating recoil (14). These parameters have well-established causality-based physiological analogs and have been shown to be more sensitive in characterizing diastolic function than conventional E- and A-wave-based indexes in a variety of clinical scenarios (13a, 21–23). Importantly, the PDF parameters should be viewed as direct measures of diastolic function like conventional Doppler indexes such as E and DT because they also characterize aspects of E-wave shape (although in different terms). For example, to the extent to which E-wave shape resembles a pure sine wave, the parameters xo and k denote the amplitude and fre-quency of the wave, respectively, whereascquantifies the extent to which the E-wave deviates from a pure sine wave in terms of the asymmetry between its acceleration time and DT. Therefore, the PDF
parameters and associated indexes are inherently shape based like conventional noninvasive diastolic function indexes but confer the additional advantage of describing LV filling mechanistically in terms of stiffness, relaxation/viscoelasticity, and stored elastic strain based on the suction pump behavior of the LV.
PDF-derived indexes of longitudinal DF were determined by using model-based image processing to fit the E⬘-waves from DTI of the lateral and septal aspects of the mitral annulus. The procedure used for analyzing the E⬘-waves was the same as that used for analyzing the pulsed-Doppler transmitral E-waves (23). The E⬘-wave analysis was used to generate the unique physiological parameters c⬘, k⬘, andx⬘o (PDF parameters denoted by primes denote DTI-derived parameters), which reflect the longitudinal damping constant (i.e., longitudinal
Fig. 1. Illustration of the parameterized diastolic filling (PDF) model fit to a pulsed-Doppler E-wave and Doppler tissue imaging septal E⬘-wave from a single representative subject.A: E-wave with PDF model-predicted fit superim-posed (solid black line). Best-fit global PDF parameters are chamber relaxation/viscoelasticity (c)⫽21.1 g/s, chamber stiffness (k)⫽191 g/s2, and stored elastic strain (x
o)⫽10.3
cm.B: E⬘-wave from the same subject with PDF model-predicted fit superimposed (solid black line). The E⬘-wave is inverted and has a magnified velocity scale to improve clarity. Best-fit longitudinal PDF parameters are longitudi-nal damping constant (c⬘)⫽15.1 g/s, longitudinal stiffness (k⬘)⫽207 g/s2, and stored longitudinal elastic strain (x⬘
o)⫽
1.0 cm. SeeRESULTSand tables for details regarding changes in PDF parameters following weight loss.
Table 1. Subject characteristics
n Baseline 1 yr % Change PValue, Within-Group Change, Baseline Vs. 1 yr PValue, Between-Groups Change Weight, kg† CR 12 78 (SD 8) 68 (SD 9) ⫺13.3 (SD 4.6) ⬍0.0001 0.35 Ex 13 77 (SD 11) 68 (SD 8) ⫺11.1 (SD 4.8) ⬍0.0001 BMI, kg/m2† CR 12 27 (SD 2) 24 (SD 2) ⫺11.1 (SD 4.8) ⬍0.0001 0.22 Ex 13 27 (SD 2) 24 (SD 2) ⫺13.3 (SD 4.6) ⬍0.0001 EF, % CR 12 69 (SD 4) 69 (SD 4) 0.2 (SD 5.8) 0.53* 0.97 Ex 11 69 (SD 5) 69 (SD 5) 0.9 (SD 7.0) 0.75 LV mass, g CR 12 148 (SD 53) 143 (SD 48) 0.3 (SD 24.1) 0.67 0.80 Ex 11 144 (SD 48) 144 (SD 43) 2.5 (SD 25.1) 0.96 SBP, mmHg CR 12 117 (SD 13) 107 (SD 15) ⫺7.9 (SD 11.4) 0.03 0.01 Ex 13 121 (SD 15) 124 (SD 12) 3.3 (SD 13.8) 0.58 DBP, mmHg CR 12 67 (SD 10) 61 (SD 9) ⫺9.4 (SD 12.1) 0.01 0.006 Ex 13 68 (SD 10) 70 (SD 10) 5.6 (SD 16.2) 0.34 Resting HR, beats/min† CR 12 64 (SD 11) 58 (SD 12) ⫺9.0 (SD 11.6) 0.16 0.90 Ex 13 67 (SD 13) 61 (SD 14) ⫺8.7 (SD 17.8) 0.15
Values are means (SD);n, number of subjects. Ejection fraction (EF) and left ventricular (LV) mass were only determined for 11 of the exercise group (Ex) subjects due to a lack of M-mode images for the other 2 subjects. CR, caloric restriction group; BMI, body mass index; SBP, systolic blood pressure; DBP, diastolic blood pressure; HR, heart rate. *Pvalue based on Wilcoxon’s signed rank test. †Data collected at 3, 6, and 9 mo are included in the analytical model although not presented in the table for brevity.
relaxation/viscosity), spring constant (i.e., longitudinal stiffness), and stored longitudinal elastic strain before mitral valve opening, respec-tively. The PDF formalism fit to representative E- and E⬘-waves from a study participant is shown in Fig. 1.
Statistical analysis. Data analyses were performed using mixed model repeated-measures ANOVA for variables that were measured at more than two time points (i.e., BMI, weight, fat percentage, fat mass, fat-free mass, and HR, all of which were measured at baseline and 1, 3, 6, 9, and 12 mo); Tukey tests were used for post hoc analyses. For all other variables, including the primary outcomes, the within-group, baseline-to-1-yr changes were analyzed with paired t-tests, except when the statistical assumptions were not valid; in these cases, Wilcoxon’s signed rank tests were used. Between-group com-parisons were made by using analyses of covariance with the 1-yr value as the dependent variable and the baseline value as a covariate. All data analyses were two tailed with significance accepted atPⱕ 0.05 and were performed with SAS software (version 9.1.3 for Linux; SAS Institute, Cary, NC). Data are displayed as means⫾SD, andn represents the number of subjects.
RESULTS
Anthropometric data and clinical variables.Anthropometric and clinical data are presented in Table 1. Body weight and BMI decreased in both groups, and these changes were not significantly different between the CR and Ex groups.
Further-more, although not presented here, we have previously re-ported that fat mass decreased significantly and similarly in the CR and Ex groups (20). Mean values for EF and LV mass were in the normal range for healthy middle-aged men and women and did not change in response to either intervention. Both systolic and diastolic BP decreased following weight loss in the CR group but were unchanged in the Ex group. These changes were also significant between groups. Resting HR tended to decrease in both groups; however, these changes were not significant. The resting HR changes in the CR and Ex groups were similar.
Diastolic function: global indexes. Indexes of global dia-stolic function, as determined from transmitral Doppler flow recordings, are presented in Table 2. IVRT decreased similarly and significantly in both groups, whereas E, A, E/A, and DT remained unchanged in response to the interventions. Although neither intervention significantly altered VTIE, there was a
weak tendency for an increase in the CR group, and this change was significantly different from that in the Ex group.
PDF-derived indexes of global diastolic function are also presented in Table 2. In the CR group, the stiffness constant,k, decreased significantly, and there were marginally significant decreases in the damping constant, c, and the peak
atrioven-Table 2. Indexes of LV diastolic function derived from pulsed-Doppler transmitral flow
n Baseline 1 yr %Change PValue, Within-Group Change PValue, Between-Groups Change E, cm/s CR 12 72 (SD 20) 75 (SD 20) 4.9 (SD 17.9) 0.54 0.33 Ex 13 70 (SD 14) 68 (SD 12) ⫺0.3 (SD 15.3) 0.69 A, cm/s CR 12 58 (SD 20) 61 (SD 19) 6.0 (SD 19.6) 0.40 0.42 Ex 13 58 (SD 16) 58 (SD 14) 2.2 (SD 19.0) 0.90 E/A CR 12 1.3 (SD 0.4) 1.3 (SD 0.3) 1.0 (SD 18.9) 0.75 0.69 Ex 13 1.3 (SD 0.4) 1.2 (SD 0.2) ⫺0.3 (SD 18.5) 0.95* DT, ms CR 12 190 (SD 32) 199 (SD 26) 6.1 (SD 13.3) 0.23 0.08 Ex 13 191 (SD 28) 187 (SD 20) ⫺1.4 (SD 8.5) 0.41 VTIE, cm CR 12 10 (SD 4) 11 (SD 3) 12.6 (SD 23.9) 0.15 0.03 Ex 13 9 (SD 2) 9 (SD 2) ⫺0.5 (SD 17.0) 0.67 IVRT, ms CR 12 63 (SD 15) 47 (SD 8) ⫺19.9 (SD 28.3) 0.02 0.71 Ex 11 58 (SD 11) 46 (SD 6) ⫺18.0 (SD 17.7) 0.01 c, g/s CR 11 23.2 (SD 7.9) 17.4 (SD 3.7) ⫺15.5 (SD 39.3) 0.07 0.51 Ex 12 20.8 (SD 4.8) 18.5 (SD 5.5) ⫺9.3 (SD 23.6) 0.16 k, g/s2 CR 11 234 (SD 52) 188 (SD 33) ⫺17.5 (SD 14.9) 0.002* 0.19 Ex 12 207 (SD 36) 195 (SD 42) ⫺5.8 (SD 14.2) 0.23* xo, cm CR 11 10.7 (SD 4.9) 10.0 (SD 3.1) ⫺0.4 (SD 21.9) 0.35 0.48† Ex 12 10.1 (SD 1.7) 8.1 (SD 4.0) ⫺17.4 (SD 39.7) 0.47* kxo, g䡠cm/s2 CR 11 2,530 (SD 1,390) 1,850 (SD 540) ⫺16.5 (SD 27.7) 0.06 0.27 Ex 12 2,090 (SD 460) 1,930 (SD 600) ⫺6.7 (SD 20.4) 0.30 1/2kxo 2, g䡠cm2/s2 CR 11 16,300 (SD 17,500) 9,890 (SD 6,340) ⫺11.9 (SD 48.6) 0.17* 0.39† Ex 12 10,800 (SD 3,840) 9,900 (SD 4,670) ⫺4.9 (SD 35.0) 0.49
Values are means (SD);n, number of subjects. Parameterized diastolic filling (PDF) parameters and computed indexes were not determined for 1 subject in the CR and 1 subject in the Ex group due to inadequate image quality. E, peak E-wave velocity; A, peak A-wave velocity; DT, deceleration time; VTIE,
velocity-time integral of E-wave; IVRT, isovolumic relaxation time;c, chamber relaxation/viscoelasticity;k, chamber stiffness;xo, stored elastic strain;kxo, peak
force in the spring; 1/2kxo
2, stored elastic potential energy. *Pvalue based on Wilcoxon’s signed rank test; †Pvalue based on analysis of covariance (ANCOVA)
tricular pressure gradient,kxo. No such changes in these
PDF-based indexes were seen in the Ex group. Stored elastic strain,
xo, and strain energy at the onset of early filling, 1/2kxo2, did
not change in either group. None of the changes in PDF-derived indexes differed between groups, and it is noteworthy that all of these significant and nonsignificant changes were in the same direction in both groups.
Diastolic function: longitudinal indexes. The conventional and PDF-derived indexes of longitudinal diastolic function that were derived from the motion of the lateral and septal aspects of the mitral annulus are presented in Tables 3 and 4. None of the conventional or PDF-derived indexes of diastolic function that were determined from the lateral aspect of the annulus changed in either group, althoughx⬘otended to increase in the
CR group. In contrast, several longitudinal diastolic function indexes that were computed from the motion of the septal aspect of the mitral annulus improved significantly. In the CR group, E⬘ increased and the E-to-E⬘ ratio, a marker of LV stiffness, decreased. Furthermore, all of the septal PDF-derived indexes of diastolic function improved in the CR group. In the Ex group, none of the conventional diastolic function indexes that were derived from the motion of the septal annulus changed significantly, whereas two of the five PDF-based indexes improved significantly. None of the changes in dia-stolic function that were assessed using the septal annulus differed between the study groups, although the improvement in E⬘tended to be greater in the CR group.
Morphology and systolic function. Morphological measure-ments and indexes of systolic function are presented in Table 5.
Septal wall thickness decreased slightly in the Ex group but was unchanged in the CR group. Furthermore, LV end-dia-stolic volume and stroke volume tended to increase in the Ex group but remained unchanged in the CR group. None of the other measures of LV morphology (end-diastolic diameter, end-systolic diameter, and posterior wall thickness) or systolic function (fractional shortening and end-systolic volume) changed in either group. None of the changes in LV morphol-ogy and systolic function was different between groups.
DISCUSSION
The primary finding of the present study is that LV diastolic function improves with modest weight loss over 12 mo in nonobese, middle-aged men and women without clinical evi-dence of cardiovascular disease. Furthermore, these adapta-tions occurred in response to both CR- and Ex-induced weight loss, although the findings in the CR group tended to be more robust.
Others have also reported that LV diastolic function im-proves with weight loss (1, 10, 11, 27, 31). However, all of these studies were performed on morbidly obese subjects, and all except one (27) used gastric bypass or gastric banding to induce substantial weight loss. The improvements that were reported in these studies included an increase in peak E-wave velocity, a decrease in peak A-wave velocity, an increase in the E-to-A ratio, and a decrease in IVRT (1, 10, 11, 27, 31). Few studies could be found that used DTI to assess the effects of
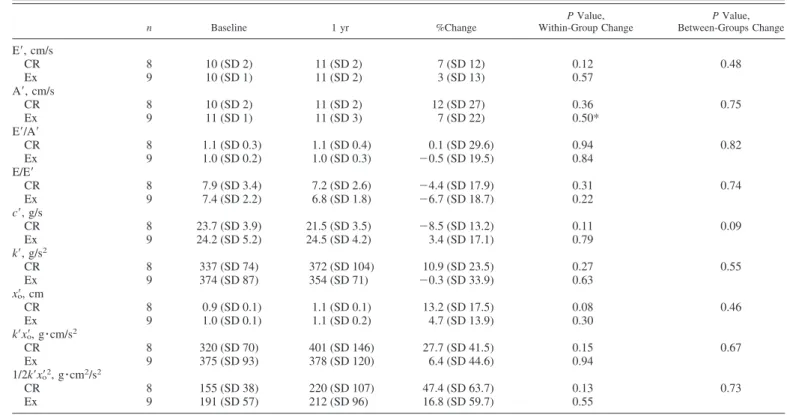
Table 3. Indexes of longitudinal LV diastolic function derived from Doppler tissue imaging of the lateral aspect of the mitral annulus
n Baseline 1 yr %Change PValue, Within-Group Change PValue, Between-Groups Change E⬘, cm/s CR 8 10 (SD 2) 11 (SD 2) 7 (SD 12) 0.12 0.48 Ex 9 10 (SD 1) 11 (SD 2) 3 (SD 13) 0.57 A⬘, cm/s CR 8 10 (SD 2) 11 (SD 2) 12 (SD 27) 0.36 0.75 Ex 9 11 (SD 1) 11 (SD 3) 7 (SD 22) 0.50* E⬘/A⬘ CR 8 1.1 (SD 0.3) 1.1 (SD 0.4) 0.1 (SD 29.6) 0.94 0.82 Ex 9 1.0 (SD 0.2) 1.0 (SD 0.3) ⫺0.5 (SD 19.5) 0.84 E/E⬘ CR 8 7.9 (SD 3.4) 7.2 (SD 2.6) ⫺4.4 (SD 17.9) 0.31 0.74 Ex 9 7.4 (SD 2.2) 6.8 (SD 1.8) ⫺6.7 (SD 18.7) 0.22 c⬘, g/s CR 8 23.7 (SD 3.9) 21.5 (SD 3.5) ⫺8.5 (SD 13.2) 0.11 0.09 Ex 9 24.2 (SD 5.2) 24.5 (SD 4.2) 3.4 (SD 17.1) 0.79 k⬘, g/s2 CR 8 337 (SD 74) 372 (SD 104) 10.9 (SD 23.5) 0.27 0.55 Ex 9 374 (SD 87) 354 (SD 71) ⫺0.3 (SD 33.9) 0.63 x⬘o, cm CR 8 0.9 (SD 0.1) 1.1 (SD 0.1) 13.2 (SD 17.5) 0.08 0.46 Ex 9 1.0 (SD 0.1) 1.1 (SD 0.2) 4.7 (SD 13.9) 0.30 k⬘x⬘o, g䡠cm/s2 CR 8 320 (SD 70) 401 (SD 146) 27.7 (SD 41.5) 0.15 0.67 Ex 9 375 (SD 93) 378 (SD 120) 6.4 (SD 44.6) 0.94 1/2k⬘x⬘o2, g䡠cm2/s2 CR 8 155 (SD 38) 220 (SD 107) 47.4 (SD 63.7) 0.13 0.73 Ex 9 191 (SD 57) 212 (SD 96) 16.8 (SD 59.7) 0.55
Values are means (SD);n, number of subjects. Diastolic filling parameters and computed indexes were not determined for 1 subject in the CR and 1 subject in the Ex group due to inadequate image quality. E⬘and A⬘, peak early and late mitral annular velocity, respectively;c⬘, longitudinal damping constant (i.e., longitudinal relaxation/viscosity);k⬘, longitudinal spring constant (i.e., longitudinal stiffness);x⬘o, stored longitudinal elastic strain;k⬘x⬘o, peak longitudinal force;
weight loss on diastolic function and none that used PDF-based analyses.
The PDF-based analyses that were performed in the present study provide additional measures of diastolic function but, more importantly, allow insight into the physiological adapta-tions that are responsible for the observed changes in diastolic function. In the CR group, in addition to the decrease in IVRT after weight loss, global stiffness (k) decreased significantly and there was a marginally significant decrease in global relaxation/viscoelasticity (c). Taken together, these findings suggest that CR-induced weight loss promotes a favorable remodeling of the myocardium and extracellular matrix with the effect of reducing viscous losses and increasing compliance during early filling. These results support the findings from a cross-sectional study (17) in which stiffness and damping decreased in very lean subjects who practiced long-term CR compared with control subjects with high-normal or over-weight BMIs and also corroborate those from a study on rabbits, in which normal-weight control rabbits had greater diastolic compliance than rabbits that were made obese via a high-fat diet (3). The CR group in the present study also exhibited a marginally significant decrease in the global peak atrioventricular pressure gradient (kxo), which suggests that LV
suction during early filling increased. This effect may be attributed to reduced viscous losses associated with diastolic recoil and would likely translate to lower left atrial pressure during ventricular diastole.
CR had no apparent effect on any of the longitudinal PDF-derived parameters that were determined from the motion of the lateral aspect of the mitral annulus. However, several changes were evident in the parameters derived from the
motion of the septal annulus. Septal longitudinal elastic strain (x⬘o) and stored strain energy (1/2k⬘x⬘o2) increased significantly
in the CR group, which suggests an increased longitudinal accommodation of the volume entering the LV during early filling (septal E⬘also increased). Increases in septal longitudi-nal stiffness (k⬘) and stored longitudinal force (k⬘x⬘o) were also
observed in the CR group. It is unclear why changes were found in septal DTI parameters but not the same lateral DTI parameters. Kasner et al. (12) reported a discrepancy between lateral and septal DTI indexes in subjects with heart failure (in the presence of a normal EF) versus control subjects without heart failure, although in their study, only the lateral indexes differed significantly. Due to the different subject populations, it may not be appropriate to extend the findings of Kasner et al. (12) to our subject population, but it is of interest that the Kasner study at least demonstrates that the motion of one aspect of the mitral annulus can change significantly without a statistically significant change in the motion of other aspects, as was observed in the present study. Furthermore, it is en-couraging that the lateral and septal parameters and indexes in both the Kasner study (12) and the present study generally changed in the same direction, although significantly for just one aspect. Unfortunately, Kasner et al. (12) do not posit an explanation for their findings. It is possible that changes in right ventricular (RV) diastolic function concomitant with changes in LV diastolic function may have resulted in signif-icant alterations in septal parameters and indexes in this study, but because we did not measure RV function, we can only speculate that RV function played a role.
The underlying mechanism for the increases in septal lon-gitudinal stiffness (k⬘) and stored longitudinal force (k⬘x⬘o) in
Table 4. Indexes of longitudinal LV diastolic function derived from Doppler tissue imaging of the septal aspect of the mitral annulus
n Baseline 1 yr %Change PValue, Within-Group Change PValue, Between-Groups Change E⬘, cm/s CR 8 8 (SD 1) 10 (SD 1) 17.3 (SD 11.2) 0.002 0.10 Ex 9 8 (SD 1) 9 (SD 1) 5.5 (SD 14.6) 0.35 A⬘, cm/s CR 8 10 (SD 2) 11 (SD 2) 5.7 (SD 23.5) 0.80 0.64 Ex 9 11 (SD 2) 11 (SD 2) 2.0 (SD 11.6) 0.66 E⬘/A⬘ CR 8 0.8 (SD 0.2) 0.9 (SD 0.2) 16.1 (SD 28.0) 0.15 0.29 Ex 9 0.8 (SD 0.1) 0.8 (SD 0.2) 5.4 (SD 22.3) 0.63 E/E⬘ CR 8 9.7 (SD 3.9) 8.0 (SD 2.5) ⫺13.0 (SD 17.3) 0.04 0.52 Ex 9 8.9 (SD 1.8) 8.0 (SD 1.9) ⫺8.0 (SD 22.6) 0.21 c⬘, g/s CR 8 20.5 (SD 5.7) 22.2 (SD 6.3) 17.3 (SD 54.7) 0.59 0.63 Ex 9 18.0 (SD 2.5) 20.9 (SD 5.0) 18.0 (SD 31.2) 0.20 k⬘, g/s2 CR 8 263 (SD 37) 324 (SD 37) 25.7 (SD 24.6) 0.02 0.13 Ex 9 283 (SD 42) 286 (SD 53) 3.1 (SD 24.2) 0.87 x⬘o, cm CR 8 0.9 (SD 0.1) 1.1 (SD 0.1) 15.3 (SD 13.3) 0.01 0.93 Ex 9 0.9 (SD 0.1) 1.1 (SD 0.1) 13.8 (SD 14.0) 0.02 k⬘x⬘o, g䡠cm/s2 CR 8 244 (SD 45) 343 (SD 55) 45.5 (SD 38.6) 0.01 0.17 Ex 9 264 (SD 45) 302 (SD 51) 16.9 (SD 28.1) 0.13 1/2k⬘x⬘o2, g䡠cm2/s2 CR 8 116 (SD 32) 186 (SD 43) 71.4 (SD 60.6) 0.01 0.23 Ex 9 127 (SD 31) 162 (SD 36) 33.5 (SD 38.8) 0.04
Values are means (SD);n, number of subjects. PDF parameters and computed indexes were not determined for 1 subject in the CR and 1 subject in the Ex group due to inadequate image quality.
conjunction with the decreases in global stiffness (k) and stored force (kxo) is also unclear, although the decreased global
stiffness following diet-induced weight loss indicates that the analogous stiffness in alternative spatial modes must overcom-pensate for its increase in the longitudinal dimension by de-creasing substantially. More specifically, if radial/azimuthal LV stiffness decreased to a greater extent than longitudinal LV stiffness increased, global LV stiffness would decrease. This interrelationship can be understood by viewing longitudinal and radial/meridional stiffness as summing in parallel to yield global stiffness (i.e., 1/k⫽1/klong⬘ ⫹1/krad⬘ ), since longitudinal
and radial motion occur essentially simultaneously during filling (24). Thus it is conceivable that cardiac remodeling concomitant with the observed reduction in LV mass, includ-ing changes in fiber orientation, as the result of CR could have the effect of increasing longitudinal LV stiffness while reduc-ing global LV stiffness. However, we caution that since we don’t have the data to substantiate this explanation, it should, therefore, be considered speculative at this time.
The Ex group also demonstrated improvements in diastolic function, as evidenced by the decrease in IVRT. The physio-logical adaptations that contributed to this improvement are unclear, since no changes were seen in PDF parameters derived from transmitral flow. However, septal longitudinal elastic strain (x⬘o) and stored strain energy (1/2k⬘x⬘o2) increased
signif-icantly, suggesting that a longitudinal accommodation of the blood volume entering the LV during early filling increased in response to Ex-induced weight loss.
Endurance exercise training typically increases resting end-diastolic volume, resting stroke volume, and LV mass (25). However, in the present study, although there were tendencies for increases in LV end-diastolic dimension and volume and
stroke volume, these changes were not statistically significant. Furthermore, there was no evidence for an increase in LV mass. It is possible that the increases in LV dimensions and mass that usually occur in response to Ex training were attenuated by the energy deficit that was induced by the Ex intervention in the present study. However, as reported previ-ously (30), the Ex group had highly significant 16% and 28% increases in absolute and relative maximal oxygen uptake, respectively. Although these improvements may have resulted from peripheral adaptations such as an increase in skeletal muscle mitochondrial density, training-induced increases in maximal oxygen uptake are also dependent on cardiac adapta-tions (19). Therefore, it seems unlikely that myocardial adap-tations to Ex training were completely absent in the Ex group, although we do not have data to support this proposition.
Although not unexpected, the significant decrease in systolic and diastolic BP in the CR group contrasts with the findings of Fontana et al. (6) in a previous CALERIE report from the same study, in which BP changes fell short of statistical significance. This discrepancy is likely due to the exclusion of subjects who did not satisfy the defined minimum weight loss requirement in the present study.
The significant decrease in IVRT following weight loss in each group may be thought to stem from decreased BP at aortic valve closure (which is linearly related to systolic BP) (28). However, LV relaxation and left atrial pressure have also been shown to govern IVRT (28). Given that the Ex group exhibited a similar decrease in IVRT as the CR group in the presence of an unchanged systolic BP, it appears likely that intrinsic LV relaxation improved as the result of weight loss. Although not directly measured, left atrial pressure at mitral valve opening would be expected to have decreased or remained unchanged Table 5. LV morphology and indexes of systolic function
n Baseline 1 yr %Change PValue, Within-Group Change PValue, Between-Groups Change IVS, mm CR 12 9 (SD 2) 9 (SD 3) 0.1 (SD 18.1) 0.97 0.15 Ex 11 9 (SD 1) 8 (SD 1) ⫺9.5 (SD 11.8) 0.01 LVEDD, mm CR 12 49 (SD 5) 51 (SD 4) 5.0 (SD 9.0) 0.08 0.55 Ex 11 50 (SD 6) 51 (SD 7) 2.4 (SD 5.0) 0.15 LVESD, mm CR 12 30 (SD 4) 31 (SD 3) 5.3 (SD 12.5) 0.24 0.61* Ex 11 31 (SD 5) 31 (SD 6) 2.0 (SD 10.5) 0.60 PW, mm CR 12 8 (SD 1) 8 (SD 1) 1.7 (SD 17.3) 0.94 0.93 Ex 11 9 (SD 2) 8 (SD 1) ⫺4.6 (SD 19.8) 0.29 FS, % CR 12 39 (SD 4) 39 (SD 4) 0.6 (SD 9.9) 1.00 0.97 Ex 11 39 (SD 5) 39 (SD 5) 1.7 (SD 12.6) 0.76 LVEDV, ml CR 12 108 (SD 23) 118 (SD 20) 11.1 (SD 19.6) 0.07 0.64 Ex 11 112 (SD 24) 118 (SD 31) 5.2 (SD 10.4) 0.15 LVESV, ml CR 12 33 (SD 10) 36 (SD 7) 12.7 (SD 27.4) 0.28 0.57* Ex 11 36 (SD 12) 37 (SD 14) 4.7 (SD 20.8) 0.57 SV, ml CR 12 75 (SD 14) 82 (SD 15) 11.1 (SD 19.4) 0.06 0.61 Ex 11 76 (SD 15) 81 (SD 19) 6.0 (SD 10.1) 0.09
Values are means (SD);n, number of subjects. Two subjects in the Ex group were not analyzed due to technical difficulties in acquiring M-mode images for these subjects. IVS, interventricular septum thickness; LVEDD, LV end-diastolic diameter; LVESD, LV end-systolic diameter; PW, posterior wall thickness; FS, fractional shortening; LVEDV, LV end-diastolic volume; LVESV, LV end-systolic volume; SV, stroke volume. *Pvalue based on ANCOVA using ranks of the raw data.
following weight loss, as evidenced by the tendency for the atrioventricular pressure gradient kxo to decrease.
Further-more, for the⬃8% fall in systolic BP in the CR group after weight loss and assuming normal left atrial pressures at the mitral valve opening, IVRT would be expected to fall by only 3% according to the model of isovolumic pressure decline proposed by Thomas et al. (28), which contrasts greatly with the nearly 20% decline in IVRT reported for these subjects.
The results from the present study are important in the context of healthy aging of the heart. Although none of the participants had clinical diastolic dysfunction, greater stiffness and prolonged relaxation of the LV are known to occur as part of the natural aging process (4). Therefore, the improvements in diastolic function that occurred in response to CR- and Ex-induced weight loss may be viewed as a reversal of this trend or, alternatively, as the restoration of a more youthful cardiac phenotype. Furthermore, these beneficial adaptations may reduce the risk of developing diastolic dysfunction in the future.
Limitations.The fact that there were no differences for both groups from baseline to 1 yr in many of the diastolic function parameters and indexes measured may imply that the methods employed in this study were not sufficiently sensitive to detect such changes. In particular, if diastolic function was studied in all subjects under a state of cardiac stress, such as after the administration of dobutamine or during exercise, changes in certain parameters and indexes may well have been found. In other words, the diastolic function of the hearts of CR and Ex subjects may have been similar at rest but potentially differ-entiable during exercise.
Another limitation of the study is that the intensive yearlong interventions prevented us from enrolling a large number of subjects. Due to this small sample size and the relatively high variability of M-mode measurements (vs. 3-dimensional echo, magnetic resonance imaging, and other more sophisticated imaging modalities), the nonsignificant between-group com-parisons should be interpreted with caution, since the statistical power was low for determining whether CR- or Ex-induced weight loss provides a greater improvement in diastolic func-tion. Furthermore, because our goal was to characterize the changes in diastolic function that result from weight loss, we did not include subjects who were noncompliant with our interventions and, consequently, did not lose weight; however, this also limits the generalizability of the results, since we did not use intention-to-treat analyses.
Despite these limitations, we note that a strength of this study, besides its characterization of the effects of moderate weight loss on diastolic function in nonobese subjects, is that it comprises a long-term intervention rather than a cross-sec-tional comparison of lean and overweight individuals, as has been previously performed in our laboratory (17). Another strength is that DTI- and PDF-derived indexes of diastolic function, in both global (E-wave) and spatially distinct (longi-tudinal function via DTI) terms, were used to confirm and further characterize the results obtained from the conventional transmitral flow-based assessment.
Conclusions. Results from the present study suggest that moderate weight loss, whether induced by CR or Ex, confers significant improvements in LV diastolic function. In response to CR, the improvements appear to be mediated primarily by
decreases on (global) ventricular stiffness and relaxation/vis-cosity and an increase in the peak atrioventricular pressure gradient, whereas in response to Ex-induced weight loss, the mechanisms are less clear. Future studies should examine diastolic function by utilizing a newly validated load-indepen-dent index of DF (26) during stress in subjects undergoing CR and exercisers to determine whether improvements in diastolic function via weight loss that are not detectable in the resting state are apparent during stress.
GRANTS
This work was supported by National Institutes of Health (NIH) Grant AG-20487 and NIH Grants RR-00036 (General Clinical Research Center), HL-54179, and HL-04023. T. E. Meyer and E. P. Weiss were supported by NIH Grant AG-00078. Additional support was provided by the Whitaker Foundation (Roslyn, VA), the Alan A. and Edith L. Wolff Charitable Trust (St. Louis, MO), and the Barnes-Jewish Hospital Foundation (St. Louis, MO). REFERENCES
1. Alpert MA, Lambert CR, Terry BE, Cohen MV, Mulekar M, Massey CV, Hashimi MW, Panayiotou H, Mukerji V.Effect of weight loss on left ventricular diastolic filling in morbid obesity. Am J Cardiol 76: 1198 –1201, 1995.
2. Bauman L, Chung CS, Karamanoglu M, Kova´cs SJ.The peak atrio-ventricular pressure gradient to transmitral flow relation: kinematic model prediction with in vivo validation.J Am Soc Echocardiogr17: 839 – 844, 2004.
3. Carroll JF, Summers RL, Dzielak DJ, Cockrell K, Montani JP, Mizelle HL.Diastolic compliance is reduced in obese rabbits. Hyperten-sion33: 811– 815, 1999.
4. Cheitlin MD. Cardiovascular physiology— changes with aging. Am J Geriatr Cardiol12: 9 –13, 2003.
5. Devereux RB, Reichek N.Echocardiographic determination of left ven-tricular mass in man. Anatomic validation of the method.Circulation55: 613– 618, 1977.
6. Fontana L, Villareal DT, Weiss EP, Racette SB, Steger-May K, Klein S, Holloszy JO, Washington University School of Medicine CALERIE Group.Calorie restriction or exercise: effects on coronary heart disease risk factors. A randomized, controlled trial. Am J Physiol Endocrinol Metab293: E197–E202, 2007.
7. Gottdiener JS, Bednarz J, Devereux R, Gardin J, Klein A, Manning WJ, Morehead A, Kitzman D, Oh J, Quinones M, Schiller NB, Stein JH, Weissman NJ.American Society of Echocardiography recommen-dations for use of echocardiography in clinical trials.J Am Soc Echocar-diogr17: 1086 –1119, 2004.
8. Hall AF, Kova´cs SJ.Automated method for characterization of diastolic transmitral Doppler velocity contours: early rapid filling.Ultrasound Med Biol20: 107–116, 1994.
9. Ho CY, Solomon SD. A clinician’s guide to tissue Doppler imaging. Circulation113: e396 – e398, 2006.
10. Kanoupakis E, Michaloudis D, Fraidakis O, Parthenakis F, Vardas P, Melissas J.Left ventricular function and cardiopulmonary performance following surgical treatment of morbid obesity.Obes Surg11: 552–558, 2001.
11. Karason K, Wallentin I, Larsson B, Sjostrom L.Effects of obesity and weight loss on cardiac function and valvular performance.Obes Res6: 422– 429, 1998.
12. Kasner M, Westermann D, Steendijk P, Gaub R, Wilkenshoff U, Weitmann K, Hoffmann W, Poller W, Schultheiss HP, Pauschinger M, Tschope C.Utility of Doppler echocardiography and tissue Doppler imaging in the estimation of diastolic function in heart failure with normal ejection fraction: a comparative Doppler-conductance catheterization study.Circulation116: 637– 647, 2007.
13. Kass DA, Bronzwaer JG, Paulus WJ. What mechanisms underlie diastolic dysfunction in heart failure?Circ Res94: 1533–1542, 2004. 13a.Kova´cs SJ, Rosado J, Manson McGuire AL, Hall AF.Can trasmitral
Doppler E-waves differentiate hypertensive hearts from normal? Hyper-tension30: 788 –795, 1997.
14. Kova´cs SJ, Barzilai B, Perez JE.Evaluation of diastolic function with Doppler echocardiography: the PDF formalism.Am J Physiol Heart Circ Physiol252: H178 –H187, 1987.
16. Marfella R, Esposito K, Siniscalchi M, Cacciapuoti F, Giugliano F, Labriola D, Ciotola M, Di Palo C, Misso L, Giugliano D.Effect of weight loss on cardiac synchronization and proinflammatory cytokines in premenopausal obese women.Diabetes Care27: 47–52, 2004. 17. Meyer TE, Kova´cs SJ, Ehsani AA, Klein S, Holloszy JO, Fontana L.
Long-term caloric restriction ameliorates the decline in diastolic function in humans.J Am Coll Cardiol47: 398 – 402, 2006.
18. Nagueh SF, Mikati I, Kopelen HA, Middleton KJ, Quinones MA, Zoghbi WA.Doppler estimation of left ventricular filling pressure in sinus tachycardia. A new application of tissue Doppler imaging.Circulation98: 1644 –1650, 1998.
19. Ogawa T, Spina RJ, Martin WH 3rd, Kohrt WM, Schechtman KB, Holloszy JO, Ehsani AA. Effects of aging, sex, and physical training on cardiovascular responses to exercise.Circulation86: 494–503, 1992. 20. Racette SB, Weiss EP, Villareal DT, Arif H, Steger-May K,
Schecht-man KB, Fontana L, Klein S, Holloszy JO, Washington University School of Medicine CALERIE Group.One year of caloric restriction in humans: feasibility and effects on body composition and abdominal adipose tissue.J Gerontol A Biol Sci Med Sci61: 943–950, 2006. 21. Rich MW, Stitziel NO, Kova´cs SJ.Prognostic value of diastolic filling
parameters derived using a novel image processing technique in patients ⱖ70 years of age with congestive heart failure.Am J Cardiol84: 82– 86, 1999.
22. Riordan MM, Chung CS, Kova´cs SJ.Diabetes and diastolic function: stiffness and relaxation from transmitral flow.Ultrasound Med Biol31: 1589 –1596, 2005.
23. Riordan MM, Kova´cs SJ.Quantitation of mitral annular oscillations and longitudinal “ringing” of the left ventricle: a new window into longitudinal diastolic function.J Appl Physiol100: 112–119, 2006.
24. Riordan MM, Kova´cs SJ.Stiffness- and relaxation-based quantitation of radial left ventricular oscillations: elucidation of regional diastolic func-tion mechanisms.J Appl Physiol102: 1862–1870, 2007.
25. Scharhag J, Schneider G, Urhausen A, Rochette V, Kramann B, Kindermann W.Athlete’s heart: right and left ventricular mass and function in male endurance athletes and untrained individuals deter-mined by magnetic resonance imaging.J Am Coll Cardiol40: 1856 – 1863, 2002.
26. Shmuylovich L, Kova´cs SJ.Load-independent index of diastolic filling: model-based derivation with in vivo validation in control and diastolic dysfunction subjects.J Appl Physiol101: 92–101, 2006.
27. Sido Z, Jako P, Pavlik G. The effect of moderate weight loss on echocardiographic parameters in obese female patients.Acta Physiol Hung 87: 241–251, 2000.
28. Thomas JD, Flachskampf FA, Chen C, Guererro JL, Picard MH, Levine RA, Weyman AE.Isovolumic relaxation time varies predictably with its time constant and aortic and left atrial pressures: implications for the noninvasive evaluation of ventricular relaxation. Am Heart J124: 1305–1313, 1992.
29. Weiss EP, Racette SB, Villareal DT, Fontana L, Steger-May K, Schechtman KB, Klein S, Holloszy JO.Improvements in glucose toler-ance and insulin action induced by increasing energy expenditure or decreasing energy intake: a randomized controlled trial.Am J Clin Nutr 84: 1033–1042, 2006.
30. Weiss EP, Racette SB, Villareal DT, Fontana L, Steger-May K, Schechtman KB, Klein S, Ehsani AA, Holloszy JO.Lower extremity muscle size and strength and aerobic capacity decrease with caloric restriction but not with exercise-induced weight loss.J Appl Physiol102: 634 – 640, 2007.
31. Willens HJ, Chakko SC, Byers P, Chirinos JA, Labrador E, Castrillon JC, Lowery MH.Effects of weight loss after gastric bypass on right and left ventricular function assessed by tissue Doppler imaging.Am J Cardiol 95: 1521–1524, 2005.
32. Wong CY, OⴕMoore-Sullivan T, Leano R, Byrne N, Beller E, Marwick TH.Alterations of left ventricular myocardial characteristics associated with obesity.Circulation110: 3081–3087, 2004.