University of Rhode Island
DigitalCommons@URI
Human Development and Family Studies FacultyPublications Human Development and Family Studies
2015
Age Differences in Consumer Financial Capability
Jing Jian Xiao
University of Rhode Island, [email protected] Cheng Chen
See next page for additional authors
Follow this and additional works at:https://digitalcommons.uri.edu/hdf_facpubs
The University of Rhode Island Faculty have made this article openly available. Please let us knowhow Open Access to this research benefits you.
This is a pre-publication author manuscript of the final, published article. Terms of Use
This article is made available under the terms and conditions applicable towards Open Access Policy Articles, as set forth in ourTerms of Use.
This Article is brought to you for free and open access by the Human Development and Family Studies at DigitalCommons@URI. It has been accepted for inclusion in Human Development and Family Studies Faculty Publications by an authorized administrator of DigitalCommons@URI. For more information, please [email protected].
Citation/Publisher Attribution
Xiao, J. J., Chen, C. and Sun, L. (2015), Age differences in consumer financial capability. International Journal of Consumer Studies, 39: 387-395. doi: 10.1111/ijcs.12205
Authors
AGE DIFFERENCES IN CONSUMER FINANCIAL CAPABILITY Jing Jian Xiao,1 Cheng Chen, Lei Sun
ABSTRACT
The purpose of this study is to examine age differences in financial capability. Financial capability is measured by five variables: objective financial literacy, subjective financial
literacy, desirable financial behavior, perceived financial capability, and a financial capability index. Financial capability is expected to increase with age. Specifically, we expect older consumers to demonstrate higher levels of both objective and subjective financial literacy, more desirable financial behaviors, a higher level of perceived financial capability, and a higher score on the financial capability index. Data from the 2012 National Financial Capability Study in the U.S. was used to examine the associations between age groups and financial capability variables. One-way ANOVAs were used to examine age differences in financial capability variables. Then multiple regressions were used to examine age differences after controlling for socio-demographic and financial variables. The results indicated that age differences in four financial capability variables showed similar patterns. Young adults aged 18-24 had the lowest scores on objective financial literacy, subjective financial literacy, perceived financial capability, and the financial capability index. The results have implications for consumer educators to provide effective financial education for all age groups.
1
Correspondence to: Jing Jian Xiao, Department of Human Development and Family Studies, University of Rhode Island, Kingston, RI 02881; [email protected].
INTRODUCTION
In recent years, a social movement promoting financial capability among consumers first emerged in developed countries and then in developing countries. In the U.S., the movement is actively promoted by the President’s Advisory Council on Financial Capability (PACFC, 2013). Many governmental and nongovernmental organizations work together to promote financial literacy and capability among American consumers (Fox and Bartholomae, 2008). In Europe, many countries have national initiatives to measure and improve consumer financial capability (see a description in Taylor, 2011). In 2006, the UK launched the national survey on financial capability (Atkinson et al., 2006), which was the first of this type
worldwide. Later, many countries such as Austria (Fessler et al., 2007), Ireland (O’Donnell and Keeney, 2009), the U.S. (FINRAIEF, 2009), and Canada (Arrowsmith and Pignal, 2010) followed suit and conducted similar surveys.
The financial capability movement is motivated by the current weakening of the government-managed economic safety net, which requires more individual responsibility for long-term economic security such as retirement security. For example, in the U.S., the
traditional retirement income source is the Social Security system, but it will be underfunded in the coming years. Company-sponsored pension systems are also changing from mainly defined benefit retirement plans to mainly defined contribution retirement plans (Hanna and Chen, 2008; Campbell et al., 2011). These trends suggest that ordinary consumers should worry about their long-term economic security and start to manage their retirement savings in the early years of their working careers. Financial education may have limitations but still has potential to help change consumer financial behaviors to improve financial well-being
(Collins and O'Rourke, 2010). Financial education for youth may have profound impacts on individual and societal well-being (Tennyson and Nguyen, 2001; Hira, 2012; Lusardi and Mitchell, 2014).
Financial capability refers to people’s ability to manage and take control of their finances (Taylor, 2011). Financial capability can be demonstrated by a certain level of financial literacy and performance of desirable financial behaviors. Therefore, financial literacy and financial behavior are closely related to financial capability. In the emerging literature on financial capability, researchers have used three types of measures for financial capability—a set of financial behavior measures (Atkinson et al., 2006), a mix of behavior and outcome measures (Taylor, 2011), and a set of comprehensive measures that include financial literacy, financial behavior, and perceived financial capability (Xiao et al., 2014b). The purpose of this study is to examine age differences in financial capability using a set of comprehensive measures. The approach used in this study is similar to that of Xiao et al. (2014b).
Research on financial literacy has been conducted extensively (Huston, 2010;
Schmeiser and Seligman, 2013). Researchers have studied consumer behaviors from different perspectives (Mayer et al., 2011; Hira, 2012; Eccles et al., 2013). However, little research has examined consumer financial capability by using both financial literacy and financial behavior variables. Little research has focused on perceived financial capability. This study contributes to the literature on financial capability by exploring age differences in multiple measures of financial capability, including objective financial literacy, subjective financial literacy,
The findings will provide helpful information for consumer educators to develop and deliver effective financial education for all age groups of consumers.
THEORETICAL FRAMEWORK AND HYPOTHESES
The traditional life cycle hypothesis assumes that consumers are rational and strive to maximize the life cycle utility to smoothen their consumption over the lifespan (Modigliani, 1986; Hanna and Chen, 2008). Incorporating advances of modern psychological research, economists have developed behavioral life cycle models to more accurately describe consumer life cycle consumption and saving behaviors, such as the hyperbolic model (Angeletos et al., 2001; Laibson, 1997). According to this model, consumers have dual personalities, acting impatiently in the short term but patiently in the long term. Over the lifespan, finance becomes more complicated through consuming, borrowing, and saving as consumers age. During the same time, we assume that individuals’ financial capability also increases through formal or informal financial education and learning from real world financial life by engaging in more financial activities.
Financial capability can be measured in a variety of ways (Atkinson et al., 2006; Taylor, 2011). In this study, we measure financial capability in three dimensions: financial literacy, financial behavior, and perceived financial capability (Xiao et al. 2014b).
Financial literacy is assumed to be closely related to financial capability (Lusardi 2011). A higher level of financial capability is related to not only knowing financial knowledge, but also applying financial knowledge (Huston 2010). Previous research focused on the
determinants of financial literacy such as wealth (Monticone 2010), gender (Fonseca et al., 2012), early schooling (Herd et al., 2012) and technological intervention (Servon and Kaestner,
2008). Researchers also examined potential effects of financial literacy on borrowing behavior (Huston, 2012; Sevim et al., 2012), saving behavior (Huang et al., 2013), inflation expectations (Bruine de Bruin et al., 2010), and financial behavior (Xiao et al., 2014a). Some researchers examined measuring issues of financial literacy, such as its conceptual definition (Remund, 2010), validation of the measures (Knoll and Houts, 2012), its relevance to product design (West, 2012), and consumer ability to correctly answer financial quiz questions (Schmeiser and Seligman, 2013). Researchers also examined financial educators’ teaching strategies (Taylor et al., 2012), discussed how to develop a financial literacy component in a liberal art curriculum (Crain and Ragan, 2012), and conducted international comparative studies on financial literacy (Nicolini et al., 2013).
Financial literacy can be categorized as objective or subjective. Objective financial literary refers to consumers’ actual financial knowledge, usually measured by scores of financial quizzes. Subjective financial literacy is the financial knowledge level self-evaluated by consumers themselves. Both objective and subjective financial literacy factors were used to predict financial behavior (Robb and Woodyard, 2011; Xiao et al., 2011; Allgood and Walstad, 2013).
Lusardi et al. (2010) developed a theoretical model of retirement saving behavior that considers the role of financial literacy. Their model predicts that financial knowledge
increases with age until a person reaches 65 years and then declines. Empirical research showed that among three age groups (18-34, 35-54, 55 or older), the oldest group had the highest score on objective financial literacy (FINRAIEF 2013). No previous research was found to focus on subjective financial literacy among older consumers. However, a study focusing
on older consumers found that, among consumers older than 60 years, objective financial literacy may decline but financial confidence never does (Finke et al. 2011). If confidence increases with age, then we assume that subjective financial literacy should also increase with age. Because financial literacy can be learned and accumulated from both educational and real-world-life settings and this study examines financial capability over the lifespan instead of the later part of life, we expect both objective and subjective financial literacy levels to be positively associated with age and, therefore, propose the following hypotheses:
H1. The level of objective financial literacy increases with age. H2. The level of subjective financial literacy increases with age.
Financial behavior refers to human behavior relevant to money management (Xiao 2008). In the context of financial capability, higher financial capability is associated with more desirable financial behaviors. As mentioned earlier, some researchers used desirable financial behaviors as proxy variables for financial capability (e.g., Atkinson et al., 2006). Higher
financial capability should be associated with desirable or positive financial behaviors.
Consumers demonstrate diverse financial behaviors when their resource levels vary (Eccles et al., 2013) and they are responsive to the 2007-09 financial crisis by changing behaviors (Van Der Cruijsen et al., 2012).
Desirable financial behavior may contribute to financial well-being. Previous research indicated desirable financial behaviors are associated with positive financial outcomes (Xiao et al., 2009; Dew and Xiao, 2011; Xiao et al., 2014b). For example, calculating retirement needs may result in higher retirement savings (Mayer et al. 2011). Additionally, a study of credit counseling clients found that age is positively associated with the number of desirable
financial behaviors (Xiao et al. 2006). We assume consumers are financially capable demonstrated by increasing desirable financial behaviors as they age. The following hypothesis is proposed:
H3. The number of desirable financial behaviors increases with age.
Perceived financial capability can be considered as financial self-efficacy. Self-efficacy is an important psychological factor that influences human behaviors. Albert Bandura, the originator of this important concept, explained, “perceived self-efficacy is concerned with judgments of how well one can execute courses of action required to deal with prospective situations” (Bandura, 1982, p122). Self-efficacy is incorporated into the theory of planned behavior as an important determinant of human behavior, perceived control (Ajzen, 1991). The concept is also used in the transtheoretical model of behavior change (TTM) as an indicator measuring behavior change progress (Prochaska et al., 1992). Self-efficacy is also called confidence in the research literature. In the domain of consumer finance, financial self-efficacy is an important indicator of financial capability. As consumers age, their actual financial capability should increase alongside their more complicated financial lives, resulting in an increase in their perceived financial self-efficacy or confidence. Previous research has showed that consumer financial confidence did not decline among consumers aged 60-85 years old (Finke et al. 2011). We then propose the following hypothesis:
H4. The level of perceived financial capability increases with age.
If objective financial literacy, subjective financial literacy, desirable financial behavior, and perceived financial capability contribute to true financial capability, then a composite measure that sums the scores of the aforementioned variables should be able to represent
true financial capability. Using a score to represent financial capability is also used in previous research (Atkinson et al. 2006; Taylor 2011). A financial capability index should have a
positive association with age. Thus, the following hypothesis is proposed: H5. The level of the financial capability index increases with age.
METHOD Data
Data used in this study were from the U. S. 2012 National Financial Capability Study (FINRAIEF 2013). In consultation with the U.S. Department of the Treasury and the President’s Advisory Council on Financial Literacy, the FINRA Investor Education Foundation
commissioned this national study of the financial capability of American adults in 2012. The study included 25,509 American adults (roughly 500 per state, plus the District of Columbia) and 1,000 military service members through online surveys. The data set is available for public use from the website of the FINRA Investor Education Foundation. For the current study, observations with responses of “don’t know” and “prefer not to say” for two
perception variables, perceived financial capability and perceived financial knowledge, were excluded in the analyses. The sample size used in this study was 24,395.
Variables
The dependent variables were five financial capability related variables: objective financial literacy, subjective financial literacy, desirable financial behaviors, perceived financial capability, and the financial capability index (a sum of scores of the former four variables). Independent variables included the focal variable, age group, and a set of socio-demographic and financial variables. Six age groups were used in the analyses. In the
regression analyses, the youngest age group (aged 18-24) was used as the reference group. See Table 1 for more details about the variable specifications.
Data Analyses
Correlation analyses were conducted between the five financial capability variables for preliminary examinations. One-way ANOVAs were then employed to examine age differences in financial capability variables. Finally, multiple OLS regressions were used to examine age differences after adding control variables. Both weighted and unweighted samples were used in bivariate and multivariate analyses and the results were similar. Both approaches were reasonable in data analyses (Lindamood et al., 2007). For reasons of space saving,
unweighted results are presented here and weighted results are available upon request. RESULTS
Descriptive Statistics
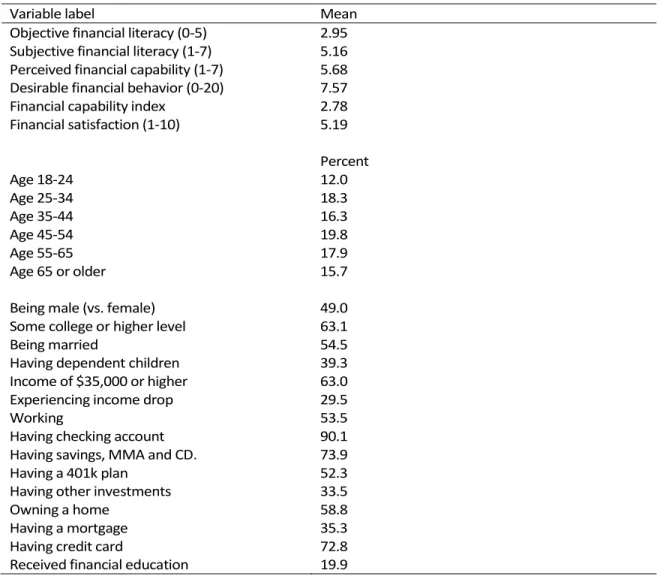
Table 2 presents descriptive statistics of variables used in this study based on the weighted sample. Among the five financial capability variables, the mean of objective
financial literacy was 2.95 based on a range of 0-5. On the 1-7 scale, the mean for subjective financial literacy was 5.16 and the mean for perceived financial capability was 5.68. The mean number of desirable financial behaviors was 7.57 on a range of 0-20. The mean for the
financial capability index was 2.78 on a range of -10.01-6.38.
Among the six age groups, the youngest group (aged 18-24) had the lowest percentage (12.0%) and a middle-aged group (aged 45-54) had the highest percentage. Among the
respondents, 49% were male, 63% had college or higher educational level, 55% were married, and 39% had dependent children. In terms of resource levels, 54% were working, 63% had an
income of $35,000 or higher, 30% experienced an income drop, and the mean of financial satisfaction was 5.19 based on a 10-point scale. Regarding financial situations, 90% had checking accounts; 74% had savings, money market accounts, and CDs; 52% had 401k plans; 34% had other investments; and 59% were home owners. In addition, 35% had mortgage loans, 73% had credit cards, and 20% received financial education.
Results of Correlation Analyses
The results of correlation analyses of the financial capability variables are presented in Table 3. All correlations of these variables were as expected. All correlations were statistically significant. Except for the financial capability index, the other four variables correlated with each other modestly, which suggests that all of these variables are needed to
comprehensively measure true financial capability. Correlations of the financial capability index with the other four variables were high (.669 or higher), implying that this index variable may be the best to represent true financial capability.
Results of One-way ANOVA
Figures 1A-1E demonstrate associations of the five financial capability variables by age group. In Figure 1A and 1B, both objective and subjective financial literacy showed positive associations with age group. Results of the one-way ANOVA show some interesting patterns (the tables are not shown but are available upon request). Both objective and subjective financial literacy variables are positively associated with age group but the associations have different patterns. For objective financial literacy, the scores of all age groups are statistically different from each other. But for subjective financial literacy, the scores of three adult groups (ages 25-34, 35-44, 45-54) are not statistically different to each other.
Figure 1C shows age differences in the number of desirable financial behaviors. The youngest age group (age 18-24) has the fewest desirable financial behaviors. One-way ANOVA results indicate that age differences existed. Further Tukey tests indicate that scores for four age groups (18-24, 56-64 and 65 years plus) have differences from each other that are
statistically significant. The other age groups (25-34, 35-44 and 45-54 years) were at variance with the other groups but were not significantly different from each other.
Figure 1D demonstrates the association between perceived financial capability and age. One-way ANOVA results show that scores of all age groups are significantly different from each other. The youngest age group has the lowest score and the oldest group has the highest score on perceived financial capability.
Figure 1E demonstrates the association between the financial capability index and age. Tukey tests indicate that scores from the five age groups (18-24, 25-34, 35-54, 55-64 and 65 years plus) were significantly different. Scores for those 35-44 and 45-54 years were at variance with the other groups but not significantly different from each other.
Results of Multiple OLS Regressions
Multiple OLS regressions were conducted to examine age differences in the five financial capability variables, controlling for socio-demographic and financial variables (Table 4). The five models fit well (see F and p values in the table) and no multicollinearity issues were found (all VIFs were under 3, much smaller than the recommended warning point of 10). The results for objective financial literacy show the same pattern as that of the one-way
ANOVA; compared to the youngest group (age 18-24), all older age groups have higher scores on objective financial literacy (Table 4 column 2). After controlling for other variables,
compared to the youngest group, all older age groups show higher scores for subjective financial literacy (Table 4 column 3). This result is slightly different from the results of the one-way ANOVA, in which scores of several age groups are not statistically different from each other. These results support H1 and H2.
Age group showed interesting patterns in the number of desirable financial behaviors different from the one-way ANOVA results. The regression results indicate that compared to the reference category (age 18-24), the age group 25-34 has the highest number whereas the age group 45-54 has the lowest number of desirable financial behaviors (Table 4 column 4), other age groups are not statistically different from the reference category, which is
inconsistent with the results of the one-way ANOVA and with H3. This result suggests that the relationship between age and the number of desirable financial behaviors is more
complicated than we assumed.
Table 4 column 6 presents the regression results in terms of perceived financial capability. These results are consistent with the one-way ANOVA result that age is positively associated with perceived financial capability, supporting H4.
Table 4 column 6 presents the regression results concerning the financial capability index. The result is slightly different from the one-way ANOVA result. The ANOVA result showed that two age groups, age 35-44 and age 45-54, are not statistically different in terms of the financial capability index, but the regression result indicated that all older age groups were different from the reference group (age 18-24). After controlling for socio-demographic and financial variables, age showed a positive association with the financial capability index.
This study has examined age differences in five financial capability variables. One-way ANOVA and multiple OLS regression analyses were conducted on data from the 2012 U.S. National Financial Capability Study. Results show that both objective financial literacy and subjective financial literacy increase with age even after controlling for socio-demographic and financial factors. The same pattern is also found in perceived financial capability and the financial capability index. In contrast, the pattern of the number of desirable financial
behaviors is more complicated. Bivariate analyses show that young adults (age 18-24) have the lowest number of desirable financial behaviors, whereas multiple regression results show that the age group 25-34 has the highest number and the age group 45-54 has the lowest number of desirable financial behaviors performed after entering control variables. These findings are inconsistent with our hypothesis that the number of desirable financial behaviors is positively associated with age.
The first and second hypotheses concerned the relationship between financial literacy in terms of both subjective and objective measures and age. According to the hypotheses, as consumers age, both their subjective and objective literacy levels should be improved. The result of the objective measure of financial literacy has been supported by both the one-way ANOVA and multiple regression analysis after controlling for relevant variables. The scores of objective financial literacy are statistically different among age groups and compared with the youngest group, age 18-24, older consumers show higher scores. These results support some findings from the literature that shows a general lack of knowledge among young people when dealing with financial situations (NCEE, 2005; Mandell, 2008; Lusardi et al., 2010; Lusardi, 2011), but are inconsistent with others. Although some of the literature (Korniotis and Kumar, 2011;
Lusardi et al., 2012; Lusardi and Mitchell, 2014) points out that objective financial literacy declines among age groups after 65 years old, our results suggest that consumers who are older than 65 as a whole have a higher level of objective financial literacy than others after
controlling for socio-demographic and financial factors. To further explore this issue, we asked the data owner to provide data with a variable for age in years. We selected a subsample of respondents aged 60 years or older and divided them into five groups, ages 60-64, 65-69, 70-74, 75-79, and 80 or older. We found that the score of the group aged 65-69 was significantly
greater than that of the group aged 60-64. The score of the group aged 80 years or older was significantly lower than the younger groups. There were no statistical differences in scores among groups aged 65-69, 70-74, and 75-79. These findings suggest that financial capability may decrease after age 80 years and older.
Despite no significant differences according to the one-way ANOVA, the multiple regression results support the second hypothesis that the scores of subjective financial literacy increase as consumers age. This finding is in line with the previous literature. For example, Finke, Howe, and Huston (2011) concluded that confidence in financial decision-making ability increases with age in all domains. We speculate that their finding may imply older consumers are also more confident than their younger counterparts in assessing their own financial
knowledge. Financial literacy can be seen as one of the important components of human capital (Huston 2010; Lusardi and Mitchell 2014) that can be accumulated by successful financial management practices. Therefore, as consumers age, more opportunities are obtained to improve the level of financial literacy by dealing with daily financial issues, for example credit
card behavior (Lusardi et al. 2010). Moreover, the desirability of acquiring financial literacy is increasing as consumers age as more salient financial issues, like retirement security, are faced.
The third hypothesis addressed the relationship between desirable financial behaviors and age. The one-way ANOVA indicated that three statistically different groups existed among all age groups; however, these results are inconsistent with the regression analysis, which showed a declining pattern as consumers age. One possible reason is that the number of financial behaviors may be an indicator of being financially active. For example, older consumers may have paid off mortgage and other debts and be less active in debt-related behaviors. Another possible reason may be the influence of control variables. As far as we know, age is always treated as an important demographic variable when consumer financial behaviors are analyzed; however, the results vary. To explore the reason of discrepancies between the ANOVA and regression results, we conducted a series of analyses by adding socio-demographic and financial variables to the model step-by-step. We found that before the 401k plan holding and home owner variables were added to the model, the age pattern was the same as the ANOVA results in which older age groups had higher numbers of desirable behaviors than the youngest group (the reference group). After adding the 401k holding and home owner variables, the age pattern changed. The mechanism regarding this change needs to be investigated in future research.
The fourth hypothesis is supported by both one-way ANOVA and multiple regression analyses, which confirmed that the level of consumer perceived financial capability increases as consumers age and reaches a peak in the 65+ age group. As far as we know, little previous literature has either mentioned the concept of perceived financial capability or used it as a
dimension for measuring overall financial capability. Different from subjective financial literacy, perceived financial capability emphasizes the self-efficacy of individual’s general ability for managing financial issues. According to Maddux (2011), the level of self-efficacy can
continuously develop throughout the lifespan as individuals continually integrate information from the following primary sources: performance experiences, imagined experiences, verbal persuasion, and physiological/emotional states. Perceived financial capability or self-efficacy could be improved by employing similar sources during the consumer lifespan.
The fifth hypothesis, that the financial capability index increases as consumers age, is supported by both the one-way ANOVA and multiple regression results. If the other four variables measure financial capability from different perspectives, this variable is a sum of scores of the former four variables that is assumed to best capture true financial capability. The results are inconsistent with previous research that suggests consumers’ financial capability declines after age 65 (Lusardi and Mitchell, 2014). In contrast, our results show that the
financial capability index score is positively associated with age; suggesting older consumers are more financially capable.
Conclusion
This study used a large national data set in the U.S. to examine age differences in consumer financial capability variables. The results suggest that older consumers
demonstrate higher levels of both objective and subjective financial literacy, perceived financial capability and overall financial capability compared to their younger counterparts. The results of this study have important implications for consumer financial educators. The findings suggest that age is an important factor for financial capability. Four of the five
financial capability variables are positively associated with age. The results suggest that accumulation of financial capability occurs as consumers age. Consumer educators should be aware of this pattern and provide age specific financial education to different age groups. Research findings suggest that young consumers aged 18-24 have the lowest scores in four of the five financial capability variables and need special attention by financial educators.
Providing effective financial education for young consumers has long-term benefits not only for these consumers but also for the welfare of society. Many of these young people are just entering job markets and need assistance to acquire financial knowledge and guidance to engage in desirable financial behaviors. They also need assistance to enhance their confidence in managing their finances to secure their own financial future.
To further the knowledgebase of consumer financial education, future research needs to further explore the role of financial behavior in explaining financial capability. Specifically, future research should examine age differences in specific financial behaviors and how these behaviors affect consumer financial capability. If possible, longitudinal data should be used to better examine the trajectories and interrelationships between financial behavior and
capability over the lifespan. In addition, future research should also use advanced statistical analytic approaches, such as path analyses and structural equation modeling, to explore interrelationships of several key terms such as financial literacy, financial behavior, and financial capability.
REFERENCES
Ajzen, I. (1991). The theory of planned behavior. Organizational behavior and human decision processes, 50(2), 179-211.
Allgood, S., & Walstad, W. (2013). Financial Literacy and Credit Card Behaviors: A Cross-Sectional Analysis by Age. Numeracy, 6(2), Article 3.
Angeletos, G. M., Laibson, D., Repetto, A., Tobacman, J., & Weinberg, S. (2001). The hyperbolic consumption model: Calibration, simulation, and empirical evaluation. Journal of Economic Perspectives, 15(3), 47-68.
Arrowsmith, S., & Pignal, J. (2010). Initial findings from the 2009 Canadian financial capability survey. Task Force on Financial Literacy. Special Surveys Division, Statistics Canada. Atkinson, A., McKay, S., Collard, S., & Kempson, E. (2006). Levels of financial capability in the UK:
Results of a baseline survey. London: Financial Services Authority.
Bandura, A. (1982). Self-efficacy mechanism in human agency. American Psychologist, 37(2), 122-147.
Bruine de Bruin, W., Vanderklaauw, W., Downs, J. S., Fischhoff, B., Topa, G., & Armantier, O. (2010). Expectations of inflation: The role of demographic variables, expectation formation, and financial literacy. Journal of Consumer Affairs, 44(2), 381-402. Campbell, J. Y., Jackson, H. E., Madrian, B. C., & Tufano, P. (2011). Consumer financial
protection. The Journal of Economic Perspectives, 25(1), 91-113.
Collins, J. M., & O’Rourke, C. M. (2010). Financial education and counseling—Still holding promise. Journal of Consumer Affairs, 44(3), 483-498.
curriculum. International Journal of Consumer Studies, 36(5), 515-522.
Dew, J., & Xiao, J. J. (2011). The financial management behavior scale: Development and validation. Journal of Financial Counseling and Planning, 22(1), 43-59.
Eccles, D. W., Ward, P., Goldsmith, E., & Arsal, G. (2013). The relationship between retirement wealth and householders' lifetime personal financial and investing behaviors.
Journal of Consumer Affairs, 47(3), 432-464.
Fessler, P., Schürz, M., Wagner, K., & Weber, B. (2007). Financial capability of Austrian households. Monetary Policy & the Economy Q3, 50-67.
Finke, M. S., Howe, J. S., & Huston, S. J. (2011). Old age and the decline in financial literacy. Available at http://dx.doi.org/10.2139/ssrn.19486279
FINRAIEF. (2009). Financial capability in the United States: National survey—executive summary. Washington, DC: FINRA Investor Education Foundation.
FINRAIEF. (2013). Financial capability in the United States: Report of findings from the 2012 National Financial Capability Study. Washington, DC: FINRA Investor Education Foundation.
Fonseca, R., Mullen, K. J., Zamarro, G., & Zissimopoulos, J. (2012). What explains the gender gap in financial literacy? The role of household decision making. Journal of Consumer Affairs, 46(1), 90-106.
Fox, J. J., & Bartholomae, S. (2008). Financial education and program evaluation. In J. J. Xiao (Ed.), Handbook of consumer finance research (pp. 47-68). New York: Springer.
Hanna, S. D., & Chen , S. C. (2008). Retirement savings. In J. J. Xiao (ed.).Handbook of consumer finance research (pp. 35-46). New York: Springer.
Herd, P., Holden, K., & Su, Y. T. (2012). The links between early‐life cognition and schooling and late‐life financial knowledge. Journal of Consumer Affairs, 46(3), 411-435.
Hira, T. K. (2012). Promoting sustainable financial behaviour: Implications for education and research. International Journal of Consumer Studies, 36(5), 502-507.
Huang, J., Nam, Y., & Sherraden, M. S. (2013). Financial knowledge and Child Development Account policy: A test of financial capability. Journal of Consumer Affairs, 47(1), 1-26. Huston, S. J. (2012). Financial literacy and the cost of borrowing. International Journal of
Consumer Studies, 36(5), 566-572.
Huston, S. J. (2010). Measuring financial literacy. Journal of Consumer Affairs, 44(2), 296-316. Knoll, M. A., & Houts, C. R. (2012). The financial knowledge scale: An application of item
response theory to the assessment of financial literacy. Journal of Consumer Affairs, 46(3), 381-410.
Korniotis, G. M., & Kumar, A. (2011). Do older investors make better investment decisions? Review of Economics and Statistics, 93(1), 244-265.
Laibson, D. (1997). Golden eggs and hyperbolic discounting. The Quarterly Journal of Economics, 443-477.
Lindamood, S., Hanna, S. D., & Bi, L. (2007). Using the Survey of Consumer Finances: Some methodological considerations and issues. Journal of Consumer Affairs, 41(2), 195-222. Lusardi, A. (2011). Americans' financial capability (No. w17103). National Bureau of Economic
Lusardi, A., & Mitchell, O. S. (2014). The economic importance of financial literacy: Theory and evidence. Journal of Economic Literature, 52(1): 5-44.
Lusardi, A., Mitchell, O. S., & Curto, V. (2010). Financial literacy among the young. Journal of Consumer Affairs, 44(2), 358-380.
Lusardi, A., Mitchell, O. S., & Curto, V. (2012). Financial sophistication in the older population (No. w17863). National Bureau of Economic Research.
Maddux, J. E. (2011). The Power of believing you can. In S. J. Lopez & C.R. Snyder (Ed.), The Oxford handbook of positive psychology (pp.335-343). New York: Oxford.
Mandell, L. (2008). Financial education in high school. In A. Lusardi (ed.), Overcoming the saving slump: How to increase the effectiveness of financial education and saving programs, (pp.257-279). Chicago: University of Chicago Press.
Mayer, R. N., Zick, C. D., & Marsden, M. (2011). Does calculating retirement needs boost retirement savings?. Journal of Consumer Affairs, 45(2), 175-200.
Modigliani, F. (1986). Life cycle, individual thrift, and the wealth of nations. American Economic Review, 76, 297-313.
Monticone, C. (2010). How much does wealth matter in the acquisition of financial literacy?. Journal of Consumer Affairs, 44(2), 403-422.
National Council on Economic Education (NCEE). 2005. What American teens and adults know about economics. Washington, D.C.: Author.
Nicolini, G., Cude, B. J., & Chatterjee, S. (2013). Financial literacy: A comparative study across four countries. International Journal of Consumer Studies, 37(6), 689-705.
O’Donnell, N., & Keeney, M. J. (2009). Financial capability: New evidence for Ireland (No. 1/RT/09). Dublin, Ireland: Central Bank of Ireland.
PACFC. (2013). Final report: President’s Advisory Council on financial capability. Washington, DC: President’s Advisory Council on Financial Capability.
Prochaska, J. O., DiClemente, C. C., & Norcross, J. C. (1992). In search of how people change: Applications to addictive behaviors. American psychologist, 47(9), 1102-1114.
Remund, D. L. (2010). Financial literacy explicated: The case for a clearer definition in an increasingly complex economy. Journal of Consumer Affairs, 44(2), 276-295.
Robb, C. A., & Woodyard, A. (2011). Financial knowledge and best practice behavior. Journal of Financial Counseling and Planning, 22(1), 60-70.
Schmeiser, M. D., & Seligman, J. S. (2013). Using the right yardstick: Assessing financial literacy measures by way of financial well‐being. Journal of Consumer Affairs, 47(2), 243-262. Servon, L. J., & Kaestner, R. (2008). Consumer financial literacy and the impact of online banking
on the financial behavior of lower‐income bank customers. Journal of Consumer Affairs, 42(2), 271-305.
Sevim, N., Temizel, F., & Sayılır, Ö. (2012). The effects of financial literacy on the borrowing behavior of Turkish financial consumers. International Journal of Consumer Studies, 36(5), 573-579.
Taylor, E. W., Tisdell, E. J., & Forté, K. S. (2012). Teaching financial literacy: A survey of
community‐based educators. International Journal of Consumer Studies, 36(5), 531-538. Taylor, M. (2011). Measuring financial capability and its determinants using survey data. Social
Tennyson, S., & Nguyen, C. (2001). State curriculum mandates and student knowledge of personal finance. Journal of Consumer Affairs, 35(2), 241-262.
Van Der Cruijsen, C. A., De Haan, J., Jansen, D. J., & Mosch, R. H. (2012). Households' decisions on savings accounts after negative experiences with banks during the financial crisis. Journal of Consumer Affairs, 46(3), 436-456.
West, J. (2012). Financial literacy education and behaviour unhinged: Combating bias and poor product design. International Journal of Consumer Studies, 36(5), 523-530.
Xiao, J. J. (2008). Applying behavior theories to financial behavior. In J. J. Xiao (Ed.), Handbook of consumer finance research (pp. 69-81). New York: Springer.
Xiao, J. J., Ahn, S. Y., Serido, J., & Shim, S. (2014a). Earlier financial literacy and later financial behavior of college students. International Journal of Consumer Studies. Online First. Xiao, J. J., Chen, C., & Chen, F. (2014b). Consumer financial capability and financial satisfaction.
Social Indicators Research, 118, 415-432.
Xiao, J. J., Tang, C., Serido, J., & Shim, S. (2011). Antecedents and consequences of risky credit behavior among college students: Application and extension of the Theory of Planned Behavior. Journal of Public Policy & Marketing, 30(2), 239-245.
Xiao, J. J., Tang, C., & Shim, S. (2009). Acting for happiness: Financial behavior and life satisfaction of college students. Social Indicators Research, 92(1), 53-68.
Xiao, J. J., Sorhaindo, B., & Garman, E. T. (2006). Financial behaviours of consumers in credit counselling. International Journal of Consumer Studies, 30(2), 108-121.
Table 1
Variable Specifications
Variable label Attribute
Financial Capability
Objective financial literacy 0-5, the sum of correct numbers for financial literacy questions. The five questions are about interest, inflation, mortgages, bonds, and stocks. The original financial literacy variables were recoded to binary variables in which 1=correct answer, 0=otherwise and then the new variables were summed to form the score.
Subjective financial literacy The wording of the original question: “how would you assess your overall financial knowledge?”: 1-very low, 7-very high
Desirable financial behavior The sum of 20 desirable financial behaviors. Each behavior is measured by a binary variable, 1=yes, 0=no. See the note for specific financial behaviors. The range of this composite variable is 0-20. Perceived financial capability: The wording of the original question: “I am good at dealing with
day-to-day financial matters, such as checking accounts, credit and debit cards, and tracking expenses”: 1-strongly disagree, 7-strongly agree
Financial capability index Sum of Z scores of objective financial literacy, subjective financial literacy, desirable financial behavior, and perceived financial capability
Age
Age group 6 age groups (18-24, 25-34, 35-44, 45-54, 55-64, 65 or older). In regression analyses, the reference category is age 18-24.
Control Variables
Being male (vs. female) 1=male, 0=female Some college or higher level 1=yes, 0=no
Being married 1=married, 0=not married Having dependent children 1=yes, 0=no
Working 1=yes, 0=no Income of $35,000 or higher 1=yes, 0=no Experiencing income drop 1=yes, 0=no
Financial satisfaction 1-not at all satisfied, 10-extremely satisfied Having checking account 1=yes, 0=no
Having savings, MMA and CD. 1=yes, 0=no Having a 401k plan 1=yes, 0=no Having other investments 1=yes, 0=no Owning a home 1=yes, 0=no Having a mortgage 1=yes, 0=no Having credit card 1=yes, 0=no Received financial education 1=yes, 0=no
Note: 20 desirable financial behaviors are spending within income, saving for children’s college education, saving for emergency, checking credit reports, checking credit scores, using advice on financial services (debt counseling, investment, mortgage, insurance, and taxes), contributing to 401k plans, comparison shopping for credit card, calculating retirement needs, making mortgage payment on time, and desirable credit card behaviors (making full payment, not keeping balance, not making minimum payment, not paying late fees, not being over the limit, and not using cash advance).
Table 2 Descriptive Statistics of the Weighted Sample
Variable label Mean Objective financial literacy (0-5) 2.95 Subjective financial literacy (1-7) 5.16 Perceived financial capability (1-7) 5.68 Desirable financial behavior (0-20) 7.57 Financial capability index 2.78 Financial satisfaction (1-10) 5.19 Percent Age 18-24 12.0 Age 25-34 18.3 Age 35-44 16.3 Age 45-54 19.8 Age 55-65 17.9 Age 65 or older 15.7 Being male (vs. female) 49.0 Some college or higher level 63.1 Being married 54.5 Having dependent children 39.3 Income of $35,000 or higher 63.0 Experiencing income drop 29.5
Working 53.5
Having checking account 90.1 Having savings, MMA and CD. 73.9 Having a 401k plan 52.3 Having other investments 33.5 Owning a home 58.8 Having a mortgage 35.3 Having credit card 72.8 Received financial education 19.9
Table 3
Correlations of Financial Capability Related Variables (N=24,395) Objective financial literacy Subjective financial literacy Desirable financial behavior Perceived financial capability Subjective financial literacy .246
Desirable financial behavior .396 .348
Perceived financial capability .252 .421 .299
Financial capability index .669 .718 .724 .702
Table 4
Results of OLS Regression on Financial Capability Variables (N=24,395)
Variable Objective Financial Literacy Subjective Financial Literacy Desirable Financial Behavior Perceived Financial Capability Financial Capability Index (1) (2) (3) (4) (5) (6) (Constant) 1.270*** (.039) 3.614*** (.037) -.459*** (.083) 4.070*** (.048) -5.245*** (.064) Age 25-34 .158*** (.032) .130*** (.030) .141* (.068) .161*** (.039) .343*** (.053) Age 35-44 .407*** (.033) .172*** (.031) -.137 (.070) .291*** (.040) .568*** (.055) Age 45-54 .567*** (.032) .170*** (.030) -.175** (.068) .380*** (.039) .725*** (.053) Age 55-64 .677*** (.033) .281*** (.031) .086 (.069) .521*** (.040) 1.035*** (.054) Age 65 or older .801*** (.035) .409*** (.033) .133 (.074) .549*** (.043) 1.248*** (.058) Male .464*** (.016) .136*** (.015) .097** (.034) -.049* (.019) .416*** (.026)
Some college or higher level .508***
(.018) .109*** (.017) .588*** (.038) .148*** (.022) .659*** (.030) Married .054** (.018) .035* (.017) .124*** (.039) .003 (.022) .094** (.030)
Have dependent children -.105***
(.018) .086*** (.017) .302*** (.039) -.049* (.022) .031 (.030) Income of $35,000 or higher .257*** (.021) -.021 (.020) .383*** (.044) -.014 (.026) .237*** (.035) Working .035* (.018) .044*** (.017) .232*** (.038) -.006 (.022) .106*** (.029) Financial satisfaction -.038*** (.003) .125*** (.003) .311*** (.007) .077*** (.004) .190*** (.005)
Experience income drop -.099***
(.018) .099*** (.017) .146*** (.039) -.123*** (.022) -.036 (.030)
Have checking account .199***
(.030) .099*** (.029) .005 (.065) .529*** (.037) .551*** (.051)
Have savings, MMA and CD .143***
(.021) .073*** (.020) .685*** (.045) .191*** (.026) .429*** (.035) Have investment .368*** (.019) .169*** (.018) 1.660*** (.040) .076*** (.023) .803*** (.032) Have 401k account .191*** (.019) -.023 (.018) .766*** (.040) -.004 (.023) .281*** (.031) Own home .060*** (.023) .093*** (.022) .385*** (.049) .088** (.028) .256*** (.039) Have mortgage .081*** (.021) .035 (.020) .856*** (.045) .010 (.026) .280*** (.035)
Have credit card .194***
(.021) .171*** (.020) 4.521*** (.045) .193*** (.026) 1.396*** (.035)
Received financial education .314***
(.019) .421*** (.018) .670*** (.041) .238*** (.024) .846*** (.032) F 471.5 278.4 2364.0 154.9 1097.7 p .000 .000 .000 .000 .000 R2 .289 .193 .671 .118 .486
Figure 1
Financial Capability Variables by Age Based on Data from the 2012 National Financial Literacy Study
A) Objective Financial Literacy by Age, Mean Scores (Theoretical Range, 0-5)
Note: Tukey tests indicate that scores of all age groups are statistically different from each other.
B) Subjective Financial Literacy by Age, Mean Scores (Theoretical Range, 1-7)
Note: Tukey tests indicate that scores of following age groups are different from each other, age 18-24, age 25-54, age 56-64, and age 65+.
C) Desirable Financial Behaviors by Age, Mean Scores (Theoretical Range, 0-20)
Note: Tukey tests indicate that scores of following age groups are different from each other, age 18-24, age 25-54, age 56-64, and age 65+.
D) Perceived Financial Capability by Age, Mean Scores (Theoretical Range, 1-7)
E) Financial Capability Index by Age, Mean Scores (Theoretical Range, -10.01-6.38)
Note: Tukey tests indicate that scores of following age groups are statistically different from each other, age 18-24, age 24-34, age 35-54, age 55-64, and age 65+.