Kenya
Health Policy
2014–2030
Towards attaining the highest standard
of health
Nairobi, July 2014
Any part of this document may be freely reviewed, quoted, reproduced or translated in full or in part, provided the source is acknowledged. It may not be sold or used in conjunction with commercial purposes or for profit.
Kenya Health Policy 2014–2030
Published by: Ministry of Health
Afya House Cathedral Road PO Box 30016 Nairobi 00100
FOREWORD
The Kenya Health Policy, 2014–2030 gives directions to ensure significant improvement in overall status of health in Kenya in line with the Constitution of Kenya 2010, the country’s long-term development agenda, Vision 2030 and global commitments. It demonstrates the health sector’s commitment, under the government’s stewardship, to ensuring that the country attains the highest possible standards of health, in a manner responsive to the needs of the population. This policy is designed to be comprehensive and focuses on the two key obligations of health: realisation of fundamental human rights including the right to health as enshrined in the Constitution of Kenya 2010 and; contribution to economic development as envisioned in Vision 2030; and. It focuses on ensuring equity, people centeredness and a participatory approach, efficiency, a multisectoral approach, and social accountability in the delivery of healthcare services. The policy embraces the principles of protection of the rights and fundamental freedoms of specific groups of persons, including the right to health of children, persons with disabilities, youth, minorities, the marginalised and older members of the society, in accordance with the Constitution.
The policy focuses on six objectives and eight orientations to attain the government’s goals in health. It takes into account the functional responsibilities between the two levels of government (county and national) with their respective accountability, reporting, and management lines. It proposes a comprehensive and innovative approach to harness and synergise health services delivery at all levels and engaging all actors, signalling a radical departure from past approaches in addressing the health agenda. There is therefore, need to raise awareness and ensure that the objectives of this policy are understood and fully owned by the various stakeholders and implementing partners.
The policy was developed through a participatory process involving all stakeholders in health including government ministries, departments and agencies; clients, counties, constitutional bodies, development partners (multilateral and bilateral) and implementing partners (faith-based, private sector, and civil society). The detailed strategies, specific programmes and packages will be elaborated in subsequent five-year strategic and investment plans.
It is my sincere hope that under the devolved system of government, all the actors in health in Kenya will rally around these policy directions to ensure that we all progressively move towards the realisation of the right to health and steer the country towards the desired health goals.
JAMES W. MACHARIA
CABINET SECRETARY MINISTRY OF HEALTH
CONTENTS
LIST OF TABLES AND FIGURES ... II ACRONYMS ... III
PART 1: BACKGROUND... 1
CHAPTER 1: INTRODUCTION ... 2
1.1. Health Policy and the Constitution of Kenya 2010 ... 1
1.2. Health under Devolved System of Government ... 3
1.3. Health Policy and the National Development Agenda ... 4
1.4. Principles Guiding the Kenya Health Policy ... 5
1.5. Organisation of Healthcare Service Delivery System ... 5
1.6. National, Regional, and Global Health Challenges ... 6
1.7. The Policy Development Process ... 7
CHAPTER 2: SITUATION ANALYSIS ... 8
2.1. General Health Profile ... 8
2.2. Progress in Overall Health Status ... 10
2.3. Review of Health Investments ... 12
2.4. Review of the Outcomes of the Implementation of the Previous Policy ... 16
2.5. Overall Performance in Country Commitments ... 21
PART 2: POLICY DIRECTIONS ... 23
CHAPTER 3: POLICY PROJECTIONS AND FRAMEWORK ... 23
3.1. Policy Projections ... 23
3.2. Components of the Policy Framework ... 26
3.3. Policy Principles ... 28
CHAPTER 4: POLICY GOAL, OBJECTIVES, AND ORIENTATIONS ... 29
4.1. Policy Goal ... 29
4.2. Policy Objectives ... 31
4.3. Policy Orientations ... 36
PART 3: POLICY IMPLEMENTATION ... 55
CHAPTER 5: IMPLEMENTATION FRAMEWORK ... 55
5.1. Institutional Framework ... 55
5.2. Stakeholders in Health Service Delivery ... 56
5.3. Intergovernmental Management Arrangements in Health ... 58
CHAPTER 6: MONITORING AND EVALUATION ... 60
6.1. Monitoring and Evaluation Framework ... 60
6.2. Progress Indicators ... 63
CONCLUSION ... 64
LIST OF TABLES AND FIGURES
Table 1. Summary of the Main Constitutional Articlesthatat Have Implications
for Health ... 2
Table 2. IMR and U5mr 1998–2008/09, by Region ... 9
Table 3. Leading Causes of Death and Disability in Kenya, 2009 ... 9
Table 4. Leading Risk Factors and Contribution to Mortality and Morbidity, 2009 ... 11
Table 5. Recent Trends in Number of Registered Selected Healthcare Cadres .. 14
Table 6. Distribution of Health Facilities ... 15
Table 7. Absolute and Relative Mortality Targets for Kenya, 2010−2030 ... 25
Table 8. Kenya Health Policy Targets ... 29
Table 9. Areas of Intervention in Organisation of Service Delivery ... 39
Table 10. Tiers and Levels of Care ... 40
Table 11. Indicators for Measuring Kenya Health Policy 2014−2030 Performance ... 63
Figure 1. Recent Trends in Health Impact Indicators in Kenya, 1993–2008 ... 8
Figure 2. Overall Public Health Expenditure Trends: 2001−2010 ... 13
Figure 3. Trends in Contraceptive Use Rate Among Married Women ... 17
Figure 4. Public Health Expenditure Trends ... 19
Figure 5. Health Projections: 2011–2030 ... 24
Figure 6. Policy Framework for Health: Orientations, Principles, Objectives, and Goal ... 26
Figure 7. Effects of Investments on Policy Orientations ... 37
Figure 8. Organisation of Health Service Delivery System ... 42
Figure 9. Overarching Planning and Review Framework for Kenya’s Health Policy ... 62
ACRONYMS
AIDS Acquired Immune Deficiency Syndrome
CSO Civil Society Organisation
DALY Disability-adjusted Life Years
FBO Faith-based Organisation
GDI Gender Development Index
GDP Gross Domestic Product
GOK Government of Kenya
HIV Human Immunodeficiency Virus
HMIS Health Management Information System
HPT Health Products and Technologies
HRH Human Resources for Health
HSSP Health Sector Strategic Plan
ICT Information Communication Technology
IMR Infant Mortality Rate
KEMSA Kenya Medical Supplies Authority
KEPH Kenya Essential Package for Health
KHPF Kenya Health Policy Framework
MDA Ministries, Departments, and Agencies
MDG Millennium Development Goals
MMR Maternal Mortality Ratio
MOH Ministry of Health
NACC National AIDS Control Council
NCD Non-communicable Disease
NGO Nongovernmental Organisation
NMR Newborn Mortality Rate
NTD Neglected Tropical Diseases
OOP Out of Pocket
SACCO Savings and Credit Co-operative Organisation
SAGA Semi-autonomous Government Agency
SWAp Sector-wide Approach
TB Tuberculosis
U5MR Under-five Mortality Rate
PART 1:
CHAPTER 1: INTRODUCTION
1.1. Health Policy and the Constitution of Kenya 2010
The Constitution of Kenya 2010 provides the overarching legal framework to ensure a comprehensive rights-based approach to health services delivery. It provides that every person has a right to the highest attainable standard of health, which includes reproductive health rights. It further states that a person shall not be denied emergency medical treatment and that the State shall provide appropriate social security to persons who are unable to support themselves and their dependants.1
The Constitution further obligates the State and every State organ to observe, respect, protect, promote, and fulfil the rights in the Constitution and to take “legislative, policy and other measures, including setting of standards to achieve the progressive realisation of the rights guaranteed in Article 43.” State organs and public officers also have a constitutional obligation to address the needs of the vulnerable groups2 in society and to domesticate the provisions of any relevant international treaty and convention that Kenya has ratified.3 The State has a further constitutional obligation under Article 46 of the Constitution to protect consumer rights, including the protection of health, safety, and economic interests.
The Constitution outlines the values and principles which all State organs and officers are expected to employ in the delivery of services. The health sector is therefore obligated to implement the principles in Articles 10 and 232, Chapters 6 and 12 of the Constitution, among others, and establish the framework necessary to support their implementation.
Table 1 summarises the main constitutional articles, among others, that have implications for health.
1 Article 43 of the Constitution of Kenya 2010.
2 These include women, older members of society, persons with disabilities, children and
youth, members of minority or marginalised communities, and members of particular ethnic and religious or cultural communities.
3 Article 2(6) of the Constitution recognises ratified international treaties as part of the laws of
Table 1. Summary of the Main Constitutional Articles that have Implications for Health
ARTICLE CONTENT
20 20 (5) (a) Responsibility of the State to show resources are not available.
20 (5) (b) In allocating resources, the State will give priority to ensuring widest possible enjoyment of the right or fundamental freedom having regard to prevailing circumstance, including the
vulnerability of particular groups or individuals
21 Duty of the State and State organs to provide for and take measures for progressive realisation of rights under Article 43, including addressing the needs of vulnerable groups within society and the international obligations regarding those rights.
43 (1) Every person has the right—
(a) To the highest attainable standard of health, which includes the right to healthcare services, including reproductive healthcare;
(b) To reasonable standards of sanitation;
(c) To be free from hunger and have adequate food of acceptable quality; and (d) To clean and safe water in adequate quantities.
(2) A person shall not be denied emergency medical treatment.
26 Right to life
Life begins at conception; abortion is not permitted unless, in the opinion of a trained health professional, there is need for emergency treatment, or the life or health of the mother is in danger, or if permitted by any other written law.
32 Freedom of conscience, religion, belief, and opinion.
46 Consumers have the right to protection of their health, safety, and economic interests.
53−57 Rights of special groups:
- Children have right to basic nutrition and healthcare.
- People with disabilities have right to reasonable access to health facilities and materials and devices.
- Youth have the right to relevant education and protection from harmful cultural practices and exploitation.
- Minority and marginalised groups have the right to reasonable health services.
174−175 189−191 Fourth Schedule
Objectives and principles of devolved government
Cooperation between national and county governments, support to county governments, and conflict of laws between different levels of government
National: Health policy; national referral health facilities; capacity building and technical assistance to counties;
County health services: County health facilities and pharmacies; ambulance services; promotion of primary healthcare; licensing and control of undertakings that sell food in public places; veterinary services; cemeteries, funeral parlours, and crematoria; refuse removal, refuse dumps, and solid waste; and
Staffing of county governments: Within the framework of the norms and standards set by the National government in accordance with the relevant legislation and policies.
1.2. Health under the Devolved System of
Government
The most significant feature of the Constitution of Kenya 2010 is the introduction of a devolved system of government, which is unique for Kenya and provides for one (1) national government and forty-seven (47) county governments. The governments at the national and county levels are “distinct and interdependent,” and are expected to undertake their relations through “consultation and cooperation.”4 The distinctiveness of the governments under the devolved system is determined by the Fourth Schedule of the Constitution, which has assigned different functions to the two levels of government.
In observance of this provision, the Kenya Health Policy 2014−2030 takes into account the objectives of devolution, which include the following:
The promotion of democracy and accountability in delivery of healthcare; Fostering of seamless service delivery during and after the transition
period;
Facilitating powers of self-governance to the people and enhancing their participation in making decisions on matters of health affecting them; Recognising the right of communities to manage their own health affairs
and to further their development;
Protection and promotion of the health interests and rights of minorities and marginalised communities, including informal settlements such as slum dwellers and under-served populations;
Promotion of social and economic development and the provision of proximate, easily accessible health services throughout Kenya;
Ensuring equitable sharing of national and local resources targeting health delivery throughout Kenya;
Enhancing capacities of the two levels of governments to effectively deliver health services in accordance with their respective mandates; Facilitating the decentralization of state organs responsible for health,
their functions and services from the Capital of Kenya
Enhancing checks and balances and the separation of powers between the two levels of government in delivery of health care
The policy takes cognisance of the specific functions assigned to the two levels of governments, which are as follows: National government: leadership of health
policy development; management of national referral health facilities; capacity building and technical assistance to counties; and consumer protection, including the development of norms, standards and guidelines. County governments: responsible for county health services, including county health facilities and pharmacies; ambulance services; promotion of primary healthcare; licensing and control of undertakings that sell food to the public; cemeteries, funeral parlours and crematoria; and refuse removal, refuse dumps, and solid waste disposal. Details of the activities under the national and county governments’ respective functions will be further defined through the unbundling of functions pursuant to the provisions of the Transition to Devolved Government Act and Article 187 of the Constitution, and the sector intergovernmental agreements between the national and county governments. This policy forms the fundamental framework for managing the devolution of the healthcare sector, through and beyond the transition period. The policy provides for the development and strengthening of the necessary national, county, and intergovernmental mechanisms and frameworks within which health will be managed as a devolved function.
1.3. Health Policy and the National Development
Agenda
Over the years, Kenya has strived to overcome development obstacles and improve the socioeconomic status of her citizens, including health. Some of the initiatives include the development and implementation of the Kenya Health Policy Framework (KHPF 1994−2010), Vision 2030, the promulgation of the Kenya Constitution 2010, and fast-tracking actions to achieve the Millennium Development Goals (MDGs) by 2015. The Government of Kenya (GOK) also upholds the fundamental right to health access for every Kenyan as envisaged in Vision 2030.
The implementation of KHPF 1994−2010 led to significant investment in public
health programmes and minimal
investment in medical services, resulting to improvement of health indicators such as infectious diseases and child health. However, the emerging increase of non-communicable diseases is a threat to the gains made so far. This policy aims at consolidating the gains attained so far, while guiding achievement of further gains in an equitable, responsive, and efficient manner. It is envisioned that the
Key objectives of the Kenya Health Policy 2014–2030
Eliminate communicable conditions
Halt and reverse the rising burden of non-communicable conditions
Reduce the burden of violence and injuries
Provide essential healthcare Minimize exposure to health risk
factors
Strengthen collaboration with private and other health-related sectors
ongoing government reforms, together with the anticipated sustained economic growth, will facilitate the achievement of the health goals.
Vision 2030 is the long term development blueprint for the country, aiming to transform Kenya into a “globally competitive and prosperous and newly industrialised middle-income country providing a high quality of life to all its citizens in a clean and secure environment by 2030”. Health is one of the components of delivering the Vision’s Social Pillar, given the key role it plays in maintaining the healthy and skilled workforce necessary to drive the economy. To realise this ambitious goal, the health sector defined priority reforms as well as flagship projects and programmes, including the restructuring of the sector’s leadership and governance mechanisms, and improving the procurement and availability of essential health products and technologies. Other projects include digitization of records and health information system; accelerating the process of equipping of health facilities including infrastructure development; human resources for health development; and initiating mechanisms towards universal health coverage.
The goal of the Kenya Health Policy 2014–2030 is attainment of the highest standard of health in a manner responsive to the needs of the Kenya population. In addition, policy principles and orientations have been formulated to facilitate the development of comprehensive health investments, health plans, and service provision within the devolved healthcare system.
1.4. Principles Guiding the Kenya Health Policy
Articles 10 and 232, together with Chapters 6 and 12 of the Constitution provide guidance on the values and principles that all State organs and officers are expected to uphold in the delivery of services. In the implementation of this policy, the health sector will embrace the following principles: Equity in distribution of health services and interventions;
i. Public participation, in which a people-centred approach and social accountability in planning and implementation shall be encouraged, in addition to the multisectoral approach in the overall development planning; ii. Efficiency in application of health technologies; and
iii. Mutual consultation and cooperation between the national and county governments and among county governments.
1.5. Organisation of Healthcare Service Delivery
System
Kenya’s healthcare system is structured in a hierarchical manner that begins with primary healthcare, with the lowest unit being the community, and then graduates, with complicated cases being referred to higher levels of healthcare.
Primary care units consist of dispensaries and health centres. The current structure consists of the following six levels:
Level 1: Community Level 2: Dispensaries Level 3: Health centres
Level 4: Primary referral facilities Level 5: Secondary referral facilities Level 6: Tertiary referral facilities
1.6. National, Regional, and Global Health
Challenges
Globalisation, political instability, and the emerging regional and national macroeconomic challenges triggered by the global economic downturn, together with climate change, have had an adverse impact on health. In addition, the increased cross-border movements of goods, services, and people, as well as international regulations and institutions, have had a considerable influence on national health risks and priorities. To respond to these challenges, regional and global initiatives focusing on health have been undertaken, This policy was developed at a time when the global development efforts towards the attainment of the MDGs were coming to a close, and other global initiatives, such as those targeting non-communicable diseases (NCDs), social determinants of health, and managing emerging and re-emerging health threats are gaining momentum. Further, there are emerging global efforts and commitments on aid effectiveness, which include Rome 2003, Paris 2005, Accra 2008, and Busan 2011, that focus on aligning donor support to country policies, strategies, and priorities, and using country systems during implementation for purposes of ownership. In line with Article 2 of the Constitution, the policy will conform to these internationally ratified obligations. The country still faces health challenges, especially concerning children, for whom under-nutrition is the single greatest contributor to child mortality. Other factors involved in high mortality include immunisable diseases and high maternal mortality arising from prepartum, childbirth, and postpartum conditions. Many people are also exposed to a heavy and wide-ranging disease burden, partly because of the country’s unique geographical and climatic conditions. The difficult, disaster-prone environment in the arid and semi-arid regions of the country, and the lush but malaria-prone regions in other parts of the country, all have unique health risks associated with them. Stunting levels remain unacceptably high, at 35 per cent,5 with major national implications for survival, productivity, and economic development.
Kenya also faces problems of emerging and re-emerging diseases. Tuberculosis (TB) has resurfaced as a major cause of ill health. While HIV prevalence has been
steadily declining, the number of those infected continues to increase. In addition, the country faces an increasing health burden from injuries and non-communicable diseases, which are exacerbated by the negative underlying social health determinants in the country. Political instability in the Eastern Africa region and the subsequent in-migration of refugees into Kenya has the result of increasing the demand for health services in the country and raising the risk of spreading communicable diseases.
Limitations in the regulatory and resource capacity and utilisation have constrained the health sector’s ability to harness fully the existing technology to manage most of the direct causes of ill health and death. The unionisation of health workers and recurrent industrial action also present new demands and challenges to the sector.
This policy provides guidance on how Kenya will address some of the challenges observed and build on the gains made so far.
1.7. The Policy Development Process
The Kenya Health Policy 2014−2030 was developed under the stewardship of the national government over a period of two years through an evidence-based and extensive consultative process with stakeholders. These stakeholders included relevant government ministries, departments, and agencies; county governments; constitutional bodies; multilateral and bilateral development partners; and faith-based, private sector, civil society and implementing partners. The definition and development of the policy objectives and orientations was based on a comprehensive and critical analysis of the status, trends, and achievement of health goals in the country during the implementation period of the previous policy framework of 1994−2010. The outputs from these processes are available as background information for this policy.6 The first draft was prepared after initial consultations at the national level and the regions in 2012, and circulated to the county governments and other stakeholders in mid-2013 for their review. The stakeholders’ inputs were incorporated in the final policy draft during joint sessions between the national-level and county government representatives that were facilitated by the Commission on the Implementation of the Constitution. The resultant consensus policy document was then presented for consideration by Cabinet and the National Assembly.
6 Government of Kenya, 2010. Health Situation Trends and Distribution, 1994–2010, and
CHAPTER 2: SITUATION ANALYSIS
This section summarises the progress made in Kenya in (1) overall population health status, (2) investment made in health, (3) outcomes from the implementation of interventions under the previous policy period. The situation analysis was informed from a comprehensive review of the 1994–2010 Kenya Health Policy Framework and other surveys, some which provided data only up to 2010. More periodic surveys and reviews will be undertaken during the implementation of the new policy to update this information.
2.1. General Health Profile
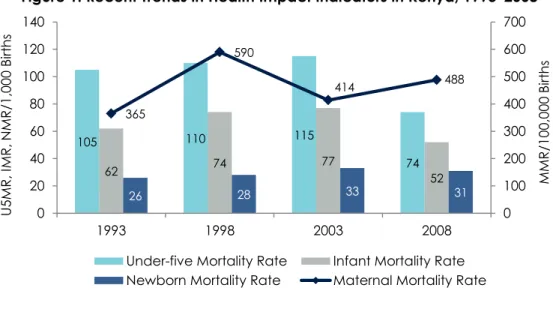
Over the past decade, there has been general improvement in the health profile for Kenya. Life expectancy (LE) at birth in Kenya dropped from 58 years in 1993 to a low of 50 years in 2000,7 but rose to 60 years by 2009.8 Towards the end of the last policy period, some evidence of improvements in indicators for specific age groups emerged, particularly those related to adult, infant, and child health. However, some indicators stagnated, especially those related to neonatal and maternal health, as shown in Figure 1 below.
Figure 1. Recent Trends in Health Impact Indicators in Kenya, 1993–2008
There are geographic and sex/gender-specific differences in health indicators and among different age groups across the country. Disparities between regions persist, with the Gender Development Index (GDI)9 ranging from 0.628 (Central Region) to
7 Kenya Demographic and Health Survey 2003. 8 WHO 2010 World Health Statistics.
9 The GDI measures how human development indices for longevity, knowledge, and standards of
living are differentiated by gender, ranging from 0.001 for most differentiated to 1.000 for almost equal. 105 110 115 74 62 74 77 52 26 28 33 31 365 590 414 488 0 100 200 300 400 500 600 700 0 20 40 60 80 100 120 140 1993 1998 2003 2008 MMR /1 00 ,0 00 Bi rt h s U5 MR , I MR , N MR /1 ,0 00 Bi rt h s
Under-five Mortality Rate Infant Mortality Rate Newborn Mortality Rate Maternal Mortality Rate
0.401 (Arid/Semi-Arid Lands). Infant and child mortality rates have remained lowest in the Central and Nairobi regions, whereas they persistently are higher than the national average in the Nyanza, Western and Coast regions, as shown in Table 2 below.
Table 2. IMR and U5MR 1998–2008/09, by Region
Region Infant Mortality Rate Under-five Mortality Rate
1998 2003 2008–09 1998 2003 2008–09 Nairobi 41 67 60 66 95 64 Central 27 44 42 35 54 51 Coast 70 78 71 96 116 87 Eastern 53 56 39 78 84 52 Nyanza 135 133 95 199 206 149 Rift Valley 50 61 48 68 77 59 Western 64 80 65 123 144 121 North Eastern 91 57 163 80 National average 71 77 52 105 115 74
Source: Kenya Demographic and Health Survey 2009.
In addition, the country still faces a significant burden of disease from communicable and non-communicable conditions, and from injuries including those that result from violence. The common leading causes of death and disability are shown in Table 3 below.
Table 3. Leading Causes of Death and Disability in Kenya, 2009
Causes of Death Causes of Disability
Rank Disease or injury % total deaths Rank Disease or injury % total DALYs
1 HIV/AIDS 29.3 1 HIV/AIDS 24.2
2 Conditions arising during perinatal period
9.0 2 Conditions arising during perinatal period
10.7
3 Lower respiratory infections 8.1 3 Malaria 7.2
4 Tuberculosis 6.3 4 Lower respiratory infections 7.1
5 Diarrhoeal diseases 6.0 5 Diarrhoeal diseases 6.0
6 Malaria 5.8 6 Tuberculosis 4.8
7 Cerebrovascular disease 3.3 7 Road traffic accidents 2.0
8 Ischemic heart disease 2.8 8 Congenital anomalies 1.7
9 Road traffic accidents 1.9 9 Violence 1.6
10 Violence 1.6 10 Unipolar depressive disorders 1.5
Source: GOK 2010. Review of the Kenya Health Policy Framework, 1994–2010.
This trend in the health status is attributed to a number of contextual factors. Specifically, despite noted decreases of some indicators, the population growth rate has remained high, at 2.4 per cent per annum, including a large young and dependent population that is increasingly urbanised. Although there were improvements in Gross Domestic Product (GDP) and a reduction in the percentage of the population living in absolute poverty (especially in urban areas) in the period under review, absolute poverty levels remained high, at 46 per cent. Literacy levels reached 78.1 per cent, although inequalities in age and geographical distribution persist. Gender disparities remain significant, with the Gender Inequality Index, the measure of disparity on health, empowerment and labour market stood at 0.618 and ranking 130 out of 146 countries worldwide in 201210. Finally, security concerns persist in some areas of the country, making it difficult for communities to access and use existing services. Gender-based crimes also persisted with reported rape and defilement cases increasing from 3,228 in 2009 to 4,100 in 201211 .
2.2. Progress in Overall Health Status
2.2.1 Status of key health indicatorsDuring the previous policy period, interventions were introduced in the health sector to address key challenges, such as maternal and child health and nutrition, HIV/AIDS and TB, malaria, and the emerging threat of NCDs, with mixed results.
Coverage of critical interventions related to maternal health either stagnated or declined, with improvements seen only in the use of modern contraceptives (33% to 46%). On the other hand, although child health interventions improved in coverage during this period, reports indicate that ill health among children remains high.
HIV/AIDS control and management showed progress, with evidence of declining incidence, prevalence, and mortality. However, differences persist in coverage of interventions with regard to age, sex, geographical location and among high risk groups. Although efforts to control TB were hampered by the HIV epidemic, there were improvements on some key indicators, including case notification, case detection, and treatment successes……. However, the emergence of drug-resistant strains since 2005, particularly in males, is a key challenge. There is also evidence of a reduction in malaria-related mortality, attributed to the scaling up of effective interventions, such as Insecticide Treated Nets (ITNs), Intermittent Prophylaxis Treatment (IPTp), and Inside Residual Spraying (IRS). High coverage has been achieved in interventions addressing Neglected Tropical Diseases (NTDs), although they still exist among different populations in the country.
Non-communicable conditions, which include cardiovascular diseases, cancers, respiratory diseases, digestive diseases, psychiatric conditions, and congenital anomalies, represent an increasingly significant burden of ill health and death in the country. These represented 50–70 per cent of all hospital admissions during the
10
UNDP, Human Development Report, 2013
11
previous policy period and up to half of all inpatient mortality. There is no evidence of reductions in these trends. Finally, the incidence of injuries and violence is also high, with mortality levels increasing over the years to account for 3.5% of all deaths in 2009, and mainly affecting the productive and younger population.
2.2.2 Risk factors to health
Risk factors to good health in Kenya include unsafe sex,12 suboptimal breastfeeding, underweight, alcohol and tobacco use, and obesity and physical inactivity, among others. Table 4 below shows the top 10 risk factors contributing to mortality and morbidity:
Table 4. Leading Risk Factors and Contribution to Mortality and Morbidity, 2009
Mortality (deaths) Burden (DALYs)
Rank Risk Factor % total deaths Rank Risk Factor % total DALYs
1 Unsafe sex 29.7 1 Unsafe sex 25.2
2 Unsafe water, sanitation, and hygiene
5.3 2 Unsafe water, sanitation, and hygiene
5.3 3 Suboptimal breast feeding 4.1 3 Childhood and maternal
underweight
4.8 4 Childhood and maternal
underweight
3.5 4 Suboptimal breast feeding 4.3
5 Indoor air pollution 3.2 5 High blood pressure 3.1
6 Alcohol use 2.6 6 Alcohol use 2.3
7 Vitamin A deficiency 2.1 7 Vitamin A deficiency 2.1
8 High blood glucose 1.8 8 Zinc deficiency 1.8
9 High blood pressure 1.6 9 Iron deficiency 1.2
10 Zinc deficiency 1.6 10 Lack of contraception 1.2
Source: GOK 2010. Review of the Kenya Health Policy Framework, 1994–2010.
DALYs = Disability-adjusted Life Years—Time lost due to incapacity arising from ill health
Available evidence suggests that there has been a reductions in unsafe sexual practices, with people increasingly embracing safer sex; this can be attributed to steady improvements in knowledge and attitudes regarding sexually transmitted infections (STIs) and conditions. Breastfeeding practices have also improved, with exclusive breastfeeding for up to six (6) months showing significant improvement. However, tobacco use remains high, particularly among the productive populations in urban areas and among males. Evidence shows that one in five males between ages 18–29 years and one in two males between 40–49 years use tobacco products. The same pattern is seen in the use of alcohol products, especially the impure products mainly
12 Unsafe sex leads to many conditions affecting health, such as HIV, reproductive tract
cancers/conditions and other sexually transmitted infections, unwanted pregnancies, and psychosocial conditions, among others.
found in the rural areas and urban slums. Cases of alcohol poisoning were reported during the previous policy period, and more than 2 per cent of all deaths in the country were attributed to alcohol use. Other health problems that appear to be gaining ground include obesity. It is estimated that 25 per cent of all persons in Kenya are overweight or obese, with the prevalence being highest among women in their mid- to late 40s and in urban areas.
2.2.3 Social determinants of health
Other health determinants include the literacy levels of women; nutrition; and access to safe water, adequate sanitation, and proper housing, roads and infrastructure among others. The literacy level of women has a strong correlation with a child’s health and survival. Although there has been an increase in women’s literacy levels in Kenya that peaked to 85.6% in 2013, progress towards improved child nutrition has stagnated. Cases of acute nutrition deficiencies have been recorded, including underweight indicators in children under five (5). However, there has been no change observed in the effects of chronic under-nutrition, such as stunting, wasting and underweight which stood at 37%, 7% and 16% respectively. Additionally, acute and chronically undernourished children are seen more in urban areas than rural areas of the country. The nutrition status of women has also stagnated. More than 12 per cent of adult women are stunted with an unacceptably low Body Mass Index (BMI). Under-nutrition is higher among women ages 15–19 years and in rural areas of the country, whereas obesity is more prevalent in urban areas.
There are improvements in availability of safe water sources and sanitation facilities. Population with access to safe water increased from 59% in 2008 to 62% in 2013, with rural areas registering 55% access in 2013. However, some regions, such as arid and semi-arid areas, still have poor access to safe water. Housing conditions have also improved, with the number of households using iron sheet roofing or better being 75% and households using earthen floors 47% respectively in 2008.
The proportion of the population in active employment grew marginally from 28.3% in 2009 to 32.4% in 2013; however, there has been an associated increase in the absolute numbers of the inactive population. Migration from rural to urban areas, most noted among people ages 20–34 years, has contributed to an increase in the urban population and their associated health risks mostly affecting the urban informal settlements in the country,.
2.3. Review of Health Investments
2.3.1 Health sector financial allocations and expenditure
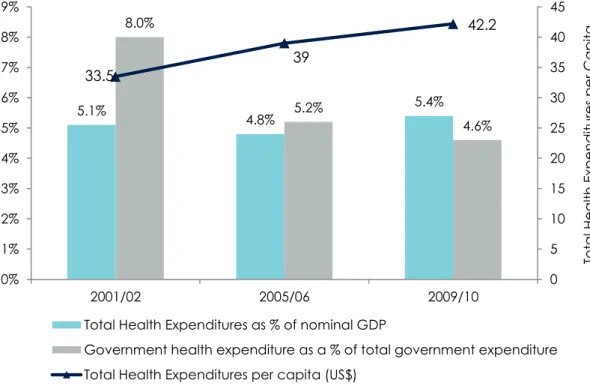
The government expenditure on health as a percentage of total government expenditures has remained fairly constant—between 6 and 8 per cent over the last decade. However, health expenditures as a proportion of GDP increased from 5.1% to 5.4 % while public expenditures as a proportion of general government expenditures have been reduced from 8.0% to 4.6% during the same period. The health sector
continues to be predominantly financed by private sector sources (including by households’ out-of-pocket (OOP) spending). The private sector share of total health expenditure (THE) has decreased from a high of 54 per cent in 2001/02 (of which 44.8% constitutes OOP expenditure) to 37 per cent in 2009/10, (of which 24% constitutes OOP expenditure). This decrease in OOP was primarily driven by increases in government and donor resources. Public sector financing has also remained constant over the last decade, at about 29 per cent of THE, whereas donors’ contribution has more than doubled, from 16 per cent in 2001/02 to 35 per cent in 2009/1013.
Per capita health expenditure also has increased, from $34 in 2001/02 to $42 in 2009/10, which is still below the recommended World Health Organization (WHO) target of $64 to meet a basic package of healthcare. There was evidence of improving fairness in the financing of healthcare, with higher contributions recorded among better-off individuals, and about 17 per cent of the total population had financial risk protection by the end of the policy period.
Figure 2. Overall Public Health Expenditure Trends: 2001−2010
Source: 2001/02, 2005/06, and 2009/10 National Health Accounts.
Evidence from the 2010 National Health Accounts demonstrated improvements in allocative efficiencies, with more services provided using the same amounts of resources in real terms. However, more resources were spent on management
13
2001/02, 2005/06, and 2009/10 National Health Accounts 5.1% 4.8% 5.4% 8.0% 5.2% 4.6% 33.5 39 42.2 0 5 10 15 20 25 30 35 40 45 0% 1% 2% 3% 4% 5% 6% 7% 8% 9% 2001/02 2005/06 2009/10 Tot a l H e a lth Exp e n d itu re s per Cap ita H u n d red s
Total Health Expenditures as % of nominal GDP
Government health expenditure as a % of total government expenditure Total Health Expenditures per capita (US$)
functions than on service delivery. In actual expenditures, there was limited real improvement in human resources for health and infrastructure during the previous policy period. While the actual numbers of these investments improved, the numbers per person stagnated or reduced, reflecting the stagnation of real resources for health. Improvements in real terms are notable only in the last two (2) years of the policy period (2009 and 2010). Now that health has been included as a basic right in the Constitution, it is expected that the level of investments will increase to meet this obligation.
2.3.2 Human resources
Human resources for health are defined as the stock of all people engaged in actions whose primary intent is to enhance health. An adequate, productive, and equitably distributed pool of health workers who are accessible is necessary for the effective delivery of healthcare.
There has been a general increase in the number of healthcare personnel over the years to peak to an average of 20.7 doctors and 159.3 nurses for every 100,000 persons by 2013 (See Table 5 below). This is below the WHO-recommended average of 21.7 doctors and 228 nurses per 100,000 people, which is the required standard for optimal delivery of services. Further, to deliver on the constitutional right to health, more personnel will be needed. A manpower development programme is therefore essential to ensure a continuous supply of health workers to the sector.
Table 5. Recent Trends in the Number of Registered Selected Healthcare Cadres
Health Personnel 2011 2012 2013 100,000 No. per pop. (2013) Doctors 7,549 8,092 8,682 20.7 Dentists 930 985 1,045 2.5 Pharmacists 2,432 2,076 2,202 5.3 Pharmaceutical Technologists 4,436 5,236 6,204 14.8 Nursing Officers 34,071 36,680 39,780 95.1 Enrolled Nurses 24,375 26,621 26,841 64.2 Clinical Officers 9,793 11,185 13,216 31.6
Source: Economic Surveys 2012, 2013, 2014.
Due to the lack of the application of appropriate health personnel deployment norms and standards, the distribution of workforce has tended to favour regions perceived to have high socioeconomic development, leaving marginalised and hard-to-reach areas at a disadvantage. Poor areas have fewer health facilities and are not preferred by health workers, while other regions report surpluses in staff. There is also a skewed urban-rural distribution of staff, with the urban areas having the highest proportions of staff at the expense of rural and remote areas where 70% of the population lives.
Advanced medical care is also mostly available in urban areas. Lack of essential tools and medical and non-medical supplies in health facilities, and a poor and unsafe working environment contribute to low morale and productivity of staff. Other challenges that affect performance and motivation include uneven remuneration and disparities in terms of reference among the same cadres, poor working conditions, unequal distribution of staff, and diminishing productivity among the health workforce.
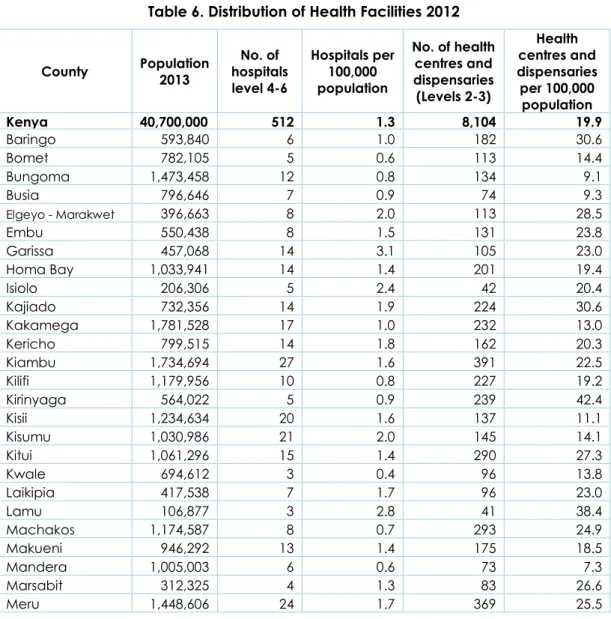
2.3.3 Infrastructure
The distribution of facilities across the 47 counties is illustrated in the table below (Table 6). The data demonstrates that there are significant regional disparities. However, the number of facilities does not imply that basic equipment and supplies are available. It is envisaged that the regional disparities will be addressed by equalisation and affirmative efforts as enshrined by the Constitution of Kenya 2010.
Table 6. Distribution of Health Facilities 2012
County Population 2013 No. of hospitals level 4-6 Hospitals per 100,000 population No. of health centres and dispensaries (Levels 2-3) Health centres and dispensaries per 100,000 population Kenya 40,700,000 512 1.3 8,104 19.9 Baringo 593,840 6 1.0 182 30.6 Bomet 782,105 5 0.6 113 14.4 Bungoma 1,473,458 12 0.8 134 9.1 Busia 796,646 7 0.9 74 9.3 Elgeyo - Marakwet 396,663 8 2.0 113 28.5 Embu 550,438 8 1.5 131 23.8 Garissa 457,068 14 3.1 105 23.0 Homa Bay 1,033,941 14 1.4 201 19.4 Isiolo 206,306 5 2.4 42 20.4 Kajiado 732,356 14 1.9 224 30.6 Kakamega 1,781,528 17 1.0 232 13.0 Kericho 799,515 14 1.8 162 20.3 Kiambu 1,734,694 27 1.6 391 22.5 Kilifi 1,179,956 10 0.8 227 19.2 Kirinyaga 564,022 5 0.9 239 42.4 Kisii 1,234,634 20 1.6 137 11.1 Kisumu 1,030,986 21 2.0 145 14.1 Kitui 1,061,296 15 1.4 290 27.3 Kwale 694,612 3 0.4 96 13.8 Laikipia 417,538 7 1.7 96 23.0 Lamu 106,877 3 2.8 41 38.4 Machakos 1,174,587 8 0.7 293 24.9 Makueni 946,292 13 1.4 175 18.5 Mandera 1,005,003 6 0.6 73 7.3 Marsabit 312,325 4 1.3 83 26.6 Meru 1,448,606 24 1.7 369 25.5
Migori 981,319 15 1.5 170 17.3 Mombasa 995,334 15 1.5 275 27.6 Murang'a 1,013,325 8 0.8 299 29.5 Nairobi 3,324,894 54 1.6 599 18.0 Nakuru 1,693,008 21 1.2 318 18.8 Nandi 802,347 6 0.7 169 21.1 Narok 908,597 6 0.7 147 16.2 Nyamira 640,844 7 1.1 126 19.7 Nyandarua 631,034 3 0.5 119 18.9 Nyeri 832,877 10 1.2 401 48.1 Samburu 239,416 3 1.3 70 29.2 Siaya 902,753 11 1.2 154 17.1 Taita Taveta 297,579 7 2.4 72 24.2 Tana River 258,261 2 0.8 62 24.0 Tharaka - Nithi 389,731 8 2.1 96 24.6 Trans Nzoia 875,697 7 0.8 91 10.4 Turkana 868,209 6 0.7 139 16.0 Uasin Gishu 940,112 12 1.3 165 17.6 Vihiga 594,457 6 1.0 75 12.6 Wajir 566,454 10 1.8 102 18.0 West Pokot 525,970 5 1.0 87 16.5
Source: Economic Survey 2013, 2014 and Ministry of Health, Master Facility List 2012
2.4. Review of the Outcomes of the Implementation of
the Previous Policy
The previous policy framework (KHPF 1994-2010) included interventions listed under seven policy imperatives and a comprehensive reform agenda. Overall, the outcomes from the implementation of those interventions are mixed, as detailed in the following sections.
2.4.1 Policy imperative: Ensure equitable allocation of government resources to reduce disparities in health status
A comprehensive bottom-up planning process was instituted in the second half of the policy period. However, other systemic issues, such as actual capacity to implement priorities, affected the prioritisation process. As a result, the interventions chosen did not necessarily lead to equitable access to essential curative and preventive services. Additionally, inadequate information on resources available made it difficult to link the microeconomic framework with the epidemiological information for a rational planning framework. A criterion was not established for geographic allocation of resources. Nevertheless, a standard resource allocation criterion for district hospitals and rural health facilities (health centres and dispensaries) was in use, but only for operations and maintenance. The norms and standards for health service delivery, which include human resources, equipment, and infrastructure, were developed in June 2006 but not operationalised. Allocation for essential medicines and supplies, based on facility type for lower-level facilities, was in place for most of the policy period. Some
regions of the country had negative experiences with the pull system, which was based on special drawing rights for pharmaceuticals and medical supplies from the Kenya Medical Supplies Agency (KEMSA).
2.4.2 Policy imperative: Increase the cost-effectiveness and cost efficiency of resource allocation and use
The burden of disease and cost-effectiveness analyses were not completely applied to determine priority interventions, but the process took into account the feasibility of implementation, the system’s capacity for implementation, and availability of resources to facilitate implementation. Data from the health management information system (HMIS) was used to determine the disease burden during the policy period, and this was also partially taken into consideration in setting priorities. While norms and standards defining the appropriate mix of personnel, operations, and maintenance inputs at all levels were in place, these were not utilised to ensure cost efficiency. Additionally, the health sector was not able to define and use unit costs for service delivery in its priority setting.
2.4.3 Policy imperative: Continue to manage population growth
Reproductive health services were strengthened across the country, and improvements were achieved in the availability and range of modern contraceptives for users, resulting in a gradual increase in contraceptive prevalence rates, as shown in Figure 3 below.
Figure 3. Trends in Contraceptive Use Rate among Married Women
*Data from the first five sources omit several northern districts, while the 2003 and 2008–09 KDHS surveys represent the whole country.
Information, education, and communication (IEC) materials and strategies were developed throughout the policy period, facilitating dissemination of family planning messages. There was also community involvement in the advocacy and dissemination of information, leading to increased access, availability, and uptake of services. This
7 17 27 33 39 39 46 0 5 10 15 20 25 30 35 40 45 50 1978 1984 1989 1993 1998 2003 2008–09 C o n tra c ep tive Preva len c e R a te ( C PR ) Year
contributed to a drop in the fertility rates from 5.4 in 1993 to 4.6 in 2003, a trend observed in most regions of the country Efforts were made to raise awareness of sexual and reproductive health among youth and a strategy put in place to roll out youth-friendly services in health facilities aimed at reducing unwanted teenage pregnancies.
2.4.4 Policy imperative: Enhance the regulatory role of government in all aspects of healthcare provision
Measures were put in place to decentralise governance and management decision-making to provinces and districts and leave the central level to focus on policy functions. However, their impact was limited due to the lack of a legal framework and weak management capacity in the decentralised units. The promulgation of the new Constitution in 2010 provided the necessary framework for entrenching devolution, although the Public Health Act has not been amended to reflect the stewardship role of the government in the current health delivery environment. The national-level and subnational-level regulatory boards were strengthened to improve their capacity to deliver. Gradual decentralisation of the management and control of resources to lower-level institutions was initiated through the Hospital Management Services Fund (HMSF) and the Health Sector Services Fund (HSSF).
2.4.5 Policy imperative: Create an enabling environment for increased private sector and community involvement in health services provision and finance
A framework for sector coordination and partnership was established in 2006 with the formalisation of the Kenya Health Sector-wide Approach (SWAp) process. Necessary instruments were defined, based on memoranda of understanding and a code of conduct to guide this dialogue and collaboration. In addition, the government supported health service delivery by non-state actors by providing access to public health commodities and medical supplies, and giving tax exemptions for donations in some of the facilities. The government also seconds critical public health staff to non-state facilities in specific cases, especially in under-served areas. However, the major beneficiaries of these initiatives have been faith-based service providers and not the private for-profit sector, which accounts for a 17.9% of all hospital admissions in 200714. Collaboration with private for-profit actors and alternative medicine practitioners is still weak. The government has also began providing health promotion and targeted disease prevention and curative services through community-based initiatives as defined in the 2007 Comprehensive Community Health Strategy (MOH 2006).
2.4.6 Policy imperative: Increase and diversify per capita financial flows to the health sector
The health sector was not able to expand the budgetary allocations, in real terms, to healthcare. However, strategies were put in place to influence resource allocation,
14
which included the development and costing of sector plans and active participation in resource allocation discussions. Nominal increases in allocations were achieved, especially in the period after 2006, and accelerated with the Economic Stimulus Program (ESP) in 2009. These increases are nominal, not real, and represent a shift in total sector financing away from government and households and towards donors. There was also a relative increase in financing for preventive and promotive healthcare as a proportion of recurrent versus development expenditures, implying less investment in real terms for medical care (see Figure 4). The result of this weak financing was that the opportunity cost of new programmes was high—with common programmes having less financing. Nevertheless, the financing of health services has increasingly become progressive. The National Hospital Insurance Fund has been transformed into a state corporation to improve effectiveness and efficiency. It has expanded its benefits package to include more clinical services and preventive and promotive services.
Figure 4. Public Health Expenditure Trends
Provision of insurance services has also expanded, with increases in the numbers of firms and the people covered. However, insurance coverage has remained limited to urban areas and to formal sector employees. The 10/20 policy on cost sharing introduced in 2004 reduced the contributions of users of facilities to a token amount in dispensaries and health centres. Further, exemptions for user fees were introduced for some specific health services, including treatment of children under five years old, inmates (prisoners) maternity services in dispensaries and health centres, TB and HIV/AIDS treatment in public health facilities, and immunisation services. Although this has significantly improved financial access to services, it has greatly reduced the
94% 94% 91% 86% 78% 87% 73% 59% 6% 6% 9% 14% 22% 13% 27% 41% 0% 10% 20% 30% 40% 50% 60% 70% 80% 90% 100% 0 5000 10000 15000 20000 25000 30000 2002 2003 2004 2005 2006 2007 2008 2009
Recurrent (KSh. millions) Development (KSh. Millions)
amounts of resources mobilised through user fees. Community-based health financing initiatives have not been applied effectively in the country, despite the existence of a relatively strong community-based Savings and Credit Cooperative Organisation (SACCO) system that could have acted as a backbone for community-based insurance initiatives.
2.4.7 Policy imperative: Implementation of the reform agenda
A number of reform initiatives were undertaken in the policy period, with mixed results:
i. Strengthening the capacity of the Ministry of Health (MOH) in planning and monitoring was achieved, although capacity limitations persist in other areas, such as leadership and management;
ii. An essential package of health has been defined with each strategic plan, though its application to guide service delivery priorities has been limited; iii. Innovative service delivery strategies have been applied, such as mobile
clinics, outreach programmes or community-based services, although their application has been limited to some areas and programmes;
iv. Subnational management functions have been strengthened to allow them to better facilitate and supervise service delivery, though this mandate has been exercised differently in the various provinces/regions and districts;
v. New statutes, laws, and policies guiding different aspects of the health sector have been introduced, though in an uncoordinated manner, and no update of existing laws has been undertaken;
vi. The sector has made some efforts to develop a health financing strategy to guide its resource rationalisation and mobilisation approaches;
vii. The human resource component has been strengthened through staff redistribution, an increase in numbers and a review of management structures of application of norms and standards, as well as motivation of existing staff. The sector also does not have an investment plan to guide the distribution and improvement of health infrastructure, leading to low investments for both new and existing infrastructure.
viii. Control of HIV/AIDS and other STIs is now coordinated through a semi-autonomous institution—the National AIDS Control Council (NACC)— which, prior to 2013 was managed through a different line ministry from the MOH. However, this administrative arrangement brought about challenges in coordinating financing and integrating the HIV response into the overall health agenda. However, the new political dispensation has placed the NACC under the MOH.
ix. While an explicit National Drug Policy existed, its implementation during the policy period was slow; only a fraction of the steps set out were realised. Some of the notable achievements include improvement in commodity management, and harmonisation of procurement, warehousing, and distribution mechanisms through KEMSA. An Essential Medicines List has been made available, although adherence to its use has been poor. Attempts to introduce a demand-driven procurement system were instituted, and there is evidence that it led to better availability of the required commodities in public health facilities.
x. HMIS architecture has improved information completeness. However, the information collected is still limited to a few conditions, and there are weaknesses in its completeness and quality. Additionally, information analysis, dissemination, and use is not well entrenched in the sector. The use of information sources beyond routine health management information remains weak.
xi. Cost containment and control strategies have not been wholly applied in the sector. Cost information is missing, and expenditure review data and recommendations have not been applied. Strategies to contract health services from providers were not employed as a means of cost control.
xii. There has been an increase in the amount and scope of systems; clinical and biomedical research and a number of operational decisions have been affected as a result of some of these studies. However, there is little collaboration among different research institutions, and poor linkage between research and policy.
xiii. The decentralisation of functions of the MOH to the provinces/regions and districts did not take place as anticipated. The central level has instead expanded as more vertical programmes were established, necessitating more programme management units. However, this is expected to change with the implementation of the new Constitution.
2.5. Overall Performance in Country Commitments
From the situation analysis, it is evident that progress towards attaining the stated health goals achieved mixed results. Notably, there has been slow progress towards attaining its commitments to MDG15 1 (eradicate extreme poverty and hunger), 4 (reduce child mortality rates), and 6 (combat HIV, malaria, and other diseases). There has been no progress towards MDG 5 (improve maternal health), and limited progress towards meeting the obligations in the African Union Maputo Plan of Action,16 which aimed to reduce poverty levels.
Regarding investments in health, there has been a limited increase in financing. Although the Paris Declaration on Aid Effectiveness17 was prioritised, implementation of the principles has remained poor. In addition, limited progress has been made towards achieving the commitments of the Abuja Declaration, in which countries committed to spend at least 15 per cent of their public expenditures on health.
This policy provides a framework to address some of these pending issues and build on successes to enable Kenyans to attain the right to the highest standard of healthcare, including reproductive health and the right to emergency treatment within Kenya’s system of devolved government.
15 United Nations Millennium Summit, 2000.
16 African Union Commission. 2006. Plan of Action on Sexual and Reproductive Health and Rights
(Maputo Plan of Action).
PART 2:
POLICY
CHAPTER 3: POLICY PROJECTIONS AND
FRAMEWORK
The health sector, in its endeavour to provide the desired highest standards of health as enshrined in the Constitution, has projected the achievable decline in mortality based on the situation analysis and assuming an appropriate policy framework. This section provides the policy projections, the components of the policy framework, and the underlying principles that will guide the health sector towards the realisation of the better health desired by all in Kenya
3.1. Policy Projections
The emerging trends point to the fact that non-communicable diseases, injuries, and violence-related conditions will increasingly, in the foreseeable future, be the leading contributors to the high burden of disease in the country, even though communicable diseases will remain significant. This implies that future policy frameworks will address the high disease burden arising from all three of these conditions.
The current total annual mortality is estimated at approximately 420,000 persons, out of which 64 per cent, 26 per cent, and 10 per cent are due to communicable, non-communicable, and injury conditions, respectively. As interventions to address communicable conditions reach maturity and attain sustained universal coverage, projections show that there will be reductions in this category of disease burden, although these reductions will be slow due to the large populations facilitating communicable disease transmission.
Future projections indicate that, if the current policy directions and interventions18 are effectively implemented, the overall annual mortality will decline by 14 per cent by 2030. The contribution to the annual mortality by disease domain would be different: communicable diseases would decline to 39 per cent and non-communicable and injuries conditions will increase to 47 per cent, and 14 per cent respectively. This represents a 48 per cent reduction in absolute deaths due to communicable conditions, but a 55 per cent increase in deaths due to non-communicable conditions and a 25 per cent increase in deaths due to injuries and violence, as shown in Figure 5.
18 That is, the existing policy directions and interventions that the Kenya Policy 2014−2030
Figure 5. Health Projections: 2011–2030 a) By disease domain
b) By disease condition
Source: Kenya Health Policy situation trends and distribution, 1994–2010, and projections to 2030. 0 10 20 30 40 50 60 70 0 50,000 100,000 150,000 200,000 250,000 300,000 2010 2015 2020 2025 2030 To ta l Po p ul a tio n ( mi lli o n s) To ta l D ea th s
Total deaths -Communicable Total deaths -Injuries Total deaths -Non-communicable Projected Population
0 10,000 20,000 30,000 40,000 50,000 60,000 70,000 80,000 90,000 100,000 2010 2015 2020 2025 2030 Deat hs HIV/AIDS Malaria Tuberculosis Cancers Cerebrovascular Disease Ischaemic Heart Disease Injuries
Current efforts to tackle malaria, TB, and HIV are expected to bear fruit in the short and medium term. Their contributions to the overall disease burden will be reduced significantly. However, other dormant or emerging conditions, such as dietary-related diseases, will continue to contribute immensely to the overall disease burden, and thus erode out any gains made through existing interventions on communicable diseases. To ensure significant reductions in the overall ill health and mortality in Kenya, continuous availability of resources and minimum population growth should be guaranteed.
The Kenya Health Policy 2014−2030 therefore seeks to ensure a significant reduction in the general ill health in the Kenyan population by achieving reductions in deaths due to communicable diseases by at least 48 per cent and reducing deaths due to non-communicable conditions and injuries to below levels of public health importance without losing focus on emerging conditions. This would translate to a 31 per cent reduction in the absolute numbers of deaths in the country, as opposed to only a 14 per cent reduction. This target corresponds well with current mortality trends in middle-income countries. WHO’s 2008 Global Burden of Disease estimates suggest a 0.68 per cent mortality rate in a representative group of middle-income countries (Argentina, Brazil, Indonesia, and Egypt) as compared to the 0.94 per cent mortality rate for Kenya (a 27% difference).
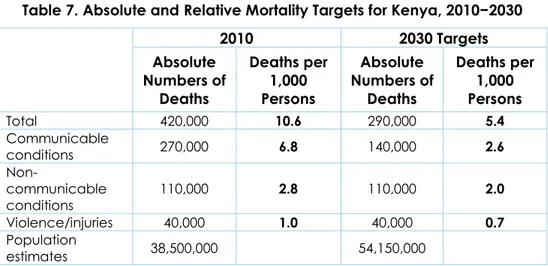
This level of mortality in 2030 represents a 50 per cent reduction in overall deaths per 1,000 persons when the population estimates are taken into consideration, translating to a reduction of 62 per cent for communicable conditions, 27 per cent for non-communicable conditions, and 27 per cent for violence/injuries (see Table 7).
Table 7. Absolute and Relative Mortality Targets for Kenya, 2010−2030
2010 2030 Targets Absolute Numbers of Deaths Deaths per 1,000 Persons Absolute Numbers of Deaths Deaths per 1,000 Persons Total 420,000 10.6 290,000 5.4 Communicable conditions 270,000 6.8 140,000 2.6 Non-communicable conditions 110,000 2.8 110,000 2.0 Violence/injuries 40,000 1.0 40,000 0.7 Population estimates 38,500,000 54,150,000
The scenarios and outcomes anticipated in Table 7 are achievable over the policy implementation period. However, an ingenious and logical arrangement of the applicable and interlinked policy elements into a comprehensive and coherent framework is important, as described in the next section.
3.2. Components of the Policy Framework
The health sector will adopt the policy framework presented in the following sections to address the prevailing and emerging health challenges that the country is facing. Figure 6 shows how high-priority policy investment areas (policy orientations) will operate to influence outcomes (policy objectives). It also delineates linkages among relevant contextual (environmental) factors that play a role in reaching specific policy goals.
Figure 6. Policy Framework for Health: Orientations, Principles, Objectives, and Goal POLICY ORIENTATIONS (& principles) Health Infrastructure Health Workforce Health Information Service Delivery Systems Health Products & Technologies Health Leadership Health Financing Minimise exposure to health risk factors Provide essential healthcare Strengthen collaboration with private and health-related sectors Reduce the burden of violence and injuries Halt and reverse
rising burden of NCDs Eliminate communicable diseases POLICY OBJECTIVES ”Attaining the highest possible standard of health in a responsive manner” POLICY GOAL Eq u ity Pe op le c e nt re d Pa rti c ip a tion Effi c ie nc y M u ltis e c tor a l Soc ia l a c c ou nt a b ilit y OUTPUTS Access to care Quality of care Demand for care
Research &Developmen t