Abstract— This paper aims to investigate the start-up delay at signalized intersections in Abu Dhabi (AD) city, UAE. Impact of external factors that may affect the start-up delay is examined including; left turn phasing sequences (split/lead/lag), movement turning (through/left), intersection location (CBD/non-CBD) and day time (peak/off-peak). A new technique of data collection was applied based on the automate records of license plate of vehicles and a comparison with the traditional video recorded technique was carried out. Data covered 66 approaches of 36 signalized intersections. The analysis showed that overall estimated mean value of the start-up delay is 2.201 sec. with a standard deviation of 1.823 sec. The t-test shows significant statistical difference in start-up delay between observations at through and left movements, at CDB and non-CDB area and at split and lead/lag phasing. However, no significant differences were found between peak and off-peak periods and between split and lead phasing. In general, lead/lag phasing sequences not only improved the overall delay at signalized intersection but also improved the start-up delay.
Index Terms— Start-up delay; Lead-lag phasing; left-turn phasing sequences; signalized intersections, Abu Dhabi city
I. INTRODUCTION
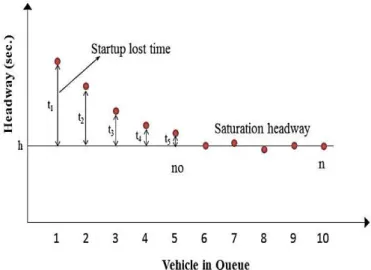
Capacity and delay are two of the commonly used measures of effectiveness (MOEs) in the evaluation of signalized intersections [1]. The startup delay is a part of the total delay time that occurs due to the implementation of the traffic signal control devices. At the beginning of each green time of the traffic signal phase, the first few number of queued vehicles experience start-up time losses that is made up of the response time of the drivers (perception and reaction time) to the change in signal indication along with the vehicle acceleration time to free-flow speed [2]. In this case, the headway time of the departure queued vehicles can be illustrated as shown in Figure 1. It shows that after a certain number of vehicles (no) (usually fall between the third and sixth vehicle) the headway time reaches its minimum value (h) which calls the saturated flow condition [3].
Based on the Highway Capacity Manual [3], the start-up delay takes place for the first four vehicles in a standing queue (i.e., no = 4) and from the fifth queued vehicle the saturation headway can be estimated. The start-up delay can be calculated as follows:
... . . (1)
Where: t = headway time – h (see Figure 1)
Figure 1: Headway time for the departure vehicles standing in a queue
The estimated value of the start-up delay and the contributing factors affecting its value were investigated in many cities around the world. However, the value of the start-up delay and the contributing factors has not been investigated in Abu Dhabi city (AD), the capital of the UAE. In addition, the impact of the sequences of the traffic signal especially the lead/lag signal phasing on the value of the start-up delay was not intensively investigated yet. Thus, this study aims to estimate the start-up delay value at AD signalized intersections. Also, it aims to investigate the impact of some factors on the start-up delay such as the turning movements (through/left), phasing sequences (lead/lag/split phasing), day time (peak /off-peak periods) and intersection location (CBD / non-CBD areas)
II. LITERATUREREVIEW
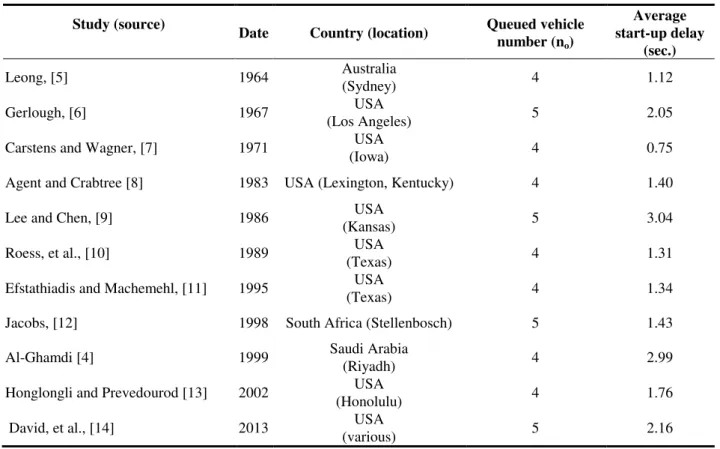
The startup delay at signalized intersections has been investigated in a significant number of prior studies. The typical observed value of the startup delay ranges from 1.0 Sec. to 2.0 sec [3]. However, in literature the estimated values of the start-up delay have a wide range between 0.75 and 3.04 sec. [4]. Table 1 summarizes the findings of the estimated values of the start-up delay from prior studies.
Start-up delay Estimation at Signalized Intersections:
Impact of Left-Turn Phasing Sequences
Table 1: Examples of the observed startup delays Study (source)
Date Country (location) Queued vehicle number (no) Average start-up delay (sec.) Leong, [5] 1964 Australia (Sydney) 4 1.12 Gerlough, [6] 1967 USA (Los Angeles) 5 2.05
Carstens and Wagner, [7] 1971 USA
(Iowa) 4 0.75
Agent and Crabtree [8] 1983 USA (Lexington, Kentucky) 4 1.40
Lee and Chen, [9] 1986 USA
(Kansas) 5 3.04
Roess, et al., [10] 1989 USA
(Texas) 4 1.31
Efstathiadis and Machemehl, [11] 1995 USA
(Texas) 4 1.34
Jacobs, [12] 1998 South Africa (Stellenbosch) 5 1.43
Al-Ghamdi [4] 1999 Saudi Arabia
(Riyadh) 4 2.99
Honglongli and Prevedourod [13] 2002 USA
(Honolulu) 4 1.76
David, et al., [14] 2013 USA
(various) 5 2.16
Several factors that affect the value and distribution of the startup delay were also investigated in the prier studies. These factors include the turning movements (trough, left and U-turn), queue length, intersection geometry and location, time of the day, weather condition, visibility of traffic light, phasing timing and sequence, etc. Regarding the turning movements, it was found that the startup delay of the through movement is larger than that of the protected left-turn movement [13]. In addition, high standard deviation values were observed for both movements and reflect a big variation of the startup delay among drivers. However, other studies (i.e., [15]; [16]) found no significant differences in startup delay between through and left-turn movements. Also, no significant differences between peak and off-peak hours in terms of the start-up delay.
The impact of the geometric parameters was also investigated by Bonneson [17]. The results found that the left-turn radii affect the headway of the queued vehicles. The larger radii of the left-turn paths resulted lower headways. In addition, it is indicated that queue length per cycle and lane volume has a negative effect on the headway of the first twelve vehicles. This finding implies that the startup delay of long queue is smaller due to the higher traffic pressure of the long queues. Al-Ghamdi [4] showed that the startup delay of two lane approach is significantly higher than that in the three lane approaches.
Honglongli and Prevedourod [13] showed that a weak negative correlation between the startup delay and queue length and the ANOVA tests indicated that the startup delay is not sensitive to the queue length. Long [16] found that no significant impact of the queue length, number of lanes, intersection location and peak period on the observed average startup delay. In addition, no significant differences were found in average startup delay between queues that contain trucks and queues with passenger vehicles also between
different sites with level approach and sites on a 5% upgrade. Regarding the weather condition, Sun et al. [18] observed that the startup delay increased by 21-31% in rainy weather compared by clear weather and no significant differences was found between light-medium rainy weather and clear weather. The studies that addressed the impact of the left-turn phasing sequence on the startup delay are relatively few compared to the other investigated factors. Most of these studies concentrated on the impact of the permissive-and-protected left turn (PPLT). Noyce et al. [19] and NCHRP report [20] found that no differences in the startup delay were found due to the type of PPLT signal display. However, Brehmer [2] found that the average startup delay was significantly influenced by the PPLT signal phasing. On the other hand, Chris Sheffer et al. [21] compared startup delay between lead and lag protected-only phasing. It was found that that both the mean start-up lost time and fourth vehicle crossing time were significantly lower for lag left turns. In addition, Upchurch and Wright [22] evaluated delays at one intersection for three different lead and lag phasing. It was found that left-turn delay for protected/permitted lead phasing is lower than for protected/permitted lag phasing. However, the study did not consider signal progression adjustments that may have affected the platooning of upstream traffic.
In terms of intersection capacity, the prior studies proved the positive impact of installing lead-lag phasing on the capacity. Grover [23] documented a 30 % to 50% reduction in overall vehicle delay (means 30% to 50% increase in capacity). However, other studies presented the negative impact of such left-turn phasing system on the safety performance of the signalized intersections. Randy et al. [24] stated that in the one-year period before installation of lead-lag left-turning 44 accidents occurred, whereas 78 occurred in the year after in Kentucky intersections and about 69% of these accidents occurred in the first 6 months.
III. START-UPDELAYMODELDEVELOPMENT Figure 2 illustrate the concept of the model development to find the startup delay (d) value of each traffic cycle at a signalized intersection approach. From this figure the startup delay can be calculated form the following equation:
Where: d = start-up delay value
no = number of vehicle experience with startup delay
n = number of queued vehicle taken into consideration in the analysis
tn = the elapsed time from the beginning of the
green light until the vehicle “n” standing in the queue cross the reference line
Figure 2: Concept of developed startup delay estimation model
In this study, “no” and “n” are taken 4 and 10, respectively. It means that the startup delay will be considered from the first four vehicles and the saturation flow starts from the fifth vehicle to the tenth queued vehicle. Accordingly, equation (2) will be as follows:
IV. CASESTUDYSELECTIONANDDATA
COLLECTION
Lead-lag left-turn phasing were implemented in year 2010 at about 38 signalized intersections in AD city in order to improve its performance. At these intersections two approaches are operating as lead/lag left turn phasing and the other approaches are working as split phasing. The leading phase takes place when the left-turn starts at the beginning with though phase. The lag phase takes place when the left-turn at the end of the trough phase. Split phasing takes place when the left-turn and trough movements are start and end with each other.
In this study, about 66 approaches located at 36 different intersections were selected to be taken as case study. These intersections were selected to cover different geometric and operational parameters that may affect the start-up delay value and that will be involved in the analysis process such as; 1) intersection location (CBD / non-CBD area), 2) phasing type (lead/lag/split phasing), and 3) number of through lanes, number of left lanes. About 12,517 traffic signal cycles were involved in the analysis, 6,202 traffic cycle during the peak periods and 6,310 cycles during off-peak periods. These two periods are defined based on the day time as shown in Table 2. It is worth mentioning that the selected approaches have been selected to be similar in some parameters such as; 0% gradient, 0% heavy vehicles and some lane width. Therefore, the impact of these factors in the estimated value of the start-up delay not included in the collected data. Table 3 shows the studied number of intersection approaches under each category and the corresponding number of traffic cycles.
Table 2. Day time classification for the headway time data
Day time Peak period Off-peak period
From To From To
Morning 6:00am 9:00am 9:00am 11:00am
evening 2:00pm 4:00pm 4:00pm 16:00pm
Table 3. Number of studies intersection approaches for each category
No. Intersection approach category Number of studies approaches No. of studies traffic cycle 1 Intersection location CBD 16 2,660 non-CBD 50 9,858 2 No. of through lanes 2 5 538 3 41 8,015 4 20 3,966 3 No. of left lanes 0 6 1,027 1 47 9,114 2 13 2,378 4 Traffic signal phasing type Split 37 6,243 lead 16 2,202 lag 13 6,243
The majority of the collected data in prior studies used the manual technique from videotapes and stopwatch. However, in this study, a new technique of data collection was implied. This technique employed the image processing that taken from the red-light violation cameras (TVR cameras) which automatically record the license plan for each vehicle cross the stop line during red light. In our case, the system was adapted to record the time when a vehicle crossed the stop line from the start of green time for each lane separately. Then headway time can be accurately calculated. About 125,170 of headway time were obtained by this method.
On the other hand, the traditional video recording and stop watch technique was used at about 16 different approaches was applied to determine headway times. The collected data by this will be used to check and accuracy of the TVR cameras recording times and then to calibrate the time value of the first vehicle in the queue.
.. . . (2)
V. DATAANALYSIS
A. Headway Time
The mean value of the observed headway time of the queued vehicle based on the position of the vehicle in the queue is shown in Figure 3 from the data obtained from TVR camera. Table 4 shows summary of the observed headway time statistics.
Figure 3: Mean value of the observed headway time for queued vehicles
Table 4. Statistical parameters of headway time
Vehicle position in the queue Headway mean (sec.) Standard deviation (sec.)
Maximum Minimum Mode Median Skewness
1 4.051 0.925 5.367 0.584 3.852 4.232 -0.0010 2 2.437 0.838 5.158 0.758 2.106 2.331 0.0004 3 2.256 0.927 5.367 0.498 1.903 2.043 0.0010 4 2.026 0.741 5.749 0.487 1.607 1.903 0.0006 5 1.890 0.730 4.384 0.524 1.513 1.758 0.0007 6 1.896 0.794 4.539 0.658 1.451 1.717 0.0010 7 1.849 0.759 4.316 0.421 1.591 1.688 0.0009 8 1.809 0.755 4.259 0.398 1.357 1.653 0.0009 9 1.805 0.735 4.025 0.342 1.451 1.654 0.0008 10 1.906 0.897 5.101 0.450 1.513 1.681 0.0011
Table 5 shows the mean value of the observed headway by the two methods of the data collection. It shows that no significant different between the headway time for the second vehicle to the 10th vehicle in the queue. The observed difference for the first queued vehicle can be justified due to
the taken time for the vehicle to fully cross the stop line and the TVR camera recognize and record the plat number. Thus, the difference value of 1.103 sec. (i.e. = 4.051-3.038) can be taken as an adjustment value in the calculation on the start-up delay.
Table 5. The mean value of the observed headway time based on the two different data collection methods
Data collection method Vehicle position in the queue (sec.)
1 2 3 4 5 6 7 8 9 10
Video recording 3.038 2.465 2.213 1.945 1.916 1.901 1.858 1.835 1.782 1.889 TVR camera 4.051 2.437 2.256 2.026 1.890 1.896 1.849 1.809 1.805 1.906
B. Estimating the Overall Value of Start-up Delay and
Saturation Flow Rate
Table 6 shows the statistical parameters of the estimated value of the start-up delay. The estimated mean value of the start-up delay was adjusted due to the usage of TVR camera as discussed before. The sample size shown in the table represents the number of traffic signal cycles that taken at
each intersection approach category. In general, the estimated start-up delay vale and its standard deviation for all approach types are close except the case of lag phase approach has low mean start-up delay value and higher standard deviation. However, the statistical test shown be applied to identify whether there is a significant difference or not which will be discussed in the next subsection.
Table 6. Start-up delay statistical parameters for different approach categories of signalized intersections
Approach category Sample
size
Mean (sec.)
Std. Dev.
(sec.) Max. Min. Mode Median
All intersection approaches 12,916 2.201 1.823 8.705 0.003 3.308 3.199 Movement turns Through 8,907 2.232 1.817 8.705 0.007 4.468 3.235 left 4,004 2.133 1.834 8.689 0.003 4.676 3.122 Intersection location CBD 2,863 2.295 1.802 8.483 0.007 4.681 3.300 non-CBD 10,048 2.175 1.828 8.705 0.003 3.308 3.172 Phasing Sequences Split 6,497 2.265 1.806 8.705 0.007 3.308 3.264 Lead 4,122 2.299 1.780 8.689 0.008 4.108 3.311 Lag 2,292 1.844 1.902 8.417 0.003 1.405 2.774 Day time Peak 6,479 2.241 1.832 8.705 0.007 6.916 3.250 Off-peak 6,200 2.209 1.812 8.483 0.003 4.628 3.222
For more details in the impact of phasing sequence, the start-up delay values of left turn only were extracted and the statistical parameters for different phasing sequence s are estimated as shown in Table 7. It shows that the start-up delay value of let turn movement in case of lead phasing is significantly higher that both split and lag and lag phasing has
the lower value of start-up delay. This result can be interpreted as the drivers in the left turn lane in case of lag phasing are expecting the on-set of the green light because the green of the thought movement has been already turned on. Then they are ready to move or sometimes they anticipate the on-set of green.
Table 7. Start-up delay statistical parameters for left turn movement with different phasing sequences
left turn phasing Sample size Mean (sec.) Std. Dev. (sec.)
Max. Min. Mode Median
left lane with split phasing 1,494 2.153 1.843 8.407 0.030 4.208 3.096
left lane with lead phasing 1,524 2.325 1.772 8.689 0.012 5.492 3.363
left lane with lag phasing 988 1.807 1.870 8.247 0.003 5.259 2.724
From the observed headway, the saturation flow rate (SFR) could be also estimated. The SFR is very important parameter in the evaluation of the traffic performance at signalized intersections and can be calculated from the following equation:
. . . . . . . . . (4)
is the mean value of the observed headway for queued vehicles started by the 5th vehicle in the queue to the 10th vehicle. Table 8 shows the summary of the estimated parameters of the SFR. More analysis in SFR doesn’t take because it is out of current study objective.
Table 8. Statistical parameters of the saturation flow rate
Sample size Mean
(veh/hr/lane)
Std. Dev.
(veh/hr/lane) Max. Min. Mode Median
11,786 1927 276 2494 1210 1981 1923
C. Investigating the Significant Factors Affecting the
Start-up Delay
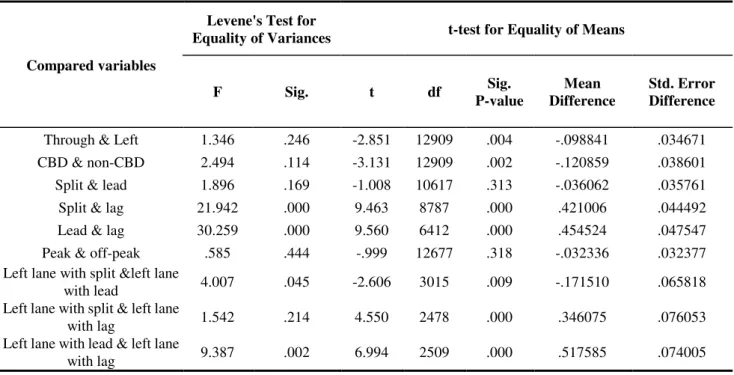
The statistical t- test was employed to test the significant differences between two pairs of the independent variables. For example, between the trough and left movements, CBD and non-CBD locations, Lead and lag phasing, etc. The statistical software program SPSS was used in this analysis. Table 9 shows summary of the output results of the statistical
tests. It shows that there are significant differences between through and left turn movements, CBD and non-CBD, split and lag, lead and lag phasing at significant level of 95%. However, there are not significant differences between peak and off-peak periods and between lead and split phasing. This result can be interpreted as in the both cases of split and lead phasing the green light starts for the left and through movements at the same time when the start-up delay takes place.
Table 9: Statistical results of the comparison among variables
Compared variables
Levene's Test for
Equality of Variances t-test for Equality of Means
F Sig. t df Sig. P-value Mean Difference Std. Error Difference
Through & Left 1.346 .246 -2.851 12909 .004 -.098841 .034671
CBD & non-CBD 2.494 .114 -3.131 12909 .002 -.120859 .038601
Split & lead 1.896 .169 -1.008 10617 .313 -.036062 .035761
Split & lag 21.942 .000 9.463 8787 .000 .421006 .044492
Lead & lag 30.259 .000 9.560 6412 .000 .454524 .047547
Peak & off-peak .585 .444 -.999 12677 .318 -.032336 .032377
Left lane with split &left lane
with lead 4.007 .045 -2.606 3015 .009 -.171510 .065818
Left lane with split & left lane
with lag 1.542 .214 4.550 2478 .000 .346075 .076053
Left lane with lead & left lane
VI. CONCLUSIONS
This study mainly aims to estimate the value of the start-up delay and to investigate the factors affecting tart-up delay at AD signalized intersections. The data analysis showed that the estimated mean value of the start-up delay is 2.201 sec overall the investigated sites. The start-up delay is significantly differences between though and left turn movements, CBD and non-CBD locations, split and lag, lead and lag phasing at significant level of 95%. However, there are not significant differences between peak and off-peak periods and between lead and split phasing.
Estimated start-up delay at CBD area is a little higher that at non-CBD areas. Lag phasing approaches have low value of start-up delay (1.844 sec.) compared to split phasing approaches (2.265 sec.). left-turn with lag phasing have lower start-up delay (1.807 sec.) than left-turn with lead phasing (2.325 sec.).
REFERENCES
[1] Special report no. 209: Highway Capacity Manual. Third Edition. TRB, National Research Council, Washington DC, (1994). [2] Brehmer C.L., Kacir, K.C., Noyce, D. A., Manser M. P., 2003.
Evaluation of Traffic signal displays for protected/permissive left-turn control. National Cooperative Highway Research program NCHRP Washington D.C. Report 493, March (2003).
[3] Highway Capacity Manual 2000, TRB, National Research Council, Washington, DC, (2000).
[4] Al-Ghamdi A. S. Entering headway for through movements at urban signalized intersections. Transportation Research record 1675, 1999, pp.42-47, (1999).
[5] Leong, H. J. W. Some aspects of urban intersection capacity. Proceedings 1964, Australia Road Research Board, Vol. 2 Part 1, 1964, PP. 305-338, (1964).
[6] Gerlough, D. L., Wagner, F. A. Improved Criteria for Traffic Signals at Individual Intersection. Highway Research Board, National Research Council, NCHRP Report 32: Washington, D. C. pp. 42. (1967) [7] Carstens, R. L. Some Traffic Parameters at Signalized Intersections”.
Traffic Engineering, Vol. 41, No. 11, pp. 33-36, (1971).
[8] Agent, K., and J. Crabtree, 1983. Analysis of Lost Times at Signalized Intersections. Kentucky Transportation Research Program, University of Kentucky, Lexington, (1983).
[9] Lee, J. and Chen, R. L. Entering Headway at Signalized Intersections in a Small Metropolitan Area. Transportation Research Record 1091, TRB, National Research Council, Washington, D.C., pp.117-126, (1986).
[10]Roess, R. P., J. M. Papayannoupoulis, J. M. Ulerio, and H. S. Levinson, 1989. Levels of Service in Shared-Permissive Left-Turn Lane Groups at Signalized Intersections. Report DTFH 61-87-C-00012. Transportation Training and Research Center, Polytechnic University, Brooklyn, N.Y., (1989).
[11]Efstathiadis S., Machemehl, R. Congress avenue regional arterial study: Variability of departure headways. Center for transportation research, University of Texas, research report no. 60019-2, (1995). [12]Jacobs, N. The determination of star-up lost time and saturation flow
rates at signalized intersections (in Afrikaans). Final year thesis. Department of civil engineering, University of Stellenbosch (1998). [13]Honglongli and Prevedourod, P. D. Detailed observations for
saturated headways and start-up lost time. TRB (2002).
[14]David S. H., Kevin P. H., Steven D. S., Joshua S., Patrick M., Halston T. Implications of Distracted Driving on Start-Up Lost Time for Dual Left-Turn Lanes. Journal of Transportation Engineering vol. 139 No. 9 p. 923-930, (2013).
[15]George, Earl T., Jr. and Frank M. Heroy, Jr. Starting response of traffic at signalized intersections. Traffic Engineering, Institute of Traffic Engineering, Washington, D.C., pp. 39-43 (1966).
[16] Long, G. Startup delays of queued vehicles. The 84th annual meeting of the Transportation Research Board (TRB-2005) Washington, D.C., January, (2005).
[17] Bonneson J.A., 1992. Study of headway and lost time at single-point urban interchanges. Transportation Research Record 1365, TRB National Research Council, Washington, D. C., 1992, pp. 30-39. [18] Sun, H., Yang, J., Wang. L., Li, L., Wu, B. 2013. Saturation flow rate
and start-up lost time of dual-left lanes at signalized intersection in rainy weather condition. Proceedings of the 13th COTA International Conference of Transportation Professionals, 2013.
[19] Noyce, D.A., Farmbro D.B., Kacir, K.C. 2000. Traffic characteristics of protected/permitted left-turn signal display. The 79th annual meeting of the Transportation Research Board TRB, Washington, D.C., January 2000.
[20] NCHRP project 3-54. Evaluation of traffic signal displays for protected-permitted left turn control. National Cooperative Highway Research program NCHRP, Project 3-54 February 2000.
[21] Chris Sheffer, P. E., Janson, B. N., 1999, “Accident and capacity comparisons of leading and lagging left-turn signal phasing. Presented Transportation Research Board TRB-1999 meeting Washington, D.C. January 1999.
[22] Upchurch J. and C. H. Wright. Before and After Comparison of Leading Exclusive and Permissive/Exclusive Lagging Left-turn Phasing. In Transportation Research Record 1368, TRB, National Research Council, Washington, D.C., 1992.
[23] Grover, A. Minimize Delay, Maximize Progression with Protected Permissive Lead/Lag Phasing”, Technical Workshop. Inland Empire Section of ITE, December 14, 1995.
[24] Randy B. Machemehl and Ann M. Mechler. Comparative Analysis of Left-turn Phasing Sequencing. Federal Highway Research Report 258-2. 1983.
[25] Buckholz, J. (1993). The 10 major pitfalls of coordinated signal timing. ITE Journal, 63(8), 26-29.
[26] Al-Ghafli, A., Garib, A., Sarhan, M., & Al-Harthi, H. (2013) Effect of Signal Phase Sequences on Signalized Intersection Safety Performance Case Study from Abu Dhabi, U.A.E. Published in 17th IRF World Meeting & Exhibition, Riyadh, Saudi Arabia