University of South Florida
Scholar Commons
Graduate Theses and Dissertations Graduate School
January 2012
Sensitivity of Value Added School Effect Estimates
to Different Model Specifications and Outcome
Measures
Bryce L. Pride
University of South Florida, [email protected]
Follow this and additional works at:http://scholarcommons.usf.edu/etd
Part of theEducational Assessment, Evaluation, and Research Commons, and theEducation Policy Commons
This Dissertation is brought to you for free and open access by the Graduate School at Scholar Commons. It has been accepted for inclusion in Graduate Theses and Dissertations by an authorized administrator of Scholar Commons. For more information, please contact
Scholar Commons Citation
Pride, Bryce L., "Sensitivity of Value Added School Effect Estimates to Different Model Specifications and Outcome Measures" (2012).Graduate Theses and Dissertations.
Sensitivity of Value Added School Effect Estimates to Different Model Specifications and Outcome Measures
by
Bryce L. Pride
A dissertation submitted in partial fulfillment of the requirements for the degree of
Doctor of Philosophy
Department of Educational Measurement and Research College of Education
University of South Florida
Co-Major Professor: John M. Ferron, Ph.D. Co-Major Professor: Robert F. Dedrick, Ph.D.
Yi-Hsin Chen, Ph.D. Danielle Dennis, Ph.D.
Date of Approval: November 7, 2012
Keywords: sensitivity analysis, Gain Score Model, Layered Effects Model, educational accountability
Acknowledgments
First, I thank God for blessing me with countless experiences and relationships that have developed me towards the embodiment of 2 Peter 1:3-11. In addition, my loving wife deserves a great deal of praise for the assistance of her “eagle-eye” and continual dedication. She has sacrificed much more than anyone could have expected and it would not have been possible to achieve my goals and dreams without her support and encouragement. To her, I am forever indebted. I also thank my physical and spiritual family for their prayers, support, and encouragement throughout this life changing journey.
I thank my professors and committee for providing me with the knowledge,
understanding, and guidance in the development of my craft, as well as my fellow colleagues on the same journey. A special thanks for my co-advisors and mentors, Dr. John Ferron and Dr. Robert Dedrick. Both have provided continual guidance, direction, and experiences that have developed my metacognitive processes as a journeyman researcher. For their patience, time, and insight into this dissertation, I am forever grateful.
i Table of Contents List of Tables ... iv List of Figures ... ix Abstract... ...x Chapter I: Introduction ...1
Statement of the Problem ...1
Rationale for the Study ...4
Purpose of the Study ...8
Research Questions ...9
Significance of the Study ...10
Definition of Terms...11
Delimitations ...13
Limitations ...13
Organization of Remaining Chapters ...14
Chapter II: Literature Review ...15
Overview ...15
Conceptual Framework: Educational Accountability Models ...16
Status and Improvement Models ...17
Growth Models ...18
Value Added Models ...19
Challenges and concerns with Value Added Models ...21
Value Added Modeling Characteristics and Modeling Approaches ...24
Data points ...25 Hierarchical levels ...25 Growth description ...26 Covariate use ...26 School effects ...26 Persistence of effects ...27
Pure Nested Model ...27
Cross-Classified Random Effects Model ...29
Sensitivity of Value Added Effects...36
Value added teacher effects ...37
ii
Literature Review Summary ...42
Chapter III: Method ...44
Overview ...44
Purpose of the Study ...44
Research Questions ...45
Overview of the Research Design ...46
Population and Sample ...47
Variables and Measures ...52
Data Collection Procedures ...55
Data Analysis ...55
Univariate analyses ...56
Multivariate analyses ...56
Bivariate analyses ...58
Model Specification and Estimation ...59
Gain Score Model specification ...59
Gain Score Model estimation ...62
Layered Effects Model specification ...62
Layered Effects Model estimation ...66
Chapter IV: Results ...68
Overview ...68
Preliminary Results ...68
Missing Data ...73
Primary Results ...84
Primary results for Gain Score Models in mathematics ...85
Intraclass Correlation Coefficient (ICC) ...87
Random school effects in mathematics ...88
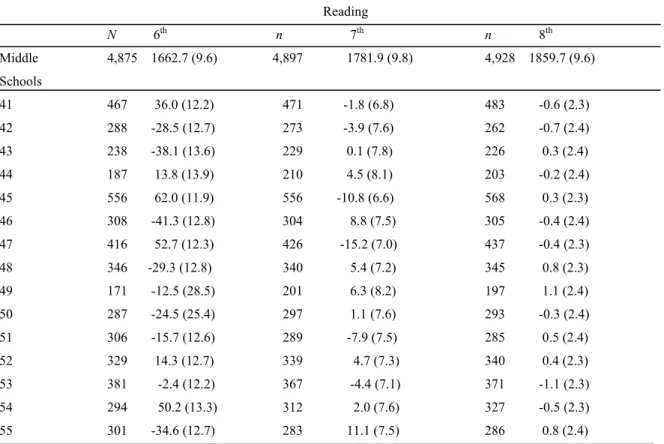
Primary results for Gain Score Models in reading...91
Intraclass Correlation Coefficient (ICC) ...93
Random school effects in reading ...93
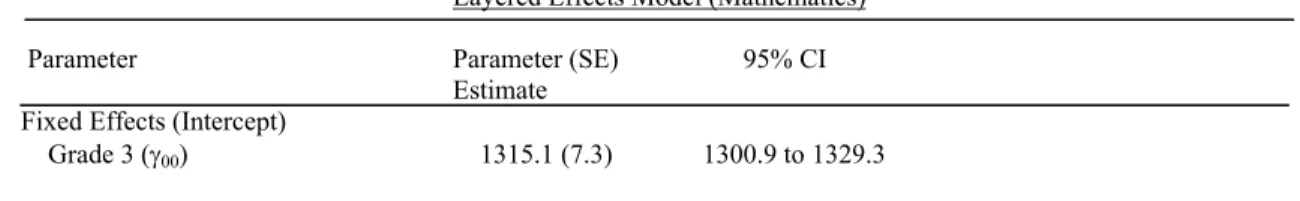
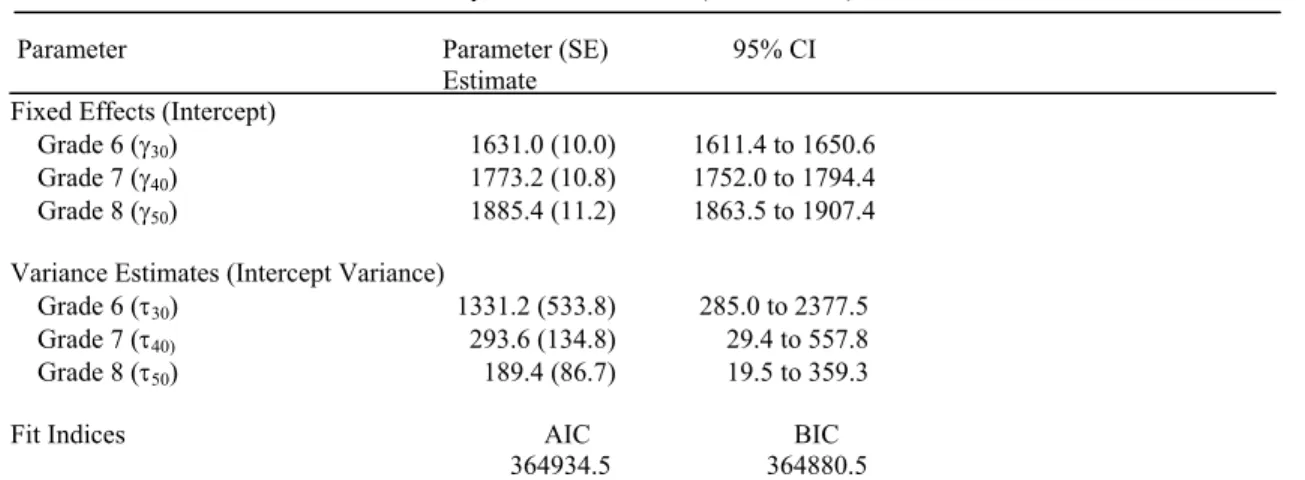
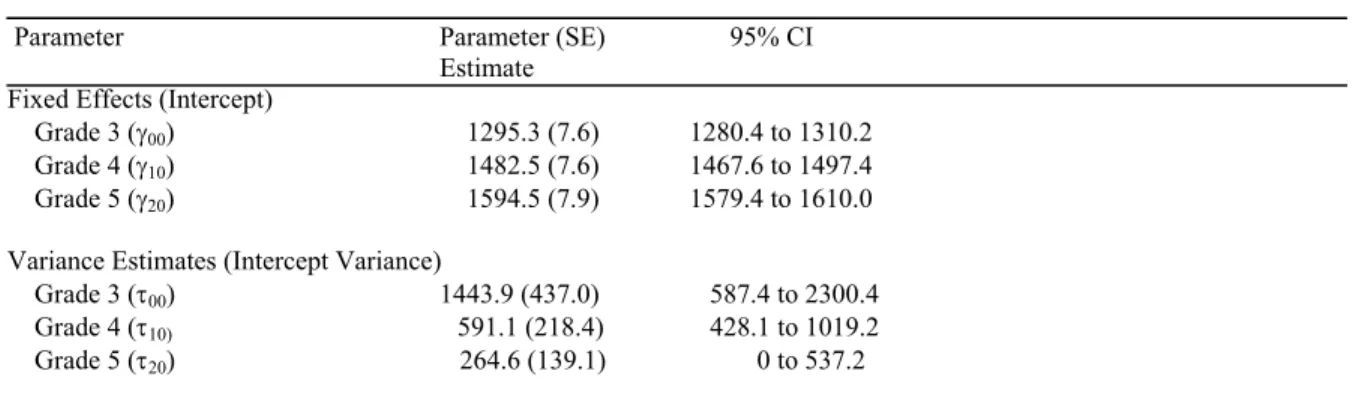
Primary results for Layered Effects Models in mathematics ...96
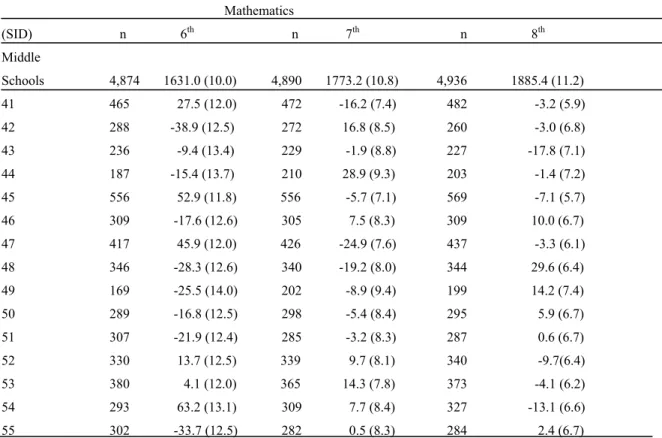
Random school effects in mathematics ...99
Primary results for Layered Effects Models in reading ...102
Random school effects in reading ...104
School effects correlations ...109
Gain Score Model (outcome measures) ...109
Layered Effects Model (outcome measures) ...109
Mathematics (model specifications) ...110
Reading (model specifications) ...111
School rankings ...116
Gain Score Model (mathematics) ...116
Gain Score Model (reading) ...119
iii
Layered Effects Model (reading) ...124
School ranking correlations ...127
Gain Score Model (outcome measures) ...127
Layered Effects Model (outcome measures) ...127
Mathematics (model specifications) ...127
Reading (model specifications) ...133
Summary ...133
Chapter V: Discussion ...135
Overview ...135
Research questions ...136
School Effect Relationship by Outcome Measure ...137
School Effect Relationship by Model Specification ...139
School Ranking Relationship by Outcome Measure ...141
School Ranking Relationship by Model Specification ...142
Limitations of the Study...143
Directions for Future Research ...144
Closing Remarks ...146
References ...149
Appendices ...157
Appendix A: SAS Code for Gain Score and Layered Effects Models ...158
Appendix B: Cross-Classification of Students in Elementary and Middle School ...159
Appendix C: Scatter-Plot of Reading by Mathematics ...161
Appendix D: Missing Data in Mathematics and Reading ...167
Appendix E: Violation of Model Assumptions ...171 About the Author ... End Page
iv
List of Tables
Table 1 Comparisons of Various Value Added Models and
Their Features ...32
Table 2 Hypothetical Data Set Illustrating the Z-Matrix Needed for the Layered
Effects Models ...65
Table 3 Descriptive Statistics for Students in Mathematics ...71
Table 4 Descriptive Statistics for Students in Reading ...72
Table 5 Descriptive Statistics in Mathematics and Reading for
Grades 3, 4, and 5 ...74
Table 6 Pearson Product Moment Correlations for Mathematics and Reading
Scores in Elementary School ...80
Table 7 Descriptive Statistics in Mathematics and Reading for
Grades 6, 7, and 8 ...81
Table 8 Pearson Product Moment Correlations for Mathematics and Reading
Scores in Middle School ...83
Table 9 Elementary Fixed Effects, Variance Components, Standard Error,
and 95% CI in Mathematics Using the Gain Score Model ...86
Table 10 Middle Fixed Effects, Variance Components, Standard Error,
and 95% CI in Mathematics Using the Gain Score Model ...86
Table 11 Elementary School Random Effects in Mathematics Using the
Gain Score Model ...89
Table 12 Middle School Random Effects in Mathematics Using the
Gain Score Model ...91
Table 13 Elementary Fixed Effects, Variance Components, Standard Error,
v
Table 14 Middle Fixed Effects, Variance Components, Standard Error,
and 95% CI in Reading Using the Gain Score Model ...92
Table 15 Elementary School Random Effects in Reading Using the
Gain Score Model ...94
Table 16 Middle School Random Effects in Reading Using the
Gain Score Model ...95
Table 17 Elementary Fixed Effects, Variance Components, Standard Error,
and 95% CI in Mathematics Using the Layered Effects Model ...97
Table 18 Middle Fixed Effects, Variance Components, Standard Error,
and 95% CI in Mathematics Using the Layered Effects Model ...98
Table 19 Estimated R Matrix for ID 220436 in Mathematics ...99
Table 20 Elementary School Random Effects in Mathematics Using the
Layered Effects Model ...100
Table 21 Middle School Random Effects in Mathematics Using the
Layered Effects Model ...101
Table 22 Elementary Fixed Effects, Variance Components, Standard Error,
and 95% CI in Reading Using the Layered Effects Model ...102
Table 23 Middle Fixed Effects, Variance Components, Standard Error,
and 95% CI in Reading Using the Layered Effects Model ...103
Table 24 Estimated R Matrix for ID 220436 in Reading ...104
Table 25 Elementary School Random Effects in Reading Using the
Layered Effects Model ...104
Table 26 Middle School Random Effects in Reading Using the
Layered Effects Model ...106
Table 27 Pearson Product Moment Correlations Using the Gain Score
Model between Mathematics and Reading for the Elementary
School Grades ...110
Table 28 Pearson Product Moment Correlations Using the Gain Score
Model between Mathematics and Reading for the Middle
vi
Table 29 Pearson Product Moment Correlations Using the Layered
Effects Model between Mathematics and Reading for the
Elementary School Grades ...112
Table 30 Pearson Product Moment Correlations Using the Layered
Effects Model between Mathematics and Reading for the
Middle School Grades...113
Table 31 Pearson Product Moment Correlations Using Mathematics
between the Gain Score and Layered Effects Models in the
Elementary School Grades ...114
Table 32 Pearson Product Moment Correlations Using Mathematics
between the Gain Score and Layered Effects Models in the
Middle School Grades...114
Table 33 Pearson Product Moment Correlations Using Reading
between the Gain Score and Layered Effects Models in the
Middle School Grades...115
Table 34 Pearson Product Moment Correlations Using Reading between
the Gain Score and Layered Effects Models in the
Middle School Grades...115
Table 35 Elementary School Rankings in Mathematics
Using the Gain Score Model ...116
Table 36 Middle School Rankings in Mathematics
Using the Gain Score Model ...118
Table 37 Elementary School Rankings in Reading
Using the Gain Score Model ...119
Table 38 Middle School Rankings in Reading
Using the Gain Score Model ...121
Table 39 Elementary School Rankings in Mathematics
Using the Layered Effects Model ...121
Table 40 Middle School Rankings in Mathematics
Using the Layered Effects Model ...123
Table 41 Elementary School Rankings in Reading
vii
Table 42 Middle School Rankings in Reading Using
the Layered Effects Model ...126
Table 43 Spearman Rank Correlation Coefficients Using the
Gain Score Model between Mathematics and Reading in
the Elementary School Grades ...128
Table 44 Spearman Rank Correlation Coefficients Using the
Gain Score Model between Mathematics and Reading in
the Middle School Grades ...128
Table 45 Spearman Rank Correlation Coefficients Using the
Layered Effects Model between Mathematics and Reading
in the Elementary School Grades ...129
Table 46 Spearman Rank Correlation Coefficients Using the
Layered Effects Model between Mathematics and Reading
in the Middle School Grades ...130
Table 47 Spearman Rank Correlation Coefficients Using Mathematics
between the Gain Score Model and the Layered Effects
Model in the Elementary School Grades ...131
Table 48 Spearman Rank Correlation Coefficients Using Mathematics
between the Gain Score Model and the Layered Effects
Model in the Middle School Grades ...131
Table 49 Spearman Rank Correlation Coefficients Using Reading
between the Gain Score Model and the Layered Effects
Model in the Elementary School Grades ...132
Table 50 Spearman Rank Correlation Coefficients Using Reading
between the Gain Score Model and the Layered Effects
Model in the Middle School Grades ...132
Table 51 Summary of Pearson Product Moment Correlation (r) and
Spearman Rank Correlation Coefficient (rs) ...134
Table B1 Cross-Classification of Students in Elementary and
Middle School ...159
Table D1 Number of Students with Missing Data in Mathematics
viii
Table D2 Number of Students Missing a Mathematics Score
(N=7,496) ...168
Table D3 Number of Students Missing a Reading Score
(N=7,496) ...169
Table D4 Number of Students Missing a Mathematics Score by Grade
(N=7,496) ...169
Table D5 Number of Students Missing a Reading Score by Grade
ix
List of Figures
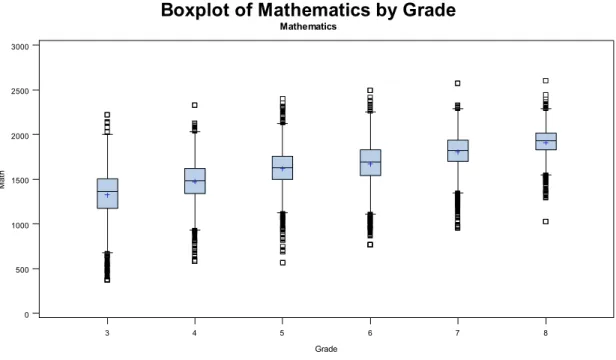
Figure 1. Box-Plot of Mathematics by Grade ...70
Figure 2. Box-Plot of Reading by Grade ...70
Figure 3. Elementary School Random Effects by Outcome Measure and Model Specification ...107
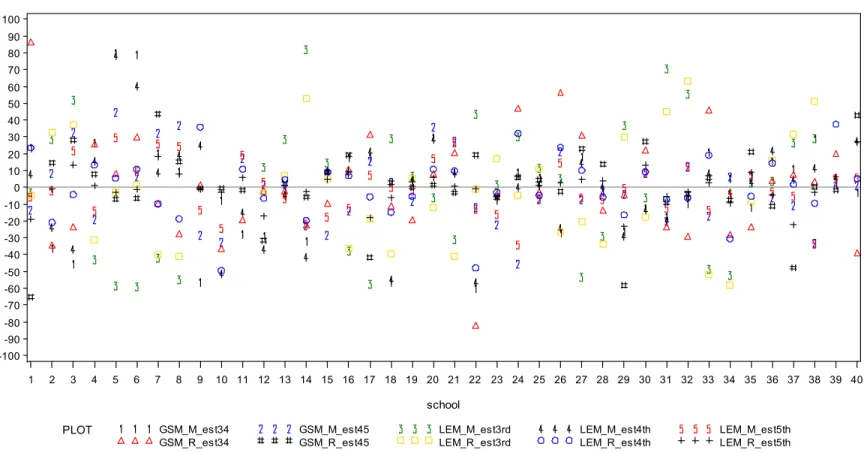
Figure 4. Middle School Random Effects by Outcome Measure and Model Specification ...108
Figure C1. Scatter Plot of Mathematics by Reading for Grade 3 ...161
Figure C2. Scatter Plot of Mathematics by Reading for Grade 4 ...162
Figure C3. Scatter Plot of Mathematics by Reading for Grade 5 ...163
Figure C4. Scatter Plot of Mathematics by Reading for Grade 6 ...164
Figure C5. Scatter Plot of Mathematics by Reading for Grade 7 ...165
Figure C6. Scatter Plot of Mathematics by Reading for Grade 8 ...166
Figure E1. Plot of Level-1 Residuals by Grade Change in Mathematics ...174
Figure E2. Plot of Level-1 Residuals by Grade Change in Reading ...175
Figure E3. Plot of Level-1 Residuals in Mathematics by Grade ...176
x
Abstract
The Adequate Yearly Progress (AYP) Model has been used to make many high-stakes decisions concerning schools, though it does not provide a complete assessment of student academic achievement and school effectiveness. To provide a clearer perspective, many states have implemented various Growth and Value Added Models, in addition to AYP. The purpose of this study was to examine two Value Added Model specifications, the Gain Score Model and the Layered Effects Model, to understand similarities and differences in school effect results. Specifically, this study correlated value added school effect estimates, which were derived from two model specifications and two outcome measures (mathematics and reading test scores).
Existing data were obtained from a moderately large and rural school district in Florida. The outcome measures of 7,899 unique students were examined using the Gain Score Model and the Layered Effects Model to estimate school effects. Those school effect estimates were then used to calculate and examine the relationship between school rankings.
Overall, the findings in this study indicated that the school effect estimates and school rankings were more sensitive to outcome measures than they were to model specifications. The mathematics and reading correlations from the Gain Score Model for school effects and school rankings were low (indicating high sensitivity), when
xi
advancing from Grades 4 to 5, and were moderate in other grades. The mathematics and reading correlations from the Layered Effects Model were low at Grade 5 for school effects and school rankings, as were the correlations at Grade 7 for the school rankings. In the other grades, correlations were moderate to high (indicating lower sensitivity). Correlations between the Gain Score Model and the Layered Effects Model from mathematics were high in each grade for both school effects and school rankings. Reading correlations were also high for each of the grades.
These results were similar to the findings of previous school effects research and added to the limited body of literature. Depending upon the outcome measure used, school effects and rankings can vary significantly when using Value Added Models. These models have become a popular component in educational accountability systems, yet there is no one perfect model. If used, these models should be used cautiously, in addition to other accountability approaches.
1
Chapter I: Introduction
Statement of the Problem
It is no secret that politics, economics, global dominance, and education are intertwined with one another (Hershberg, 2005). In 1965, the Elementary and Secondary Education Act (ESEA) was enacted by President Lyndon B. Johnson to emphasize improving the education of low-income students. Nearly 20 years later, in 1981, President Reagan formed the National Commission on Excellence in Education as a result of the Secretary of Education, T.H. Bell’s concern about “the widespread public perception that something is seriously remiss in our educational system” and the nation was at risk of losing their once unchallenged dominance in commerce, industry, science, and technological innovation (United States Department of Education [USDOE], 1983). That commission subsequently released the “A Nation at Risk” report in 1983. These events inevitably led to Congress amending the ESEA and reauthorizing it as the No Child Left Behind (NCLB) Act in 2002. This standards-based educational reform effort incorporated the strategies proposed by President George W. Bush which included (1) increased accountability for states, school districts, and schools; (2) greater choice for parents and students, particularly those attending low-performing schools; (3) more flexibility for states and local educational agencies in the use of federal education dollars;
2
and (4) a stronger emphasis on reading, especially for the youngest children (USDOE, 2010).
The NCLB Act requires that all students show Adequate Yearly Progress (AYP) toward the goal of 100% proficiency in reading and mathematics by the year 2014 (Choi, Seltzer, Herman, & Yamashiro, 2007). AYP is a status-based accountability model that examines the academic performance of student cohorts from year to year in terms of the proportion of students attaining proficiency or advanced levels on state standards-based tests (Choi et al., 2007). Each state provides its own definition of AYP for state standards against which each school district and school must compare itself (USDOE, 2002). According to Hershberg (2005), the NCLB requirement which mandates schools to bring all students to high standards by 2014, was a worthy goal but a problem was found in determining how to identify which schools were on target to meet those requirements. He also indicated that in most cases, AYP measures can distinguish successful and
unsuccessful schools, but for many, the AYP measures fail to depict fair and complete assessments of school performance. One reason for this dilemma was that AYP focuses on overall proficiency to the exclusion of individual students’ academic growth
(Hershberg, 2005). A popular approach to address this dilemma is the use of Growth Models.
Growth Models are one approach states can use to measure students’ academic
achievement longitudinally (e.g., 3rd, 4th, 5th grade mathematics scores on academic
achievement tests). Longitudinal analysis looks at data with two or more points in time, as opposed to cross-sectional analysis, which considers only one point in time. In 2005,
3
Secretary of Education Margaret Spellings announced a pilot program that allowed up to 10 states to develop and implement Growth Models into their accountability systems if they followed the seven “bright-line” principles of NCLB (USDOE, 2009). The required seven bright-line NCLB principles were (1) ensuring that all students become proficient by 2014, (2) making grade-level proficiency the expected standard of achievement as opposed to student or school characteristics, (3) holding schools and districts accountable for all student subgroups’ achievement in reading and mathematics, (4) assessing students in Grades 3 through 8 in reading and mathematics, (5) developing assessment systems that produce comparable results from grade to grade and year to year, (6) monitoring student progress as part of the state data system, and (7) including student participation and achievement as separate academic indicators in the state accountability system (USDOE, 2009). By 2009, 15 states (Tennessee, North Carolina, Delaware, Arkansas, Florida, Iowa, Ohio, Alaska, Arizona, Michigan, Missouri, Colorado, Minnesota, Pennsylvania and Texas) were approved to implement some type of Growth Model (USDOE, 2009).
One type of Growth Model used in educational accountability systems is the Value Added Model (VAM). VAMs attempt to estimate to what extent changes in student academic achievement performance, or outputs (e.g., mathematics achievement scores), can be attributed to particular inputs (especially teachers, schools, or educational reforms) “received” by the student over a specified period of time (Wiley, 2006). These estimates of the effects of a particular teacher or classroom on student learning would be analogous to the estimated effects of a particular worker’s efforts on a firm’s output, such
4
as net profits or return on investments (Wiley, 2006). There are a variety of VAMs that are currently being used and investigated for use in educational accountability decisions.
The problem with the various accountability models is the difficulty in determining which model provides the most accurate picture of student academic achievement and school effectiveness. Each model has strengths and weaknesses and provides a varied perspective of student achievement and school effectiveness. Research and collaboration among education stakeholders will likely assist in determining the best accountability modeling approach.
Rationale for the Study
Given the interest in improving America’s schools and holding states and districts accountable for student achievement, there have been disagreements about which
accountability model(s) should be used to evaluate school effectiveness and compare schools. The Status Model (AYP) provides a perspective of student proficiency and the Growth Model provides a perspective of student improvement from one year to the next; further, VAMs provide a perspective of the degree to which a school contributes to a students’ academic achievement. Decisions regarding the best model will require additional methodological investigations. This study will investigate methodological issues related to using VAMs for educational accountability purposes.
VAMs are used to estimate the unique effects schools and/or teachers add to students’ learning. With a VAM, a district, school, teacher, or “program effect” can be examined; however, the two most common effects examined are schools and teachers. A
5
“school effect” can be described as the difference in one particular school’s average student achievement growth for a given year, compared to the expected average achievement growth of all schools. The same principle applies for “teacher effects,” which is the average achievement growth estimated for a particular teacher’s classroom compared to all teachers in that particular grade and subject. Within the variety of VAMs, several models utilize background control variables such as race, parent’s highest
education level, and previous academic performance on standardized tests (Ballou, Sanders, & Wright, 2004).The inclusion of control variables removes variation and allows more precise comparisons between schools (when examining school effects) and teachers (when examining teacher effects). In both instances, schools or teachers are compared to the overall average growth rate in the category of interest.
There have been a variety of models proposed to address different study contexts. These models are often distinguished by different factors such as (a) number of data points, (b) how growth is conceptualized, (c) whether they include covariates (e.g., socioeconomic status, race), and (d) the persistence of prior teacher or school effects on future outcomes (McCaffrey, Lockwood, Loretz, Louis, & Hamilton, 2004). VAMs that focus on growth can range from simple models that measure change from one year to the next or predict a future score from a previous score in one context (e.g., one school), to more complex models where the contexts change within a study such as students who move to different schools or change teachers over the specified study time (Ballou et al., 2004; Briggs & Weeks, 2007; Lockwood, Doran, & McCaffrey, 2003; Lockwood,
6
McCaffrey, Hamilton, Stecher, Le, & Martinez, 2007; McCaffrey et al., 2004; Schmitz & Raymond, 2008).
Numerous VAM debates exist for a variety of issues including the validity and robustness of the estimates from these models; however, sensitivity analysis studies can be applied to address these issues. One example of this can be observed by investigating how results and implications of a study may differ due to changes in the conditions of a study (e.g., varied models used, outcome measures, or inclusion of covariates). Some degree of caution should be considered with these studies because even though the results may be stable, they may incorrect. These types of studies have been conducted and continue to be recommended for future research (McCaffrey, Lockwood, Koretz, & Hamilton, 2003; McCaffrey et al., 2004). Until the various VAM issues are rectified, the wide-scale use of these models will likely be limited (Beardsley, 2008). As previously noted, the value added to a student’s achievement growth can be viewed from a number of perspectives; however, the majority of studies in the literature have focused on school and/or teacher effects. McCaffrey et al. (2003) focused on sensitivity issues related to teacher effectiveness, but mentioned that the sensitivity issues raised in their study also apply to school effect studies.
A limited number of sensitivity studies have been conducted to investigate value added effects. These past studies found value added effects to be sensitive to a variety of conditions, particularly varied model specifications in the studies of Briggs and Weeks (2007, 2011), McCaffrey et al. (2003, 2004), and Tekwe et al. (2004); and varied model specifications and outcome measures in the Lockwood et al. (2007) and Schmitz (2007)
7
studies. Additional studies under similar and varied conditions are still warranted to determine if results are consistent in other contexts. This study sought to build upon the research of Schmitz (2007) and Lockwood et al. (2007), as well as, Tekwe et al. (2004) and Briggs and Weeks (2011). The Schmitz (2007) and Lockwood et al. (2007) studies address sensitivity analysis issues related to teacher effects under varied models and outcome measures. The study by Tekwe et al. (2004) and Briggs and Weeks (2011) addressed sensitivity analysis issues related to school effects under varied model specifications.
Lockwood et al. (2007) found that the sensitivity of the teacher effect estimates to models and controls was low (i.e., highly correlated, having a similar relationship) in comparison to the sensitivity of the teacher effect estimates to achievement outcome measures. This indicated that changes in outcome measures were more significant than changes in the models used. Schmitz (2007) also found that there was little difference in the models’ estimation of teachers’ effects with the exception of one model, which attributed more variability in student gains to teacher effects than the others. He found that the correlations between mathematics and reading from three of the models were only moderate (correlational findings are usually categorized as “low,” “moderate,” or “high”). Tekwe et al. (2004) found that the global impact of one model, compared to another was low in their study, which used two years of data. The study also found consistent disagreement between two models, but they speculated the disagreement would decrease when analyzing three or more points in time (Tekwe et al., 2004). However, when only two points in time were considered they recommended two models
8
in favor of the others (Tekwe et al., 2004). Briggs and Weeks (2011) found that estimated school effects across models were moderately to highly correlated irrespective of the specific test subject or pair of models considered; however, they found considerable variability in the correlations.
In light of the national attention given to educational accountability systems, it behooves educational stakeholders to consider the strengths and weaknesses of all accountability models and select the most appropriate combination of approaches. This study contributed to the research that supports the evaluation of VAMS for educational accountability, thus enabling provision of a more holistic perspective of student
achievement and school effectiveness.
Purpose of the Study
The purpose of this study was to examine two Value Added Model specifications to understand similarities and differences in school effect results. Specifically, this study correlated value added school effect estimates, which were derived from two model specifications (Gain Score and Layered Effects) and two outcome measures (mathematics and reading). Next, the school rankings were compared and correlated using the same models and outcome measures (or outcomes). Conducting these analyses (1)
demonstrated how stable the value added school effect estimates were when the models and the outcomes were altered, (2) determined whether these models could be used interchangeably to compare schools, (3) examined whether school effect results were similar to the previous findings for teacher effects, and (4) added to the methodological
9
research literature required for a fuller understanding of the implications of using VAMs for educational accountability. This study used secondary data collected from a
moderately large and rural school district, which included test scores of students in elementary school (Grades 3 through 5) and middle school (Grades 6 through 8). Four research questions were used to guide the analyses.
Research Questions
Research Question 1. What is the relationship between school effect estimates
from the Gain Score Model when mathematics achievement scores are used versus reading achievement scores? What is the relationship between school effect estimates from the Layered Effects Model when mathematics achievement scores are used versus reading achievement scores?
Research Question 2. What is the relationship between school effect estimates
based on mathematics achievement scores when the Gain Score Model is used versus the Layered Effects Model? What is the relationship between school effect estimates based on reading achievement scores when the Gain Score Model is used versus the Layered Effects Model?
Research Question 3. What is the relationship between school rankings from the
Gain Score Model when mathematics achievement scores are used versus reading achievement scores? What is the relationship between school rankings from the
10
Layered Effects Model when mathematics achievement scores are used versus reading achievement scores?
Research Question 4. What is the relationship between school rankings based on
mathematics achievement scores when the Gain Score Model is used versus the Layered Effects Model? What is the relationship between school rankings based on reading achievement scores when the Gain Score Model is used versus the Layered Effects Model?
Significance of the Study
This study was significant given the interest in the academic growth of youth in the United States and the desire to hold schools accountable for students’ academic growth. Accountability approaches, in particular the Status, Growth, and VAM models, each have strengths and weaknesses to consider when they are used to identify the most or least effective schools, programs, or teachers for students. Sensitivity analysis studies are an avenue that can explore consistency in value added school effect results before wide-scale policy implementations take place. These studies are important considering the consequences students, teachers, schools, and districts face when students’ growth is inadequate. Value added estimates should be used as one part of a holistic approach to educational accountability and should not be used as a sole measure from which to make policy decisions. This study adds to the literature and our understanding of value added
11
estimates, which may aid in the efforts to make responsible inferences regarding research and evaluation findings and educational policies.
Definition of Terms
The terms defined below were used throughout this study:
Academic Achievement. The degree to which students “meet” or “exceed” academic standards established for a particular subject, such as reading, mathematics, or science (USDOE, 2009).
Accountability. The idea of holding states, districts, schools, educators, and students responsible for results (Education Week, 2004).
Adequate Yearly Progress. A status-based model defined by the NCLB Act. Each state establishes a definition of “Adequate Yearly Progress” (AYP) to use each year to determine the achievement of each school district and school (USDOE, 2002).
Gain Score Model. Models that specify a one-year gain score (current score minus the previous score) separately for each year and link student gains to their current-year teacher or school effects (McCaffrey et al., 2003).
12
Layered Effects Model. A mixed effects model that estimates the specific effect that systems, schools, and teachers have on student academic achievement gains from standardized assessments each year (Sanders & Horn, 1994).
Sensitivity Analysis. Analyses that are used to determine whether the results and implications of a study differ when modifications are made to the study (Forrester, Breierova, & Choudhari, 2001). For example, when a school’s ranking changes while comparing two models, then the school’s ranking would be considered sensitive to the model specifications. Otherwise, the rankings would be considered insensitive to model specifications.
School Effect Estimates. An estimated measure of the difference between a school’s actual value or average achievement growth rate for a particular grade, compared to the expected value or growth rate for an average schooling experience or year’s growth for the same grade (Goldschmidt et al., 2005; Schmitz, Raymond, 2008).
Standards-Based Tests. Academic assessments that are based upon established academic standards (USDOE, n.d.).
Value Added Model (VAM). A type of Growth Model which may use statistical controls (e.g., student demographics, prior achievement, etc.) in order to isolate the specific
13
effects a particular school, program, or teacher have on students’ academic achievement each year (Goldschmidt et al., 2005).
Value Added School Effect Estimate. An estimate of the difference between a school’s actual average academic achievement growth rate compared to the expected growth rate for an average school year’s growth rate (Goldschmidt et al., 2005).
Delimitations
The results of this study were delimited such that only two levels of outcome measures and two levels of model specifications were examined. The models were two-level models, with repeated measures nested in students, and students nested in schools. The teacher level was omitted from this analysis to maintain a limited focus on
examining school effects. In addition, the sample represented students who tested in one moderately large and rural school district for Grades 3 through 5 and Grades 6 through 8 from 2005 to 2010.
Limitations
This study was limited in two ways. First, the sample consisted of students’ standardized achievement test scores in Grades 3 through 5 and Grades 6 through 8 from one moderately large and rural school district in Florida. Within this limitation, the student sample may or may not reflect the U.S. population, but most likely will reflect the population of the school district from which the sample was taken. The second limitation
14
was found in using existing district data for secondary analysis. When using existing data, an analyst may be limited in the knowledge of errors such as matching student IDs with test scores or accurate chronicles of students changing schools within a school year. When using secondary data, the researcher has no control of the design conditions of the original study under which the data collected, the variables investigated, coding methods for variables, instruments used, reliability and validity of scores from the instruments, or how the data are arranged in the dataset.
Organization of Remaining Chapters
The remaining chapters present previous research and the methods, results, and the discussion of this study. Chapter II, Literature Review, begins with a description of the contextual framework of educational accountability models. It then includes research regarding various VAM characteristics and value added sensitivity studies. Chapter III, Method, provides a discussion of the research methods used to investigate the research questions posed. The chapter presents the research design, population and sample investigated, variables used in this study, instruments for outcome measures, data
collection procedures, data analysis, and software/technology used for analyses. Chapter IV, Results, presents the findings from the preliminary and primary data analyses. Lastly, Chapter V, Discussion, presents a final discussion of the results, limitations of the study, directions for future research, and closing remarks.
15
Chapter II: Literature Review
Overview
The No Child Left Behind (NCLB) Act and Adequate Yearly Progress (AYP) were new paradigms in that accountability became the standard in the arena of education. Schools, districts, and states became accountable for their students to meet their Annual Measurable Objectives. Previous researchers have alluded to unintended consequences of NCLB and AYP as being somewhat unfair to the students in the most need because it encourages schools to focus on moving students who are closest to the threshold over it, virtually ignoring their lowest performing students (Choi, Seltzer, Herman, & Yamashiro, 2007). To address these concerns, Growth Models and Value Added Models (VAMs) have been proposed as supplements for use in educational accountability systems; however, VAMs are still somewhat controversial and have not gained nationwide acceptance for a variety of reasons. There is a need for further investigations of these models to determine if they are suitable for accountability or school improvement efforts. This study built upon previous value added studies that compared results from different model specifications and outcome measures.
This chapter presents a review of previous literature in three segments providing the background for this study: (1) a description of the contextual framework of
16
value added effects sensitivity studies. The first section is brief; the majority of the literature focuses on various aspects of VAMs. Lastly, the chapter closes with a literature review summary.
Due to the breadth of VAM research topics as a whole, it is necessary to denote which literature was included and which literature was excluded as a major focus. The studies presented in this chapter were confined to those relating to value added modeling of teacher and/or school effects. Although this study was conducted with school effects as the focus, literature on teacher effects was included as a reference and bridge to the investigation of school effects. The reason for this was due to the limited number of value added studies that focused on the sensitivity of estimates (McCaffrey et al., 2003; Briggs & Weeks, 2007, 2011). In addition, the studies in this chapter were limited to those conducted in the United States. These inclusions and exclusions are important in conveying the context used to guide this study.
Contextual Framework: Educational Accountability Models
The contextual framework further clarifies the focus of this study and the various challenges of selecting the best methods to use in an accountability system. According to Hershberg (2005), the NCLB requirement that schools bring all their children to high standards by 2014 was a worthy goal, but a problem was found in determining how to identify which schools were on target to meet those requirements. He indicated that in most cases, AYP measures can distinguish successful and unsuccessful schools, but for many, the AYP measures fail to depict fair and complete assessments of school
17
performance. One reason for this dilemma is because AYP focuses on achievement to the exclusion of academic growth (Hershberg, 2005). Growth solely does not provide the information on status or distance to proficiency, which is most important for the NCLB Act and meeting AYP.
Status Models and Growth Models are the main approaches used in educational accountability within the United States and they both have strengths and weaknesses. Status Models and Improvement Models both provide one perspective of the academic performance of students. Growth Models provide another perspective of student performance in regard to how individual students progress from year to year and how schools compare to this growth. Growth Models can be used to monitor individual students’ academic progress; however, VAMs, which are a type of growth model, go a step further in attempting to estimate the extent to which schools and/or teachers add to students’ academic achievement, or growth. When utilized independently, the Status and Growth Models provide a limited perspective of student and school performance.
However, when used in conjunction with one another, these models can provide a more holistic perspective of student academic achievement and the effectiveness of schools. It is important to continually study and monitor each of these modeling approaches to determine how accurate they are in providing student proficiency, student progress, and school effectiveness information.
Status and Improvement Models.Goldschmidt et al. (2005) provided a
description of the distinctions between different accountability models (e.g., Status, Improvement, and Growth). According to Goldschmidt et al. (2005), Status Models were
18
oftentimes contrasted with Growth Models. Also, they indicated that Status Models took snapshots of a subgroup’s or school’s level of student proficiency at one point in time or an average of two or more points in time. Goldschmidt et al. explained that this
proficiency level was then compared to an established target that can vary between states. They defined progress, or growth, under this type of model as the percentage of students achieving proficiency for a particular year and the school was evaluated based on
whether the student group met or failed to meet the established target. Lastly, they
identified another type of Status Model, which was an Improvement Model that measured
change between different cohorts of students (e.g., 2009 7th graders to 2010 7th graders)
(Goldschmidt et al., 2005).
Growth Models. Growth Models are models of education accountability that
measure academic progress by tracking the change in achievement scores of individual
students or cohorts of students from year to year (e.g., Cohort 1 in 3rd Grade to Cohort 1
in 4th Grade, etc.) with one of the goals of determining the average growth made among
students and schools (Goldschmidt et al., 2005). Achievement growth comparisons over time at the school level, indicated by Goldschmidt et al., would be determined from the aggregated growth of individual students in the school (e.g., comparing a three-year average school growth between schools A, B, or a state average) after controlling for each student’s background and prior achievement. The researchers also determined that a school’s ability to facilitate academic achievement growth over time is a better indicator of academic performance than the Status Models that look only at one point in time; schools could then be ranked based upon their average growth estimates.
19
Value Added Models.A commonly mentioned type of Growth Model and
application in education is a Value Added Model (VAM). VAMs are the most recent methods used in education to estimate the unique contributions that teachers, schools, and districts make upon students’ academic performance or achievement growth
(Goldschmidt et al., 2005). Some models use covariates to separate the effects of non-school-related factors (e.g., family, peer, and individual influence) from a school’s performance so appropriate comparisons can take place. Goldschmidt et al. also determined that schools using VAMs can have positive achievement growth and a negative value added estimate (e.g., School A gained an average of 25 points over three years, but the district average was 40 points greater than School A’s average over the same three years).
The concept of value added modeling is not totally unique nor is it new, but rather it is a method that has been used in the business sector and applied in education as a means to estimate the effects that schools, teachers, or programs have upon student academic achievement and growth. According to Wiley (2006), this approach took its roots from econometrics and educational statistics. He noted that economists used
“production function” models to mathematically describe how a firm created output from its inputs or how its resources and procedures were used to produce products. He also stated that the production function measured productivity (value created) from a specific collection of inputs and the more valuable inputs were those that were more productive and provided greater output per unit. Wiley (2006) stated that economists interested in education used the input/output model to estimate how factors affect the outcomes of
20
schooling. When using “production function” models in education, also known as Education Production Functions (EPF), a central question Wiley (2006) posed was, “To what extent could changes in student performance or output (i.e., mathematics
achievement scores) be attributed to particular inputs (i.e., teachers, schools, or educational reforms) ‘received’ by the student over a specified period of time?” He indicated that the EPF estimates of the effects of a particular teacher on student learning were analogous to the estimated effects of a particular worker’s efforts on a firm’s output.
Wiley (2006) stated that educational researchers developed approaches for
investigating teacher and school effects similar to that of economists through longitudinal analysis of student assessment data. He noted that some of the early models were simple year-to-year changes in scores or predictions of current-year scores using the previous-year scores in hierarchical and non-hierarchical formats. The more complex statistical models used by educational statisticians became known under a number of names (e.g., Hierarchical Linear Models, Multilevel Models, or Random Effects Models).
In 2009, states that used some form of VAM in their assessment programs included Arkansas, Delaware, Florida, Louisiana, Minnesota, Ohio, Pennsylvania, South Carolina, and Tennessee, with Tennessee ranking as a leader with the best example to date (Wisconsin Policy Research Institute Inc., 2009). VAMs were mandated in Tennessee, Ohio, Pennsylvania, and several hundred school districts in 21 states
(Wisconsin Policy Research Institute Inc., 2009). Dr. William Sanders and his colleagues at the University of Tennessee-Knoxville were the key developers of the Tennessee Value Added Assessment System (TVAAS) (Sanders, Saxton, & Horn, 1997), which is
21
one of the most widely known and complex VAMs. Dr. Sanders has been most credited with introducing the combination of value added assessment with Mixed Model
methodology to education and its policy makers (Raudenbush & Bryk, 1986;
Raudenbush, & Bryk, 2002). He worked specifically with Tennessee policy makers, and legislative actions resulted in the implementation of TVAAS in all public schools in the state of Tennessee (Sanders & Horn, 1994, 1998; Wright, Horn, & Sanders, 1997). In Tennessee, TVAAS is the process of estimating the district effects, school effects, and teacher effects on the academic growth of students in Grades 3 through 8 in science, mathematics, social studies, language arts, and reading (Sanders et al., 1997). A number of other researchers have continued to expand the work done in this area including Ballou et al. (2004); Briggs and Weeks (2007, 2011); McCaffrey et al. (2003); McCaffrey et al. (2004); Schmitz (2007, 2008); and Tekwe, Carter, Ma, Algina, Lucas, Roth, Ariet, Fisher, and Resnick (2004).
Educational accountability is an area with many facets that are applicable to a variety of stakeholders such as politicians, methodologists, practitioners, and the public as a whole. It contains a broad area of research that has not thoroughly been explored and still has room for improvements. There are a variety of modeling approaches that have strengths, weaknesses, and concerns that future research will continue to build upon. As future discoveries come to light, additional questions are likely to surface as well.
Challenges and concerns with Value Added Models.In each area of
educational accountability research there are a variety of concerns that come from
22
been made regarding schools and teachers, they have not gone without criticisms and expressed concerns. Methodological issues remain to be explored and addressed before these models are accepted with full confidence from researchers and the public. Five of the concerns that Beardsley (2008) listed specific to the Education Value Added
Assessment System (EVAAS) should be considered when working with any VAM. The concerns were related to validity, the use of data, the lack of peer review, the handling of missing data, smaller samples regressing to the mean, and the handling of extraneous variables. First, she noted that there were questions concerning the extent to which the value added results were valid, especially the need for content specific assessments to be linked to curriculum and other measures for teacher/school effectiveness. Second, she had concerns about whether the data were used in formative ways that could improve school performance and that many districts failed to use the data in ways to improve their schools because of difficulty interpreting the results. Next, she noted that perhaps one of the most troublesome issues regarding the EVAAS was noted criticisms about the limited outside peer reviews of EVAAS results and proprietary algorithms. Then, she listed concerns about how missing data were related to biasing results and how smaller samples regressed toward the mean. Lastly, were her concerns about extraneous variables that related to the idea that EVAAS failed to include student factors in the model because the EVAAS developers claimed the differences were negligible.
In a special issue of the Journal of Educational and Behavioral Statistics on
Value Added Modeling, Rubin, Stuart and Zanutto (2004) applauded the efforts of Ballou et al., (2004), McCaffrey et al., (2004), and Tekwe et al. (2004) in their estimation of
23
value added parameters. However, they did not think their analyses were estimating causal quantities, except under extreme and unrealistic assumptions. Their view was that the estimates of teacher or school effects were not causal, but rather descriptive (Rubin et al., 2004). Without random assignment, causation cannot be inferred. This hinders efforts to infer causation with VAMs because students are rarely, if ever, randomly assigned to teachers and teachers are rarely randomly assigned to schools from a practical standpoint.
Other researchers have voiced additional concerns about VAMs. Raudenbush (2004) addressed the two types of causal effects estimated in school accountability systems, Type A and Type B. A child’s outcome would be a function of pre-assigned
student characteristics, S, and random error, e, in addition to two aspects of schools: (1)
school context, C (e.g., neighborhood) and (2) school practice, P (e.g., lecture versus
lecture including discussion and hands-on-activities; Raudenbusch & Willms, 1995). Raudenbush (2004) indicated that Type A effects were those of interest to parents choosing a school for their child to attend and Type B effects were of interest to those seeking to hold school personnel accountable for their contributions to student
achievement. He described Type A as the difference in a child’s potential performance at one school compared to another school where the parents are not as concerned with the context or practice of the schools. He also described Type B as the difference in the child’s potential in one school with a particular practice compared to that child’s potential outcome in another school with a different practice; here the focus would be the
comparison of practice between the two schools. Raudenbusch (2004) reasoned that at best, researchers would be able to estimate Type A effects of interest to parents selecting
24
schools, but not Type B effects of interest to officials holding schools and teachers accountable for instructional practices because school practices in most systems fail to be defined or observed.
Currently, no one accountability or modeling approach is optimal in all situations and there is still a need for additional studies to further investigate methodological issues and model comparisons. These studies are of significant importance to provide evidence to assist policy makers to choose the best accountability and/or modeling approach for school comparisons. Though numerous problems and concerns exist, VAMs are still considered a viable component of school accountability systems.
Value Added Modeling Characteristics and Modeling Approaches
Within the realm of VAMs, numerous models have similar and differing approaches to investigate school and teacher effects on student academic achievement growth. These models can be distinguished by characteristics such as (1) number of data-points, (2) levels or nesting illustrated by the models, (3) conceptualization of growth, (4) covariate use in the models, (5) school effects as random or fixed, and (6) assumptions about the persistence of school effects. Two of the broad modeling approaches include the Pure Nested Models and the Cross-Classified Random Effects Models. Each of these model types are connected with the purpose of estimating schools’ effects on students’ achievement scores over time. However, the models differ in various ways depending upon the context investigated and the research questions posed. Some of the models that have been used to investigate value added school effects include the (1) Gain Score
25
Model, (2) Hybrid Success Model, (3) REACH Model, (4) Layered Effects Model, (5) Cumulative Effects Model, and (6) General Variable Persistence Model. Some of the modeling characteristics, modeling approaches, and specific models can be found in Table 1.
Data points. The number of data points is dependent upon the research/evaluation
design. When only one point in time is considered in the study, the design is considered cross-sectional. When two or more points in time are utilized in the study, the design is considered longitudinal. The VAM attributes some of the change over time as a result of experiencing a particular teacher’s class or school. Comparisons of change can then be made using two points in time with an infinite number of data collection points for a study. Measurement of change with the Pure Nested Model requires at least two scores
(e.g., 4th and 5th grade mathematics scores); however, for the more complex
Cross-Classified Random Effects Model, at least three data points are needed when examining growth.
Hierarchical levels. The levels refer to the hierarchical unit of analysis, whether
at the student, teacher, school, or district levels. The Pure Nested Model and Cross-Classified Random Effects Model can range in the number of levels considered from two to five, with two or three levels being the most common. Hierarchical Linear Models segment the variance in the data and allow the researcher to examine variance found at each level investigated simultaneously. A two-level model is depicted when students are nested within schools and a three-level model is depicted when students are nested in teachers and teachers are nested within a school.
26
Growth description. In education, a great deal of focus has been given to how
much academic progress students make from year to year in various subjects and it is assumed that progress or growth will take place each year, regardless of the student or school circumstances. Growth, at a minimum, can be described as the difference between two points in time. However, when examining academic growth, the definition can take on a number of different conceptualizations depending upon the research design and models utilized. Growth can be conceptualized as a change between two adjacent scores, the amount of change needed to reach a proficiency target, or the attribution of gains to schools or teacher effects with these effects accumulating in layers from year to year (Doran & Izumi, 2004; McCaffrey et al., 2003; Sanders, Saxton, & Horn, 1997).
Covariate use. Covariates are independent variables that may or may not be used
as predictors (e.g., race/ethnicity, SES, AYP) of dependent variables. They are held constant in an analysis to reduce their effects on the outcome of interest used to make comparisons. In many research studies, the covariates may be of interest; however, in others, the covariates may confound or interact with other independent variables, and are therefore excluded. Uncontrolled covariates may lead to incorrect inferences about the relationship between the independent variables and, more specifically, the outcomes may be moderated by one or more covariates, which can also alter interpretations. The choice of whether or not to include covariates will often depend upon the context and research questions to be investigated.
School effects. School effects are the random effects or deflections (whether
27
fixed when they assume that the schools are the fixed population to be examined (Tekwe et al., 2004). School effects are considered random when the schools observed are
assumed to be a random sample from a larger population of schools (Tekwe et al., 2004). According to McCaffrey et al. (2003), the two methods will tend to yield similar
conclusions about variability between schools, but will provide different estimates of individual school effects. Random effects are the natural approach when variance components are of primary interest; however, when the specific intention is to make inferences about a particular set of schools (e.g., in an accountability setting), fixed effects may be preferable (McCaffrey et al., 2003).
Persistence of effects. Persistence describes the degree to which the school effect
estimates hold their effect over time. Using a Complete Persistence Model, the
persistence of school effects assume that the effects of a previous school on a students’
growth (e.g., 4th to 5th grade mathematics growth at School A estimated to be .80)
remains undiminished and accumulates year to year. It assumes that, for example, a .80
school effect for 3rd Grade students in School A remains undiminished even when those
same students are in 8th Grade at School B. With variable persistence, the previous school
effects are estimated each year in future administrations and are allowed to diminish over time rather than assume that the effects accumulate and remain undiminished year after year.
Pure Nested Model. The Pure Nested Models are appropriate for modeling
educational data because this type of data is hierarchical by nature. Hierarchical, or nested data, include settings where students are nested within a particular teacher’s
28
classroom, teachers are nested within a particular school, and schools are nested within a particular school district (Raudenbush, & Bryk, 2002; Wiley, 2006). With purely nested situations, it is assumed that the context remains the same at each data point of the study. An example of a Pure Nested Model can be described as measuring students’ academic growth in Grades 6 through 8 within one school. Part of the NCLB Act requires states to test students yearly in Grades 3 through 8 for reading and mathematics and, as mentioned earlier, all students must show Adequate Yearly Progress (AYP) toward the goal of 100% proficiency by the year 2014 (Choi, Seltzer, Herman, & Yamashiro, 2007). The Pure Nested Model may be sufficient to address these growth and proficiency issues appropriately when students remain in one context (school).
Three Pure Nested Models that have been utilized in the examination of school effects include the Gain Score Model, the Hybrid Success Model, and the REACH Model. The simpler models have been discussed under a variety of names (e.g., Gain Score Model, Change Score Model, and Covariate Adjustment Model and they are similar in that they measure change as the difference between a current score and
previous score (Lockwood et al., 2007; McCaffrey el al., 2004; Tekwe et al., 2004). The Gain Score Model specifies a one-year gain score (current score minus prior score) separately for each year and links student gains to their current-year school’s effects (McCaffrey et al., 2003). The Covariate Adjustment Model considers two adjacent years, but is conceptualized slightly differently because it actually regresses the achievement measure for the current year on the previous year; it uses prior scores as covariates in models for current outcomes (Lockwood et al., 2007; McCaffrey et al., 2004).
29
The Hybrid Success Model includes growth along with proficiency, and the success of a school is a measure of academic growth in the school (Kingsbury & McCall, 2006). The school can be deemed successful depending upon the extent that students are growing “as much” or “more than expected” and growing “toward” or “beyond”
proficiency targets (Kingsbury & McCall, 2006). The REACH Model is similar to the Hybrid Success Model in that it focuses on growth and proficiency (Kingsbury & McCall, 2006). At the school level, the percentage of students “at” or “above” the proficient cut point are calculated across all tested grade levels in the school and these calculations are then used to provide an estimated growth rate of the school (Doran & Izumi, 2004). The Pure Nested Models consider the hierarchical nature of the data but are not the most appropriate when the context changes.
Cross-Classified Random Effects Model. Currently, the most complex VAMs
are the Cross-Classified Random Effects Models. These models estimate growth trajectories when the context changes during the study period. For example, the lower level units (i.e., students) may occupy more than one higher level unit at level-2 (i.e., schools). These students at level-1 could attend the same elementary school at level-2 together, but attend different middle schools also at level-2. Students would be
considered cross-classified, meaning that they are classified in two categories of schools, which are both at level-2. When context changes are ignored and not modeled
appropriately, the results may lead to underestimation of the residual errors (Wiley, 2006). When context changes occur within a study, the Cross-Classified Random Effects
30
Model becomes the best modeling approach because it appropriately models the residuals at each point in time in the study (Raudenbush & Bryk, 2002).
Three of the most commonly referenced Cross-Classified Random Effects Models investigating school effects are the (1) TVAAS or Layered Effects Model of Sanders, Saxton, and Horn (1997), (2) the Cumulative Effects Model (Ponisciak & Bryk, 2005; Raudenbush & Bryk, 2002) and (3) the General Variable Persistence Model of
McCaffrey et al. (2004). These three Cross-Classified Random Effects Models can be distinguished by complete or variable persistence, where the persistence would be the school or teacher effects from previous years into future student outcomes. The first two examples of models are examples of the first class of models, which assume complete persistence. The Layered Effects Model of Sanders, Saxton, and Horn (1997) was investigated by Briggs, Weeks & Wiley (2008); McCaffrey et al. (2004); and Tekwe et al. (2004). The Cumulative Effects Model of Raudenbush and Bryk (1993, 2002) was investigated by Briggs et al. (2008), McCaffrey et al. (2004), and Schmitz (2007).
McCaffrey et al. (2004) stated that the Cumulative Effects Model estimates each student’s growth across grades by imposing a linear trend line rather than allowing separate means at higher levels at each point in time. They indicated that this model was a multi-grade Gain Score Model, where the mean gain was assumed constant across grades and the variance-covariance matrix for residual error terms from the same student was not diagonal (i.e., gains are not independent across grades). However, the Layered Effects Model, they found, placed no restrictions on the overall grade specific means or the covariance-variance matrix of the repeated test scores from the student. McCaffrey et
31
al. (2004) indicated that the Cumulative Effects Model and Layered Effects Model use data from all students, even those with partially complete records; this is different from the Gain Score Model or Covariate Adjustment Models, which use only students with two consecutive years of data unless imputation or other missing data methods are applied. They noted that both the Cumulative Effects Model and Layered Effects Model were extensions of Gain Score Modeling.
The second class of Cross-Classified Random Effects Models include the General Variable Persistence Model of McCaffrey et al. (2004) demonstrated by Briggs and Weeks (2007) and Lockwood et al. (2007). The General Variable Persistence Model estimates growth similar to the Layered Effects Model in that it places no restrictions on the covariance-variance matrix of the repeated test scores from a student (McCaffrey et al., 2004). The persistence of effects is not assumed complete as with the Cumulative Effects Model and TVAAS or Layered Effects Models (McCaffrey et al., 2004). Also, the General Variable Persistence Model is limited because the persistence parameters have posed computational challenges when trying to fit the models in HLM, MLWin, R, SAS, or S-Plus software packages, particularly with larger datasets typically found in moderate to large school districts (Lockwood et al., 2007; McCaffrey et al., 2004). Table 1 displays some of the previously mentioned features that may distinguish the different models that have been used in school effects studies. The last column of the table provides references for those seeking more in-depth discussions of the Pure Nested Models and Cross-Classified Random Effects Models.
32
Table 1
Comparisons of Various Value Added Models and Their Features
Models Data Levels Growth Covariates Used School Persistence School Effects References
Types Points Description in References Effects
I. Pure Nested Models
Gain Score 2 2 Change Score in Varies Random Complete Tekwe et al., 2004; Wang, 2006
Adjacent Years
Hybrid/PTG 2 2+ Standards Growth No Fixed Complete Kingsbury & McCall, 2006
REACH/PTG 2+ 2+ PAC and ETGR No Random Complete Doran & Izumi, 2004
II. Cross-Classified Random Effects Models
Layered 3+ 2+ Layered Gains No Random Complete Briggs et al., 2008; Sanders et al., 1997;
Effects Tekwe et al., 2004; Wang, 2006
Cumulative 3+ 2+ Linear Gains No Random Complete Ponisciak & Bryk, 2005; Raudenbush &
Effects Bryk, 2002; Schmitz, 2008
General Variable 3+ 2+ Layered Gains Varies Both Variable McCaffrey et al., 2004; Briggs & Weeks,
Persistence 2008