ESSAYS IN DEVELOPMENT ECONOMICS
A Dissertation
Presented to the Faculty of the Graduate School of Cornell University
in Partial Fulfillment of the Requirements for the Degree of Doctor of Philosophy
by
Kibrom Tafere Hirfrfot December 2017
c
2017 Kibrom Tafere Hirfrfot ALL RIGHTS RESERVED
ESSAYS IN DEVELOPMENT ECONOMICS Kibrom Tafere Hirfrfot, Ph.D.
Cornell University 2017
This dissertation consists of three self-contained papers, which are all related to the welfare consequences of risk and uncertainty.
Chapter one studies the intergenerational effects of maternal early childhood shocks on the human capital outcomes of children. I exploit the 1983-1985 Ethiopian famine as an exogenous source of variation to study the effects of ex-posure to severe shocks in utero and/ or during the first three years after birth on the cognitive, non-cognitive and health capabilities of children of mothers who were exposed to shocks in early childhood. Using data that track children from early childhood through adolescence, I estimate the effects of mothers’ early childhood shock over their children’s life cycle. I find that the famine had a last-ing intergenerational effect. Mothers’ early childhood famine exposure reduces their children’s height-for-age z-score, schooling, locus of control and self-esteem. These effects are persistent from age one through early adolescence. The main inter-generational transmission channel of the shock is children’s maternal hu-man capital endowment. Mothers who suffered the famine in early childhood are shorter and have less schooling. I also find a critical maternal shock duration threshold of three months. These findings point to ineffectiveness of remediation once the damage is done to mothers as young girls. The policy implication is that
threshold should be targeted for health and nutritional interventions.
In chapter two, coauthored with Christopher B. Barrett, Erin Lentz and Birhanu Ayana, we estimate the causal effects of index insurance coverage on the subjective well-being (SWB) of a poor population in rural southern Ethiopia. In-surance coverage may be welfare enhancingex anteby reducing exposure to risk. Yet, if the insurance policy lapses without payout, but having paid a premium, the buyer will be financially worse off and may experience buyer’s remorseex postof the resolution of uncertainty. Theex anteandex postwell-being effects of insurance may therefore differ, especially in the absence of indemnity payments. We sepa-rately identify (1) theex anteSWB effects of current insurance coverage that arise from reducingex anterisk exposure to potential shocks, and (2) theex postbuyer’s remorse effects of lapsed insurance policies that did not pay out. By exploiting the randomization of incentives to purchase a newly introduced index-based live-stock insurance product and three rounds of household panel data, we establish that current coverage generates statistically significant gains in buyer’s SWB. The ex antegains more than offset the statistically significant buyer’s remorse effect of having lost money on insurance that did not pay out. These results suggest that insurance can have significant impact on SWB and illustrate that failure to control for potential buyer’s remorse effects can bias downwards estimates of the welfare gains from insurance coverage.
Chapter three concerns with the determinants of crop diversification in Ugan-dan agriculture. I use three rounds of the Uganda National Panel Survey (UNPS) data, which collects detailed information on land holding and characteristics, crop
production, agricultural inputs and farm management practices to examine the prime motives for observed crop diversification practices. The findings show that crop diversification is determined by a combination of yield and variance con-siderations, and that these considerations vary by crop type. Among the main crops in Uganda, inter-cropping of beans and sweet potatoes appears to be pri-marily driven by average yield considerations while variance (risk) appears to factor prominently in maize inter-cropping decisions. Maize and beans are best suited for inter-cropping, whereas sorghum and matoke yield better results when planted as mono crops. The maize-beans combination is the best crop mix. I also find that crop yields are lower and yield variance higher on larger plots, suggest-ing the inverse productivity-size phenomenon is present in Ugandan agriculture.
BIOGRAPHICAL SKETCH
Kibrom Tafere Hirfrfot received his B.A. degree in economics in 2004 and M.Sc. degree in international economics in 2008, both from Addis Ababa University, Ethiopia. Between his undergraduate and Masters studies, he worked as a gradu-ate assistant at Haramaya University, Ethiopia. He joined the International Food Policy Research Institute (IFPRI)–Ethiopia Strategy Support Program (ESSP) as a research assistant in October 2008. After almost three years at IFPRI, he began his graduate studies at the Dyson School of Applied Economics and Management, Cornell University in August 2011. He will receive his Doctor of Philosophy de-gree in December 2017.
ACKNOWLEDGEMENTS
During my years in graduate school at Cornell University, I have grown both in-tellectually and personally. It was not all smooth sailing. There were ups and downs. There were times when I doubted myself. But, I have been blessed with teachers, friends and family that I could call on. More people have helped me than I can mention here. I am grateful to those who supported and guided me along the way. The friends I will not mention here are not forgotten, I thank them all from the bottom of my heart.
I am grateful to my advisors for their encouragement and guidance through-out my graduate study. I have greatly benefited from their intuitive insights and stimulating conversations. I am indebted to Chrsitopher B. Barrett for teaching me development research practice. I am grateful for his patience during the many times I was losing my way. I am thankful to him for inspiring me to be not just a better researcher but also a better person. I thank John Hoddinott for encouraging me to pursue microeconomic research back when I was at the International Food Policy Institute (IFPRI) before joining graduate school. I thank David Just for al-ways being there whenever I needed help. His encouragements were crucial in the many times I had self-doubt.
I thank David Lee and Arnab Basu for their support with job search in my fi-nal year at Cornell. They kindly agreed to write me recommendation letters. I thank Linda Sanderson and Judy Neno for making my time at Cornell so much more enjoyable. I thank Paul Dorosh for taking a chance on me before I came to Cornell by giving me a job at IFPRI, which opened the door for greater
pos-sibilities for me. I am grateful he continues to mentor and support me. I am thankful to Alemayehu Seyoum Taffesse for introducing me to development mi-croeconomics research and for the many stimulating conversations. Above all, I thank Alemayahu Geda for he helped lay the foundations of my professional life when I took his classes at Addis Ababa University and he agreed to advise me for my Master’s Thesis. He continues to be a mentor and a close friend.
Numerous individuals and organizations were instrumental to my disserta-tion work. I would like to thank Erin Lentz and Birhanu Ayana for fruitful collab-oration. I am grateful for financial support from the African Development Bank under the Structural Transformation of African Agriculture and Rural Spaces (STAARS) program, IFPRI under the Policies, Institutions, and Markets (PIM) re-search program, and the Einaudi Center at Cornell University.
Finally, I would like to thank my family. I owe my mother Letay Birhane a debt of gratitude for being the pillar of my strength, and for her sacrifices through the years. I am grateful to my father Tafere Hirifrifot, my sisters Rahel Tafere and Simret Tafere and my brother Filimon Tafere for being there for me.
TABLE OF CONTENTS
Biographical Sketch . . . iii
Acknowledgements . . . iv
Table of Contents . . . vi
List of Tables . . . ix
List of Figures . . . xi
1 Introduction 1 1.1 Intergenerational Effects of Early Childhood Shocks on Human Capital: Evidence from Ethiopia . . . 4
1.2 Insuring Wellbeing? Buyer’s Remorse and Peace of Mind Effects from Insurance . . . 7
1.3 Diversification and Productivity in African Agriculture: Evidence from Uganda . . . 10
2 Intergenerational Effects of Early Childhood Shocks on Human Capital: Evidence from Ethiopia 13 2.1 Introduction . . . 13
2.2 Background . . . 18
2.2.1 Ethiopian 1983-1985 Famine . . . 19
2.3 Theoretical Framework . . . 21
2.4 Data . . . 29
2.4.1 Measuring Famine Magnitude . . . 33
2.4.2 Measuring Human Capital . . . 42
2.4.3 Descriptive Statistics . . . 45 2.5 Empirical Strategy . . . 47 2.5.1 Child Outcomes . . . 49 2.5.2 Mechanisms . . . 53 2.5.3 Heterogeneous Effects . . . 56 2.6 Results . . . 58 2.6.1 Child Outcomes . . . 58 2.6.2 Mechanisms . . . 68 2.6.3 Heterogeneous Effects . . . 83 2.6.4 Selective Migration . . . 89
2.6.5 Selective Fertility and Mortality . . . 94
3 Insuring Wellbeing? Buyer’s Remorse and Peace of Mind Effects from Insurance 99 3.1 Introduction . . . 99 3.2 Study Setting . . . 103 3.3 Data . . . 108 3.3.1 Research Design . . . 108 3.3.2 Descriptive statistics . . . 113 3.4 Estimation strategy . . . 118
3.5 SWB and vignette correction . . . 124
3.6 Results . . . 127
3.7 Robustness checks . . . 139
3.8 Conclusions . . . 141
4 Diversification and Productivity in African Agriculture: Evidence from Uganda 145 4.1 Introduction . . . 145
4.2 Conceptual Framework . . . 151
4.3 Data . . . 157
4.3.1 Descriptive Statistics . . . 160
4.3.2 Yield and cropping patterns . . . 166
4.4 Empirical Strategy . . . 172 4.5 Results . . . 176 4.5.1 Mean equations . . . 176 4.5.2 Variance equations . . . 183 4.5.3 Skewness equations . . . 187 4.5.4 Robustness checks . . . 190
4.5.5 Plot heterogeneous effects . . . 192
4.6 Conclusions . . . 196
A Chapter 1 of appendix 199 A.1 Derivation of the effects of parents’ early childhood shock on children’s human capital . . . 199 A.2 Figures . . . 201 A.3 Tables . . . 203 B Chapter 2 of appendix 219 B.1 Tables . . . 219 B.2 Attrition Correction . . . 241
C Chapter 3 of appendix 246
C.1 Figures . . . 246 C.2 Tables . . . 250
LIST OF TABLES
2.1 Summary statistics . . . 30
2.2 Individual specific famine measure . . . 35
2.3 Effects of maternal famine exposure on children’s health . . . 59
2.4 Effects of maternal famine exposure on children’s schooling . . . . 62
2.5 Effects of maternal famine exposure on children’s non-cognitive human capital . . . 66
2.6 Effects of maternal famine exposure on maternal health and schooling . . . 70
2.7 Effects of famine exposure on mother’s non-cognitive human capital 72 2.8 Effects of maternal famine exposure on child human capital after controlling for direct mother human capital effects . . . 76
2.9 Effects of maternal famine exposure on household expenditure . . 80
2.10 Effects of maternal famine exposure on household education ex-penditure . . . 81
2.11 Heterogeneous effects of maternal famine exposure duration on child human capital . . . 85
2.12 Child life-cycle effects of maternal early childhood famine exposure 87 3.1 Test of treatment-control covariate balance at baseline . . . 114
3.2 Summary statistics - round 2 and 3 values (pooled), by insurance status . . . 116
3.3 First stage estimates of IBLI uptake and volume of TLUs insured . 129 3.4 Ordered logit regression: Vignette adjusted SWB estimates using IBLI uptake and volume of TLUs insured . . . 133
3.5 The aggregate effect of IBLI on SWB . . . 139
4.1 Land shares allocated to crops (%) in 2011/12 . . . 161
4.2 Household characteristics in 2011/12 . . . 162
4.3 Land (parcel) characteristics . . . 164
4.4 Agro-ecology and “connectedness” of homestead in 2011/12 . . . 165
4.5 Land characteristics in 2011/12 at the parcel level . . . 165
4.6 Crop yield by cropping system . . . 167
4.7 Inputs per hectare in 2011/12 . . . 168
4.8 GMM estimates of mean yield elasticities . . . 178
4.9 GMM estimates of yield variance elasticities . . . 184
A1 Effects of maternal famine exposure on test scores . . . 204 A2 Effects of maternal famine exposure on mothers’ educational aspirations
for children . . . 206 A3 Heterogeneous effects of maternal famine exposure duration on
children’s human capital . . . 208 A4 Life-cycle effects of maternal famine exposure duration on
chil-dren’s human capital . . . 213 A5 Effects of maternal famine exposure on children’s human capital . . . . 217 B1 Annual IBLI premium and out of pocket payments . . . 220 B2 Variable definitions . . . 221 B3 Joint orthogonality test for selection into treatment . . . 226 B4 Comparison of uncorrected SWB and vignette corrected SWB . . . 228 B5 Probit model estimates of IBLI uptake . . . 229 B6 Ordered logit regression: Estimates for vignette adjusted SWB
rel-ative to Borana pastoralists using IBLI uptake and volume of TLUs insured . . . 231 B7 Ordered logit regression: Estimates for SWB using IBLI uptake and
volume of TLUs insured . . . 234 B8 Ordered logit regression: Vignette adjusted SWB estimates using
IBLI uptake and TLUs insured – panel households only . . . 236 B9 Ordered logit regression: Vignette adjusted SWB estimates using
IBLI uptake and volume of TLUs insured with omitted lapsed IBLI 239 B10 Attrition probit estimates . . . 243 C1 GMM estimates of mean elasticities using translog production
technology - marginal effects . . . 251 C2 GMM estimates of variance elasticities using translog production
technology - marginal effects . . . 253 C3 GMM estimates of skewness elasticities using translog production
LIST OF FIGURES
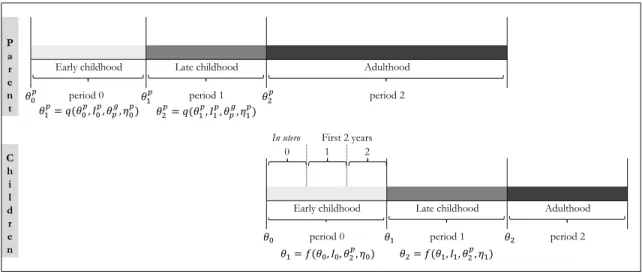
2.1 Intergenerational evolution of human capital . . . 25
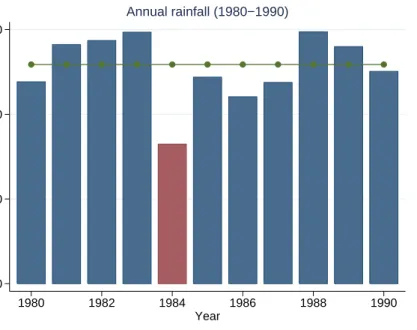
2.2 Patterns of annual rainfall in 1980-1990 . . . 38
2.3 Patterns of annual rainfall in 1980-1990 by Region . . . 39
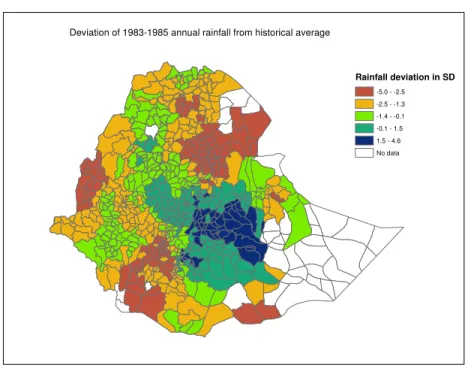
2.4 Deviation of annual 1983-1985 annual rainfall from historical aver-ages in SD . . . 41
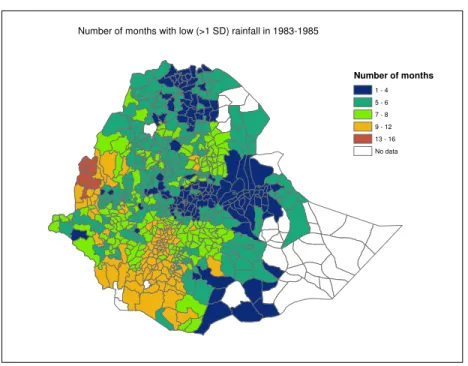
2.5 Number of months with low rainfall (< −1SD) in 1983-1985 . . . . 42
3.1 Temporal structure of IBLI contracts . . . 106
3.2 Timeline of IBLI survey and sales periods . . . 109
4.1 Distribution of yield by cropping system . . . 169
4.2 Distribution of maize yield under pure stand and various dual-crop mixed stand . . . 171
4.3 Maize yield under changing and diverse crop-mixes . . . 172
4.4 Average maize yield under mixed-cropping by quantiles of maize plot . . . 193
4.5 Average beans yield under mixed-cropping by quantiles of beans plot . . . 194
4.6 Average cassava yield under mixed-cropping by quantiles of cas-sava plot . . . 195
4.7 Average matoke yield under mixed-cropping by quantiles of ma-toke plot . . . 196
A1 Patterns of Meher rains 1980-1990 . . . 201
A2 Patterns of August rains 1980-1990 . . . 201
A3 Patterns of Belg rains 1980-1990 . . . 202
A4 Patterns of April rains 1980-1990 . . . 202
C1 Distribution of yield by cropping system . . . 246
C2 Distribution of yield by cropping system . . . 247
C3 Distribution of pure-stand maize yield vs. mixed-stand maize yield with various crops . . . 248
CHAPTER 1
INTRODUCTION
Conditions of risk and uncertainty frame the economic and social behavior of in-dividuals and households in a profound manner. First, households may adopt risk management strategies ex ante that they otherwise would not, to minimize risk exposure. These may include altering the composition of their asset portfolio, livelihood sources or agricultural activities, especially the case in rural communi-ties. Farm households may diversify into farm vs. non-farm income sources, crop vs. livestock or specialized vs. diversified crops. Second, households may engage in risk mitigating strategiesex post to minimize the (negative) effects of adverse events. These may include selling off assets, reducing consumption, withdraw-ing children from school to raise supplementary income or reduce the burden of educational expenses, among others [24, 116].
The prospect and experience of random, negative shocks can have consider-able impact on the immediate and long-term welfare outcomes of households and their members. The nature and size of the effects of such events depends on the magnitude of the shocks themselves as well as the manner with which house-holds respond to them. If househouse-holds have sufficient liquid and non-liquid assets to cushion against unforeseen shocks, the effects of shocks could be less than oth-erwise. In much of the developing world, households lack this critical cushion against shocks. Furthermore, access to credit is limited and agricultural insurance
is almost non-existent.1 As a result, households are forced to engage in destructive risk mitigating strategies such as selling farm implements, consuming seedlings, reducing consumption to preserve assets [117, 44, 147].
Poor communities in the developing world subsist on quantity and quality of foods well below the required daily macro- and micro-nutrient intakes. Under these circumstances, shock mitigation strategies that involve reduction of con-sumption or, in extreme cases, radical changes in concon-sumption patterns in re-sponse to severe droughts (famines) can lead to adverse childhood welfare (health and schooling), adult health and labor market outcomes, or even have intergener-ational consequences. Shocks experienced in childhood tend to have lasting neg-ative impact [46]. Lack of access to food in the formneg-ative period (commonly taken as the first 1000 days –in uteroand two years after birth), affects the expression of the genome and adversely impacts cognitive development and physical health in childhood and later in adulthood [8]. Especially in the case of women, the effects of early exposure could transmitted to their offspring across generational lines.
Financial development plays a crucial role in smoothing welfare over time. Ac-cess to credit would allow households to smooth consumption by shifting savings over time – saving during periods of relative surplus and borrowing during pe-riods of relative shortage. Likewise access to insurance would help minimize the effects of shocks. The development of the financial sector is, however, at a very low level in much of the developing world. The limitations associated with con-1There have been increasing efforts in recent years to expand index insurance offerings in
ventional insurance products – adverse selection and moral hazard – further com-plicate the delivery of insurance to rural communities. In recent years, there has been a growing push to expand the availability of index insurance products to fill in this void. The evaluations of the various index insurance products introduced in last decade or so have shown that access to insurance has been instrumental in improving saving, nutrition and consumption [120, 123, 117].
This dissertation straddles the three dimensions of risk and uncertainty out-lined above. The first chapter studies the intergenerational impacts of childhood shocks on the human capital of children born to mothers who suffered severe shocks as young girls. The second chapter studies the crop diversification deci-sions of farm households in a risky environment. More specifically, it focuses on the determinants of crop diversification by distinguishing between return motives as they relate to the desire to take advantage of synergistic relationships between different crops and risk minimization motives in which farm households trade high return for low variability of yield. The chapter makes qualitative distinctions between distributions with greater lower return odds and those with greater high return odds for the same level of variance. The final chapter studies the effects of index insurance on household wellbeing. Self reported measures of well-being – subjective well-being – are used as outcome variables. The chapter examines the well-being effects of an index based livestock insurance product on household well-being. What follows, presents a more detailed introduction of each of the three chapters that make up this dissertation.
1.1
Intergenerational Effects of Early Childhood Shocks on
Hu-man Capital: Evidence from Ethiopia
The frequency and intensity of extreme weather events including droughts, heat waves, flooding and storms has increased in the last few decades due to climate change related rises in temperature. This rise in incidence of extreme weather has been associated with increase in the economic and social costs of natural disas-ters [207]. The adverse effects of natural disasdisas-ters are likely to be very high in communities that are under-resourced to shoulder the burden of disasters. Rural households in much of the developing world, who primarily depend on agricul-ture for sustenance, fall in this category. Major shocks to agricultural activities in these communities can have devastating consequences due to loss of productive assets and disruptions in nutrition, health, and schooling, among others. Shocks experienced in early childhood are especially damaging [61, 59].
Explorations of the relationship between early childhood environments and child outcomes date back to the early epidemiological works of [18, 19] on the fe-tal origins of disease (popularly known as the “fefe-tal origins hypothesis”). Since, there has been a growing interest in economics to study the effects of adverse ex-posure on various human capital outcomes of children. The evidence so far shows that adverse exposure during the prenatal and postnatal periods negatively affects the health and schooling outcomes of children and their labor market outcomes as adults [187, 62, 148, 5]. Prenatal shock exposure may delay or impair the
expres-sion of parts of the genome that are crucial for cognitive and motor functions and lead to a lasting impact on childhood and adulthood outcomes [169]. Epigenetic and physiological adaptations to nutritional stress during this period and early in the postnatal period may set growth parameters of children, especially girls, and determine their and their offspring’s developmental trajectory [8, 166].
This chapter focuses on the intergenerational effects of childhood shocks on human capital. Despite the flourish of interest in the links between early child-hood environments and various child and adult outcomes over the last two decades, there is little research on the intergenerational aspect of early childhood shocks. Whether shocks experienced in childhood last across generations; and if so, the transmission mechanisms are not fully understood. This paper presents one of the first estimates of the intergenerational effects of early childhood shocks on human capital. Other recent studies of the intergenerational transmission of shocks include [45] and [46] who examine the intergenerational effects of natural disasters in Latin America on human capital, and [191] who study how parents’ exposure to the 1959-1961 Chinese famine affects the cognitive outcomes of their children.
This paper makes important contributions to this emerging literature. First, the focus of this paper is a major drought that was the prime source of a destructive famine in Ethiopia. Though the shock event in focus in the paper is of an extreme nature, drought events tend to be more common. Thus, lessons from this study may have more immediate policy relevance than some of the less frequent shocks
(e.g., earthquakes, volcanoes) that [45] and [46] leverage as exogenous source of variation to identify the intergenerational causal impact of early childhood shocks on human capital. The shock used by [191] is similar to the one this paper. Yet, there is a broad consensus that the Chinese famine was primarily a policy failure rather than a meteorological shock. Further, the data used in this paper are panel in nature and track children from early childhood into adolescence and, thus, per-mit examining the life cycle effects of shocks.
Building on previous studies documenting that the impacts of natural disasters tend to be greater for girls than boys [46, 191], this chapter focuses on the intergen-erational effects of early childhood shocks on the human capital of children born to mothers who suffered severe shocks as young girls. The data come from the Ethiopia Young Lives longitudinal survey, which tracks children from the age of 6-18 months through adolescence. I combine the survey data with weather data from Ethiopia in 1980s. Ethiopia suffered a catastrophic famine in 1983-1985 as rains failed in successive cropping seasons between 1983 and 1985 in most parts of the country, especially in the north. I exploit the geographic variation of the famine and mothers’ age at the onset of the famine to explore whether shocks in early childhood have a lasting intergenerational impact on the health, cogni-tive and non-cognicogni-tive human capital of the children as well as identify potential transmission mechanisms. In a previous study in the same study area, [72] find a negative long term impact of the Ethiopian famine on the height of young adults. They, however, do not examine the intergenerational effects of the famine.
I find that the 1983-1985 Ethiopian famine had a negative intergenerational effect on the human capital outcomes of children of mothers who were exposed to the faminein uteroand/or in their first three years of life after birth. The effect is particularly strong on the health human capital of children. At the mean level of famine intensity and duration, the famine reduces height-for-age (zhfa) by 0.07 standard deviations (about 5%) relative to the World Health Organization (WHO) growth chart reference population. The effect on schooling is slightly smaller, but still statistically significant. At mean famine intensity and duration, the schooling of affected children declines by about 0.05 grades (4%) relative to their unaffected counterparts. The key transmission channels of the shock are maternal human capital outcomes. Mothers exposed to the famine during developmental plasticity are shorter and have less schooling.
1.2
Insuring Wellbeing? Buyer’s Remorse and Peace of Mind
Ef-fects from Insurance
In low income communities with limited means for private risk management, risk exposure can have dire welfare consequences. In addition to its negative effects on contemporaneous welfare, uninsured risk can lead to poverty traps that may bind households in poverty in perpetuity [178, 21]. There is a widespread recog-nition that access to insurance in these environments can help preserve assets as well as encourage efficient allocation of productive resources. However, standard
insurance products are routinely unavailable due to moral hazard and adverse selection problems and high transaction costs in infrastructure-poor areas [29]. In response to the lack of standard insurance products, there have been growing ef-forts in recent years to expand index insurance products in the developing world.
Index insurance addresses some of the key limitations of standard insurance products that limit their expansion in poor communities. It resolves the moral hazard and transaction cost concerns by writing contracts not on realized losses but on an observable exogenous indicator that is believed to be strongly correlated with actual losses. This design feature of index insurance is also the source of its limitation. The exogenous index and actual losses at the household level are not perfectly correlated. As a result, policy holders could experience catastrophic losses that the index may not detect, and thus will not covered by insurance. It is not, therefore, immediately clear whether index insurance is welfare improving. There is little empirical work that indeed index insurance offerings lead to welfare gains to poor rural households [57, 33]. This is further complicated by the fact thatex ante well-being effects may differ from ex post well-being effects after the resolution of uncertainty.
In this chapter, we use a novel approach to estimate the welfare impacts of an index insurance product that was introduced to southern Ethiopia in 2012. We take advantage of recent innovations in the measurement of subjective wellbeing (SWB) [134] to examine the effects of index based livestock insurance (IBLI) on the SWB of pastoralists in Borana zone of southern Ethiopia. The use of SWB
mea-sures is growing in popularity owing to their potential for deeper insights beyond the traditional asset, income and expenditure based measures [75, 89, 146]. We exploit the experimental design features of IBLI to overcome potential selection issues in insurance uptake. Incentives to purchase IBLI were randomized among the target population through distribution of discount coupons and information extension treatments. This enables us to use an instrumental variables method to identify the causal impacts of IBLI on SWB. Moreover, the distribution of the randomized incentives and the survey were implemented over multiple periods. This allows us to distinguishex anteandex postwell-being and isolate the positive peace of mind effects of active insurance coverage from negative buyer’s remorse effects of lapsed insurance.
We find that current IBLI coverage – represented by both a discrete measure of uptake and by a continuous measure of purchase volume – generates statistically significant SWB gains. These gains significantly exceed the statistically significant adverse buyer’s remorse effects. We also show that the estimated SWB gains from insurance would be biased downwards if one omits controls for lapsed insurance coverage that generates buyer’s remorse. The key implication is that IBLI, which has premiums set above actuarially fair rates, improves buyers’ SWB even over a period when pastoralists in southern Ethiopia lose money on the policy. The ex ante peace of mind effect dominates any ex post buyer’s remorse. In other words, even an insurance policy that does not pay out still improves people’s perceptions of their well-being. [12]
1.3
Diversification and Productivity in African Agriculture:
Evi-dence from Uganda
Rainfed agriculture is the prime source of sustenance in rural communities in much of the developing world. As much as 95% of cultivated land in Sub-Saharan Africa and over 60% in East and South Asia and North Africa is rainfed. Un-der these conditions, rainfall variability can impose significant challenges to rural livelihoods. The threat of weather shocks is further compounded by lack of ac-cess to credit and insurance for protecting consumption and assets. Faced with these circumstances, rural households may engage in otherwise inefficient risk management practicesex anteand risk mitigating strategiesex post. Crop diversi-fication is one such private risk management strategy in which farm households may trade-off lower returns for lower variance.
While there has long been much focus on the income stabilizing role of crop diversification, its potential for increasing productivity through inter-crop syner-gies is yet to receive similar attention. Crop rotation stabilizes soil fertility [149], whereas inter-cropping boosts productivity by exploiting symbiotic complemen-tarity of crops [50]. Studies of the productivity dynamics associated with crop diversification are primarily conducted on experimental plots, with limited focus on the potential drivers of observed diversification practices as they relate to risk and return. Much of the relevant empirical studies has been in settings where crop production is dominated by a few crops [129] or multiple varieties of a single crop
[76]. In most of Sub-Saharan Africa, farming is a complex multi-crop enterprise, in which farmers engage in the production of several crops on small plots, leading to complex inter-crop dynamics. A fuller understanding of on-farm crop dynamics in such environments requires an analysis of a broad range of crops.
This chapter studies the determinants of crop diversification decisions in Uganda. The results of this paper are crucial for understanding the prime mo-tives for crop diversification with emphasis on devising policies to maximize the gains from diversification and minimize associated downsides. To that end, first it examines the contributions of mean, variance and skewness in crop choice, with a particular focus on determining whether yield and/ or risk are the primary con-siderations in crop decisions. Second, it investigates whether inter-crop synergies vary with crop plot area to draw implications for optimal farm size and crop mix.
I use the 2009/10, 2010/11 and 2011/12 rounds of the Uganda National Panel Survey (UNPS) data, which were collected by the Uganda Bureau of Statistics (UBOS) under the Living Standards Measurement Study – Integrated Surveys on Agriculture (LSMS–ISA) project. The surveys contain detailed agriculture mod-ules and collect information on land holding and characteristics, crop production, agricultural inputs and farm management practices. The survey is conducted twice a year to reflect the seasonality in Ugandan agriculture. Thus, in total, this paper uses six rounds of data to examine the drivers of crop choice.
The main findings are: first, the determinants of crop diversification vary by crop type. The prominence of mean and variance considerations differs by
crops. Average yield appears to be the key factor in beans and sweet potatoes inter-cropping with other cereals and tubers, while variance seems to be the main motive for maize intercropping. Second, crop productivity decreases with plot size for all major crops in Uganda. This result is consistent with the inverse farm productivity size relationship. Larger plots are also associated with high yield variance, though this is mitigated by the positive skewness associated with larger plots. Third, maize and beans are most suitable for intercropping, whereas sorghum and matoke are least suitable. When intercropped with other crops, maize reduces yield variance, while beans seem to increase yield. The maize-beans combination represents the best crop mix in Uganda. On the contrary, when intercropped with other crops, matoke and especially sorghum reduce average yield of other crops across the board. Thus, they should be planted as mono crops.
CHAPTER 2
INTERGENERATIONAL EFFECTS OF EARLY CHILDHOOD SHOCKS ON HUMAN CAPITAL: EVIDENCE FROM ETHIOPIA
2.1
Introduction
Climate change-related rise in temperature has increased the frequency and in-tensity of extreme weather events in the last few decades. The rise in incidence of droughts, heat waves, flooding, and storms has been associated with surge in economic and social costs of natural disasters [207]. In much of the developing world where a significant share of household income is sourced in the agricultural sector, such events have adverse welfare consequences due to loss of productive assets and disruptions in nutrition, health, and schooling, among others. Within the household unit, the effects of weather shocks may differ based on individu-als’ characteristics. Shocks experienced in early childhood tend to have greater negative impact on human capital and labor market outcomes [12, 148, 59, 3].
Since the early epidemiological studies by [19, 18] on the fetal origins of dis-ease, there has been a growing body of literature in economics exploring the effects of adverse exposure during the prenatal period [62, 6] and at various stages in the postnatal period [187, 63] on health, schooling and labor mar-ket outcomes. These studies typically leverage exogenous sources of variation (natural experiments) to circumvent the potential confounding between
unob-served individual and family characteristics and early childhood environments [187, 35, 64, 2, 125, 3, 5].
Much of the literature on early childhood shocks focuses on the prenatal pe-riod, which is perhaps the most sensitive period for child development. Disrup-tions during this period may delay or impair the expression of parts of the genome that are crucial for cognitive and motor functions and lead to a lasting impact on childhood and adulthood outcomes [35, 62, 169, 5, 6]. Recent studies show that the adverse effects of such shocks are greater for females [45, 46, 191, 7]. Irreversible physiological adaptations to nutritional stress during critical prenatal and post-natal periods may set the growth parameters of girls [8, 96], which may predeter-mine their offspring’s developmental trajectory and later life outcomes [166]. This intergenerational aspect of shocks is surprisingly understudied.
This paper presents one of the first estimates of the intergenerational effects of early childhood shocks on human capital. Other recent studies of the intergener-ational transmission of shocks include [46], who examine the effects of the 1970 Ancash earthquake in Peru on schooling and child labor. They find that maternal in uteroshock exposure negatively affects child labor and schooling. [191] study how parents’ exposure to the 1959-1961 Chinese famine affects the cognitive out-comes of their children. They find that the daughters of fathers who suffered the famine as young boys perform worse in cognitive tests. In a more recent paper, [45] explores the intergenerational effects of childhood exposure to natural disas-ters that occurred in Latin America in the 20th century on schooling, health and
labor market outcomes, among others. Early childhood exposure (in uteroand first two years after birth) to natural disasters is found to have the greatest impact on human capital and adult labor market outcomes. This paper extends this emerg-ing literature to a broad range of human capital measures over children’s life cycle in the context of an African country where agriculture is the prime source of sus-tenance. In such environments, weather shocks can have destructive lasting effect on the human capital of individuals who suffer the shocks directly and their off-spring.
Ethiopia suffered a catastrophic famine in 1983-1985 as rains failed in succes-sive cropping seasons between 1983 and 1985 in most parts of the country, espe-cially the northern provinces of Tigray, Wello and Eritrea.1 The central highlands
and western parts of the country were largely unaffected. I exploit the geographic variation of the famine, parents’ age at the onset of the famine and unique data that track children from the age of 6-18 months through early adolescence to ex-plore whether shocks in early childhood have a lasting impact on the health, cog-nitive and non-cogcog-nitive human capital of the children of mothers who suffered the shocks as young girls. In a previous study, [72] find a negative longterm im-pact of same shock on the height of young adults who were 12-36 months old at the peak of the famine. They do not, however, examine the intergenerational effects of the famine.
The analysis in this paper extends beyond the extensive margin and examines 1Eritrea has since become an independent state.
variation in famine durations (in months) to determine whether shocks of cer-tain duration are more damaging than others. Understanding the role of famine duration is important for efficient targeting of groups with the greatest need for assistance. The panel nature of the data permits exploring the effects of maternal early childhood shocks on children’s human capital over their life cycle. I evalu-ate the effect size from age 1 through age 12 in a three-year interval. This provides evidence on whether early disadvantages are malleable through remediation ef-forts, which is crucial for devising effective policies to reduce intergenerational transmission of shocks.
This paper also seeks to determine the intergenerational shock transmission mechanisms. To this end, I focus on children’s maternal human capital endow-ment and parental investendow-ments. Maternal human capital is an essential input in children’s human capital production. Negative shocks to mothers’ human capital may have persistent impact through generations in a complex feedback processes [61, 59, 108]. Likewise, early childhood shocks may impair mothers’ adulthood earnings and investments in their children’s schooling and health.
This paper makes two important contributions. First, it contributes to the early childhood development literature by extending the study of the impacts of ad-verse early childhood exposure on childhood and adolescent outcomes to inter-generational transmission of the effects of severe shocks. Second, it provides an indirect test for the intergenerational persistence of poverty. The presence (or ab-sence) of intergenerational persistence of the effects of childhood shocks points to
early conditions (e.g., family income, education) as one of the potential causes (or not) of poverty persistence across generations [30, 137, 34].
I find that the 1983-1985 Ethiopian famine had a negative intergenerational ef-fect on the human capital outcomes of children of mothers who were exposed to the faminein utero and/or in their first three years of life after birth. The effect is particularly strong on the health human capabilities of children. At the mean level of famine intensity and duration, the famine reduces height-for-age (zhfa) by 0.07 standard deviations (about 5%) relative to the World Health Organization (WHO) growth chart reference population. The effect on schooling is small, but statistically significant. At mean famine intensity and duration, children’s school-ing decreases by about 0.05 grades (4%). The key transmission channels of the shock are maternal human capital outcomes. Mothers exposed to the famine dur-ing developmental plasticity are shorter and have less schooldur-ing.
The rest of this paper is organized as follows. The next section provides a brief background on the Ethiopian famine. Section 3 presents the conceptual frame-work of the paper. Section 4 discusses the data, the various famine and human capital measures and summary statistics. Section 5 presents the empirical strat-egy. Section 6 discusses the main results of the paper. Section 7 concludes.
2.2
Background
The agricultural sector is the mainstay of the Ethiopian economy and accounts for 40% of GDP and 80% of employment [209]. It is dominated by subsistent rain-fed smallholder agriculture. The production environment is characterized by increas-ing land degradation and erratic weather conditions. Variability in the amount and seasonal distribution of precipitation has been a major cause of crop failure and food shortages. The frequency of irregular rainfall patterns and droughts has increased over the recent decades [77, 200]. In some cases, the food shortages associated with droughts have led to catastrophic famines.
In the last half century alone, there have been at least three famines in Ethiopia, of which the 1983-1985 famine is widely considered the worst.2 Estimates of the number of people killed range between 400,000 and over a million. [74] estimates that between 600,000 and one million people were killed due to the famine. [70] puts the figure closer to 400,000, though he notes that is likely to be a lower bound. [128] argues the true figure of the casualties of the famine is 700,000. Despite the differences in the estimates of famine casualties, the famine’s impact has been undoubtedly devastating. In fact, [164] notes that in terms of the number of deaths relative to population size, the 1983-1985 Ethiopian famine ranks as one of the worst in the world in recent history.
2.2.1
Ethiopian 1983-1985 Famine
The rainfall pattern in Ethiopia is characterized by a bi-modal distribution. In the predominantly crop producing central and northern areas of the country, the main rainy season (meher) is in June-September and accounts for 85-90% of annual agricultural output nationwide. Some central and eastern highlands also receive rainfall during a short rainy season (belg) between March and May. In the southern parts of the country, where the primary source of livelihood is pastoralism, the main rainy season is in March-May, followed by a short rainy season in October-November.
The famine started 1983 whenmeherrains failed in Tigray and Wello. It quickly spread to the rest of the country when the 1984belg rains failed in belg growing highland areas in central Ethiopia [70]. The drought condition continued inmeher 1984 through belg 1985. The famine was most severe in 1984. Using historical rainfall data for the 1961-1999 period for themeher season, [185] show that 1984 was by far the driest year.3 Low pre-meherrains were followed by early onset of
meherrains, which quickly dried up. The extended dry spell led to a very short effective growing season and widespread crop failures throughout the country. The famine ended with the return of normalmeherrains in 1985.
The famine condition was further exacerbated by insurgencies and the govern-3Using annual rainfall data (including bothmeherandbelgrains) for the 1961-1987 period, [204]
report similar results. They show 1984 was the driest year for the whole of Ethiopia, as well as the northern provinces of Wello and Tigray, and Hararghe in the east.
ment’s counter-insurgency strategies in northern Ethiopia. To counter the rebel movements, the government had mobilized large military campaigns, which di-verted resources from relief effort.4 The government had also restricted access to
relief aid in rebel controlled areas in Tigray and Eritrea [70]. There was limited access to food and medicine to people (especially women and children) severely weakened by the famine in a handful of relief centers in government controlled areas. While the move to relief centers allowed access to much needed food, poor health facilities and hygiene conditions led to the rapid spread of infectious dis-eases in the centers and the death of thousands. Further, restrictions on the move-ment of people and goods in the northern provinces constrained migration of able bodied individuals to relatively less affected parts of the country in search of em-ployment and limited commercial imports of food from surplus growing areas, compounding the impacts of the famine.
In terms of age distribution, children under the age of 10 and adults of age 60 and above were disproportionately affected by the famine. [128] shows that among households displaced from the two most famine-affected provinces of Tigray and Wello, about 26% of children under the age of 5 and 14% of children between age 5 and 9 died during the famine. For the 0-4 age group, males were slightly more likely to die (27% vs. 24%). In the 5-9 age bracket, the female mor-tality rate was much higher than that of males (19% vs. 9%). Likewise, 20% of people in the 60 plus age group perished, with females most affected than males.5
4In 1984 the government had allocated 46% of the national budget to military spending [203]. 5Note, however, that these are likely to be upper bound estimates of famine-related excess
re-Though it is not clear that famine was the sole driver of the high mortality, the fact that compared to 1981, the share of 0-14 and 65+ age groups in the popula-tion significantly decreased in 1984-1985 suggests that the famine was perhaps the prime cause of the rise in mortality of these groups [127]. The key implication of the high incidence of famine-related excess mortality among children in the 0-4 age group is that estimates of the impact of the famine are likely to be attenuated downwards. The problem is further compounded by the fact that children in the reference (control) group for the purpose of this paper (age 4-7 at the start of the famine) were also affected, albeit less, by the famine.
2.3
Theoretical Framework
I use the dynamic model of human capital development by [61, 108] and [59] to study the effects of maternal exposure to severe shocks (famine) on the hu-man capital of their offspring. The starting point in this framework is the multi-dimensional nature of human capital. At any given time t, the human capi-tal vector is given as θt = (θc,t, θn,t, θh,t), where θc, θn, and θh are cognitive,
non-cognitive/socio-emotional, and health capabilities, respectively. The formation of capabilities (skills) follows a multistage technology in the sense that skills at one stage of the life cycle serve as inputs at a later stage. Investments in skills will, therefore, have lasting effect by increasing the stock of skills, which will be used as inputs in the formation of future skills.
In this framework, early life adverse exposure may have persistent negative impact on outcomes later in life for at least two reasons. First, skills are dynami-cally self-reinforcing. High cognitive skill in one period leads to higher cognitive skill in a later period, and a higher health capability cross fertilizes (i.e., creates a conductive environment for acquisition of) cognitive skill. Heckman and co-authors refer to this effect as “self-productivity”; it includes own and cross capa-bility effects. Famines affect human capital by reducing the stock of skills available for self-production. Second, shocks reduce the productivity of future investments in human capital, a process called “dynamic complementarity.” Shocks to a child’s health, for example, will have a negative effect on returns to investment on future learning [61, 59].
There are multiple sensitive periods in a child’s life that are crucial to the de-velopment of human capital. Some skills are more readily acquired at one stage than another, and some skill deficits are more malleable at one stage than another. The most important period in a child’s development is the periodin utero[5]. Ad-verse experiences at this stage are known to cause significant damages to birth weight, cognitive ability, later life height and weight, and lead to various diseases [177, 96, 19]. Even within the prenatal period, early exposure may have a dif-ferent impact than exposure later during pregnancy. [177] shows that exposure to shocks during the first two trimesters has adverse effect on cognitive ability, whereas exposure during the third trimester reduces child height.
of skills that determine later life outcomes. Children who are exposed to shocks during this period tend to perform relatively poorly in school and labor markets [187]. [60] find similar results in a randomized evaluation of the Abecedarian pro-gram in the US. They find significant cognitive and non-cognitive gains for chil-dren who enrolled in the program early (4 months), but not for those who only experienced the intervention later (age 5). Some studies document even early ado-lescence years (age 10-12) can be crucial to the development of certain dimensions of human capability. [162] finds a negative relationship between age of acquisition of primary and secondary languages and language proficiency, with the relation-ship flattening out around the age of 12. Likewise, the fact that IQ scores tend to stabilize around age 10 [184] suggests that the critical period for acquisition of cognitive capability is before age 10. Non-cognitive skills are malleable even after age 20 [65]. Once critical periods are missed, remediation interventions may not reverse the damages already done.
Following [61, 108, 59], the technology summarizing the formation of skillk ∈ {c,n,h}is given as:
θk,t+1 = fk(θt,It, θp, ηt) (2.1)
where,θk,t,It,θp, andηtdenote the stock of skillkat timet, parental investments in
children at timet, parental endowments, and shocks at timet. The skill produc-tion funcproduc-tion, fk, is monotonically increasing in all of its arguments, twice
differ-entiable, and concave inI. After solving recursively, (2.1) can be rewritten as:
whereθ0is the initial skill endowment of the child and is determined by both
ge-netic and environmental factors. Equation (2.2) shows that the stock of skills at any given time t depends on endowment as well as investments and shocks at different stages in the life cycle. Early shocks are more destructive than shocks in adolescence, and more so for disadvantaged children, since early disadvan-tages persist through the self productivity and dynamic complementarity pro-cesses [108, 60].
For ease of exposition, I divide the developmental periods of a child in two: early childhood, including the period in utero, denoted period 0; and late child-hood, which constitutes the rest of childchild-hood, denoted period 1. Adulthood is denoted period 2. Following [61], the process of human capital development can be described by an overlapping generations model, in which each individual lives for three periodst ∈ [0,2] in a household consisting of an adult and a child–the first two periods (t = 0and t = 1) as a child andt = 2 as a parent. As shown in Figure 2.1, the adulthood period of the parent coincides with the two childhood periods of the child.6 In each period,θt is stock of skills at the start of timetandIt
andηt are investments and shocks betweentandt+1.
The primary interest of this paper is in childhood outcomes. Thus, I focus on the first two periods of the life cycle. The stock of skills in late childhood can be 6The early childhood period is defined as the entire period between conception and second
birthday. This is just meant to capture the “first 1,000 days” commonly taken as the most important period for childhood development. The definition can be relaxed as necessary.
period 0 period 1
In utero
0 1 2
period 0 period 1 period 2
First 2 years C h i l d r e n
Early childhood Late childhood Adulthood
P a r e n t
Early childhood Late childhood Adulthood
period 2 𝜃1𝑝 𝜃2𝑝 𝜃0 𝜃1 𝜃2 𝜃1 𝑝 = 𝑞(𝜃0 𝑝 , 𝐼0 𝑝 , 𝜃𝑝 𝑔 , 𝜂0 𝑝 ) 𝜃2𝑝= 𝑞(𝜃1𝑝, 𝐼1𝑝, 𝜃𝑝𝑔, 𝜂1 𝑝) 𝜃1= 𝑓(𝜃0, 𝐼0, 𝜃2 𝑝, 𝜂 0) 𝜃2= 𝑓(𝜃1, 𝐼1, 𝜃2 𝑝, 𝜂 1) 𝜃0𝑝
Figure 2.1: Intergenerational evolution of human capital
Note: Figure 2.1 shows the intergenerational human capital production function. A child’s human capital at any periodtdepends on initial endowment and investments through the child’s life up to periodt.
described by7
θk,1= fk(θ0,I0, θp, η0) (2.3)
where, θ0, I0, and η0 are vectors of skill endowment, parental investments, and
shocks on cognitive, non-cognitive, and health capabilities. Parental investments and early childhood skills are endogenous and are affected by shocks. Parental investment in skillkis given as:
Ik,0 =gk(θ0, θp, η0). (2.4)
Similarly, parental endowment, θp = θ p
2 (parents’ stock of skills in adulthood),
depends on parents’ late childhood capabilities, θ1p, late childhood investments, 7I assume that investments and shocks in adulthood have little impact on human capital.
I1p, parental endowment at childhood,θg, and late childhood shocks,η p 1. 8 θp= q(θ p 1,I p 1, θg, η p 1). (2.5)
This framework can be used to study the effects of maternal shocks at different stages of the life cycle on the human capital of their children. For analytical ease, I use a compact form of the skills vector, which can easily be extended to look at shocks to a specific skill type.9
The effect of a parent’s late childhood shock on her offspring’s human capital can be stated as:10
∂θk,1 ∂ηp 1 = ∂θk,1 ∂I0 ∂I0 ∂θp ∂θp ∂ηp 1 + ∂θk,1 ∂θp ∂θp ∂ηp 1 . (2.6)
Early childhood investments in parent’s capabilities, I1p, is endogenous, i.e.,
I1p =g(θ1p, θg, η p
1). Thus, ∂θp ∂ηp
1 in (2.6) can be rewritten as:
∂θp ∂ηp 1 = ∂θp ∂ηp 1 + ∂θp ∂Ip 1 ∂Ip 1 ∂ηp 1 . (2.7)
Substituting (2.7) in (2.6), we find a decomposable impact of parental childhood 8I follow similar indexing notation for both the child and the parent. To distinguish between
generations, I index (superscript) parent skills withpand grand parents skills withg.
9The effect of a shock to a parent’s skillm∈ {c,n,h}, on a child’s capabilitykcan be stated as:
∂θk,1 ∂ηp m,1 = X l=c,n,h X j=c,n,h ∂θk,1 ∂Il,0 ∂Il,0 ∂θj,p ∂θj,p ∂ηp m,1 + X j=c,n,h ∂θk,1 ∂θj,p ∂θj,p ∂ηp m,1 .
10Here, I show only the effect of parents’ late childhood shocks on their children’s human capital.
shocks on child outcomes as: ∂θk,1 ∂ηp 1 = ∂θk,1 ∂I0 ∂I0 ∂θp + ∂θk,1 ∂θp ! ∂θ p ∂ηp 1 + ∂θp ∂Ip 1 ∂Ip 1 ∂ηp 1 ! = ∂θk,1 ∂θp ∂θp ∂ηp 1 | {z } Self Productivity + ∂θk,1 ∂I0 ∂I0 ∂θp ∂θp ∂ηp 1 +∂θk,1 ∂θp ∂θp ∂Ip 1 ∂Ip 1 ∂ηp 1 | {z } Mixed channel + ∂θk,1 ∂I0 ∂I0 ∂θp ∂θp ∂Ip 1 ∂Ip 1 ∂ηp 1 | {z } Dynamic complementarity . (2.8)
Equation (2.8) presents a compact solution of the effects of parental shock ex-posure on a child’s human capitalk. It includes both direct (effect of a shock to a parent’s health in childhood on her child’s health) and cross (effect of shocks to a parent’s health in childhood on her child’s cognitive capabilities) effects. The first term measures the pure self-productivity effect of parental exposure to adverse shocks. Shocks experienced by a parent reduce the parent’s capabilities, which in turn reduce a child’s human capital through the “skill begets skill” notion. It is, therefore, expected to be negative.
The last term in (2.8) is the pure dynamic complementarity effect. Parents’ childhood shock exposure reduces the return on investments in their human capi-tal, and hence the stock of parents’ stock of skills at adulthood. Low parental skills (children’s parental endowment), in turn, leads to low child capabilities. The sign of the dynamic complementarity effect is, however, not straight forward due to competing mechanisms. Even though ∂θk,1
∂I0 and ∂θp
∂I1p are both positive, the signs of ∂I0
∂θ and
∂I1p
relative price effects [177]. A fall in wage rates reduces the opportunity cost of time invested in child care, and conceivably lead to increase in time investments [187]. By contrast, a rise in the relative price of food may have a negative real income effect and retard investments on children. Second, the income effect of a fall in agricultural outputs during famines may reduce investments in children for farm households. Moreover, parental remediation of adverse exposures can compensate for the effects of a shock if parents invest more in the affected child or reinforce the effect if, rather, investments are directed to the unaffected child to maximize returns. These combine to generate an ambiguous dynamic comple-mentarity effect.
The two middle terms in (2.8) constitute a mixed channel, which emanates from the inter-generational nature of the mechanism driving the effects of shocks. The second term measures the effect of a parent’s childhood shock exposure on her child that is transmitted through the child’s indirect investment channel. Though ∂θk,1 ∂I0 >0and ∂θp ∂ηp 1 <0, the sign of ∂I0
∂θp is ambiguous leading to an ambiguous
sign for this term. The third term captures the effect of parental shock exposure channeled through the child’s indirect parental endowment channel. Its sign is, however, ambiguous since ∂I
p 1 ∂ηp
1 cannot be readily signed, leaving the mixed
chan-nel effect ambiguous. Thus, the theoretical predictions of the impacts of early parental shocks on the human capital of children are not clear.
In this paper I use exogenous exposure to famine in Ethiopia in the early 1980s to identify the causal effects of maternal early childhood shocks on their children’s
outcomes. I use rich panel data to estimate theneteffects of the famine on cogni-tive and health outcomes of the children of parents who were exposed. The cor-respondence between a child’s human capital and her outcomes can be thought to be defined by the functionh(.)[26], which translates human capital stock in a given periodtinto performanceY in the same period. Measured performance in timetfor some dimension jis, thus,Yt,j =h(θt). To identify mechanisms, I estimate
the effects on parental cognitive, non-cognitive (socio-emotional) and health out-comes, and other parental inputs such as health, schooling, and food expenditure.
2.4
Data
I use information on mothers’ age to recover their birth cohort during the 1983-1985 Ethiopian famine. I combine the birth cohort data with a plausibly exogenous geographic variation in the intensity and duration of drought condition during the famine to identify the causal impacts of maternal famine exposure on the hu-man capital of children. The Ethiopia Young Lives (YL) data track children from early childhood through early adolescence over a 12 year period. In 2002, a base-line survey was conducted on a sample of 2,000 children born in 2001-2002 (6-18 months old) living in 20 sites across Addis Ababa, Amhara, Oromia, Southern Na-tions and Nationalities Region (SNNPR), and Tigray regions. Follow up surveys were conducted in 2006, 2009, and 2013.11
Table 2.1: Summary statistics
Survey round
Variables 1 2 3 4 Obs. Mean Sd Min Max
Child outcomes
Height-for-age z-score X X X X 3459 -1.36 1.26 -4.98 4.92 Child height (cm) X X X X 3494 108.89 26.50 55.30 178.00 Child stunted (<-2 SD) X X X X 3493 0.30 0.46 0.00 1.00 Child severely stunted (<-3 SD) X X X X 3493 0.10 0.30 0.00 1.00 Child schooling (year) X X 1559 2.29 1.96 0.00 8.00 PPVT score (raw) X X X 2472 46.88 37.33 0.00 196.00 Math score (raw) X 1602 8.51 6.14 0.00 28.00 Child education aspiration (year) X 851 13.88 2.53 0.00 17.00 Child locus of control X X X 2606 1.94 1.49 0.00 4.00 Child self esteem X X X 2606 1.67 1.30 0.00 4.00
Mother outcomes
Mother height(cm) X 804 158.78 5.81 133.35 178.20 Mother schooling (year) X X X X 3187 3.22 4.02 0.00 16.00 Mother’s education aspiration for child (year) X X X 2583 15.32 2.44 0.00 18.00 Mother locus of control X X X 2606 2.35 0.91 0.25 4.00 Mother self esteem X X X 2606 2.69 0.65 0.22 4.00
Child and household characteristics
Child gender (male=1) X X X X 3523 0.53 0.50 0.00 1.00 Child age (months) X X X X 3523 78.29 49.12 6.02 154.00 Child age order X X X X 3523 1.87 1.12 1.00 9.00 Child number of siblings X X X X 3523 3.02 1.71 1.00 11.00 Household head age X X X X 3521 38.13 11.03 5.00 110.00 Household head gender (male=1) X X X X 3522 0.81 0.39 0.00 1.00 Household head schooling (year) X X X X 3522 4.70 4.56 0.00 25.00 Household size X X X X 3523 5.39 1.83 2.00 15.00 Mother age X X X X 3523 28.07 5.02 18.00 47.00 Father age X X X X 2989 36.60 7.31 19.00 86.00 Father schooling (year) X X X X 2680 5.04 4.40 0.00 18.00
Other controls
Urban-rural dummy (urban=1) X X X X 3523 0.42 0.49 0.00 1.00 Shock index X X X X 3523 0.11 0.11 0.00 0.68 Wealth index X X X 3523 0.31 0.18 0.01 0.90
Table 2.1 –Continued from previous page
Survey round
Variables 1 2 3 4 Obs. Mean Sd Min Max
Food expenditure per month (Birr) X X X 3484 96.92 57.50 8.38 744.66 Non-food expenditure per month (Birr) X X X 3484 73.84 130.56 0.26 4,325.19 Total expenditure per month (Birr) X X X 3484 168.07 153.27 9.70 4,280.61 Education expenditure per year (Birr) X X X 3484 493.45 1,456.56 0.00 35,558.00 Health expenditure per year (Birr) X X X 3484 249.40 2,801.31 0.00 144,000.00
Drought measures (external data)
Negative rainfall deviation (SD) 3523 0.25 1.41 -2.63 2.07 Negative rainfall deviation in early childhood (SD) 3523 0.07 0.89 -2.63 2.07 Mother’s # months of famine 3364 3.87 2.00 1.00 7.00 Mother’s # months of famine in early childhood 3514 1.10 1.89 0.00 7.00
Note: Check marks in columns 2-5 indicate whether data on a variable in column 1 were collected in survey rounds 1-4. Food, non-food and total expenditure are measured in real 2006 Birr per capita. Education and health expenditures are measured in nominal Birr. The drought measures are limited to growing seasons (as opposed to full year) specific to
weredas. Inbelgandmehergrowingweredas, the drought measures reflect the condition for the two seasons. Formeher-only
growing areas, it covers themeherseason only.
The survey has child, household, and community modules. In the household module, data on household composition, parental background, assets, food and non-food expenditure, social capital, child care, child health and exposure to var-ious shocks were collected. Caregiver perceptions, attitudes and aspirations for child and family were also covered. Data on time use of family members, child weight and height were also collected. The child module asks children about their attitudes to work and school, perception of how they were treated by others, as well as their hopes and aspirations for the future. Data on children’s test scores (language comprehension and math) has been collected beginning in round 2. The community survey provides information on the economic, social, and environ-mental context of each community. It asks questions on access to various services
(such as education, health, electricity, telephone etc.), population, religion, and ethnicity, language, political representation, crimes, environmental changes and community networks. Table 2.1 presents a list of key variables and the survey round in which they were collected.
The household survey data are matched with weather (rainfall) data. The weather data are from the National Oceanic and Atmospheric Administration (NOAA) AgMERRA climate dataset, which provides daily time series over the 1980-2010 period [81, 180, 181].12 The data are originally provided at 0.25 degree (≈25km×25km) resolution. These data are converted towereda level rainfall data by applying weights based on the area size of the grid cell relative to thewereda, i.e., percentage of eachwereda’s area occupied by the grid cell. All grid cells that fully fall within a wereda receive equal weights whereas intersected cells (grids that fall between two or moreweredas) receive smaller weight proportional to area size.
12AgMERRA stands for Agricultural Modern-Era Retrospective analysis for Research and
Ap-plications. The AgMERRA dataset provides daily, high-resolution meteorological time series by combining daily resolution data from retrospective analysis with ground level and remotely-sensed observational datasets for temperature, precipitation and solar radiation. It gives particular consideration to agricultural areas, and agronomic factors that affect plant growth such as mean growing season temperature and precipitation, seasonal cycles, inter-annual variability, the fre-quency and sequence of rainfall events, and the distribution of sub-seasonal extremes, leading to substantial reduction in bias [181].
2.4.1
Measuring Famine Magnitude
The main cause of the famine was an extended drought that lasted several crop-ping seasons. Thus, the geographic and temporal variation in the drought condi-tion is used as a proxy for the famine. I construct two measures of famine magni-tude: the deviation of average rainfall during the 1983-1985 famine from historical average (rdev), and the number of months with rainfall shortage of half or higher standard deviations (SD) (mdry). While these measures are likely to be correlated, they measure different aspects of a famine condition.Rdevmeasures the intensity of famine (the extent of dryness), whereasmdry measures the duration of a dry spell. A famine can be deep (extremely dry weather condition) but of short dura-tion, or vise versa. The nature of interventions called for by the two dimensions of famine may, thus, differ.
Both measures take the seasonality of agriculture in Ethiopia and the geo-graphic variability of rainfall into account. The famine started in themeherseason of 1983 and ended by the start ofmeherrains of 1985. Some of theweredas covered in the Young Lives survey receive rainfall in both meherand belg seasons, while others get onlymeherrains. The famine measures are constructed to reflect these realities. Accordingly, the rainfall deviation measure captureswereda-specific total monthly rainfall deviations during themeherand/orbelgseasons.
The rainfall deviation measurerdevis constructed as:
rdevm,w,y =
Mar−May1985
X
−rainw,m,y−rainw,m
where rainm,w,y is monthly precipitation in wereda w in the month of m in year y
in millimeters, (rainw,m) is historical (1980-2010) average of rainfall inwereda wfor
month m, and sdrainw,m is standard deviation of monthly rainfall in wereda w in
month m over the same 1980-2010 period.13 If a wereda receives rainfall in both
meherand belgseasons, the deviation measure would covermeher1983,belg1984, meher1984 and belg1985. If, on the other hand, awereda gets rainfall only during themeherseason, the relevant measure would covermeher1983 andmeher1984.
The famine measure in equation 2.9 captures the wereda level famine condi-tions for everyone in 1983-1985 irrespective of their age. The obvious candidate to capture the differential impacts due to exposure in early childhood is an in-teraction term between thiswereda-specific measure and a dummy variable that takes value 1 if the famine took place during early years of childhood. The extent of famine exposure in early childhood, however, varies depending on when the mother was born within the famine period. Using mother’s age, I construct an individual specific measure (“interaction term”) that better reflects the extent of exposure. A mother born in 1981 would experience the famine at age 2 in 1983, a mother born in 1983 would experience the full famine —in uteroin 1983, at age 1 in 1984 and age 2 in 1985, whereas a mother born in 1985 would experience the famine onlyin uteroin 1985. This measure is essentially the sum of interactions of famine year specific negative rainfall deviation and mother’s birth year dummies (see panel (a) of Table 2.2 for details).
13To avoid the effect of the outlier famine years, the 1983-1985 period is excluded in computing
Table 2.2: Individual specific famine measure
Age at baseline
Birth year (2002) in utero Famine exposure Famine measure
a) Famine intensity 1980 23 1980 None 0 1981 22 1981 1983 (age 2) P Jun−S ep1983− rainw,m,y−rainw,m sdrainw,m
1982 21 1982 1983 (age 1) and 1984 (age 2) PJun−S ep1984
Jun−S ep1983−
rainw,m,y−rainw,m
sdrainw,m
1983 20 1983 1983 (age 0 -in utero), 1984 (age 1) and 1985 (age 2) PMar−May1985
Jun−S ep1983 −
rainw,m,y−rainw,m
sdrainw,m
1984 19 1984 1984 (age 0 -in utero) and 1985 (age 1) PMar−May1985
Jun−S ep1984 − rainw,m,y−rainw,m sdrainw,m 1985 18 1985 1985 (age 0 -in utero) P Mar−May1985− rainw,m,y−rainw,m sdrainw,m 1986 17 1986 None 0 b) Famine duration 1980 23 1980 None 0 1981 22 1981 1983 (age 2) P Jun−S ep19831( rainw,m,y−rainw,m sdrainw,m <−0.5)
1982 21 1982 1983 (age 1) and 1984 (age 2) PJun−S ep1984
Jun−S ep19831(
rainw,m,y−rainw,m
sdrainw,m <−0.5)
1983 20 1983 1983 (age 0 -in utero), 1984 (age 1) and 1985 (age 2) PMar−May1985
Jun−S ep1983 1(
rainw,m,y−rainw,m
sdrainw,m <−0.5)
1984 19 1984 1984 (age 0 -in utero) and 1985 (age 1) PMar−May1985
Jun−S ep1984 1(
rainw,m,y−rainw,m
sdrain <−0.5)
Because rdevis defined as a negative deviation, increase in its magnitude can readily be interpreted as worsening of the famine condition. This is essential to maintain c