Duquesne University
Duquesne Scholarship Collection
Electronic Theses and DissertationsSummer 1-1-2017
Examining the Relationship between Technology
& Engineering Instruction and Technology &
Engineering Literacy in K-8 Education
Tamarra L. Mitchell
Follow this and additional works at:https://dsc.duq.edu/etd
This Immediate Access is brought to you for free and open access by Duquesne Scholarship Collection. It has been accepted for inclusion in Electronic Theses and Dissertations by an authorized administrator of Duquesne Scholarship Collection. For more information, please contact
Recommended Citation
Mitchell, T. L. (2017). Examining the Relationship between Technology & Engineering Instruction and Technology & Engineering Literacy in K-8 Education (Doctoral dissertation, Duquesne University). Retrieved fromhttps://dsc.duq.edu/etd/179
EXAMINING THE RELATIONSHIP BETWEEN TECHNOLOGY & ENGINEERING INSTRUCTION AND TECHNOLOGY & ENGINEERING LITERACY IN K-8
EDUCATION
A Dissertation
Submitted to the School of Education
Duquesne University
In partial fulfillment of the requirements for the degree of Doctor of Education
By
Tamarra Mitchell
Copyright by Tamarra Mitchell
EXAMINING THE RELATIONSHIP BETWEEN TECHNOLOGY & ENGINEERING INSTRUCTION AND TECHNOLOGY & ENGINEERING LITERACY IN K-8
EDUCATION By Tamarra Mitchell Approved June 30, 2017 ________________________________ Misook Heo, Ph.D. Professor School of Education (Committee Chair) ________________________________ Gibbs Kanyongo, Ph.D. Associate Professor School of Education (Committee Member) ________________________________ Catherine Luke, Ed.D.
Adjunct Faculty School of Education (Committee Member)
ABSTRACT
EXAMINING THE RELATIONSHIP BETWEEN TECHNOLOGY & ENGINEERING INSTRUCTION AND TECHNOLOGY & ENGINEERING LITERACY IN K-8
EDUCATION
By
Tamarra Mitchell August 2017
Dissertation supervised by Misook Heo, Ph.D.
The purpose of this study was to examine the relationship between technology and engineering instruction and technology and engineering literacy in grades K-8. The factors identified and used for the purpose of this study were gender, socioeconomic status, race/ethnicity, and important modes of technology and engineering instruction. These factors were evaluated to determine their relationship to student achievement scores on the National Assessment of Educational Progress (NAEP) 2014 Technology and Engineering Literacy (TEL) assessment. Eight important modes of technology and engineering instruction were identified including: (1) choices people make that affect the environment, (2) inventions changing the way people live, (3) people working together to solve community/world problems, (4) figuring out why something is not working, (5) using different tools to see which is best, (6) building or testing models to check
solutions, (7) crediting others for their ideas, and (8) judging the reliability of sources. These eight modes were analyzed in terms of exposure frequency to determine which level of exposure related to the highest level of technology and engineering literacy achievement. Multiple linear regression analyses were conducted to examine the relationship between independent variables and achievement on the NAEP TEL assessment. The study findings provided evidence to suggest that demographic predictors such as gender, socioeconomic status, and race/ethnicity have a significant relationship on student achievement in technology and engineering literacy.
Additionally, evidence suggests that the more frequently students are exposed to technology and engineering modes of instruction, the higher their technology and engineering literacy achievement will be.
Limitations of the study exist due to the use of an NAEP assessment and data. US leaders, policy makers, and educators, however, can benefit from this research when determining how to best allocate funding and resources as well as developing and extending their STEM programs within schools. Additional research in this area is recommended to determine how factors can relate to technology and engineering literacy at various grade levels and across time.
DEDICATION
It is with genuine gratefulness and extreme excitement that I dedicate this work to my family. To my parents, George and Janet, without whom I would not have been able to thrive in my doctoral program or balance my studies and research along with
everything else, this is for you. From taking Kayla to her many activities and caring for her when I was in class, to providing countless meals when I was too busy or tired to cook and encouraging me when I struggled to continue, thank you for stepping in and supporting me through every step of this scholarly adventure. I could not have
accomplished this feat without you by my side. To my sister, Pamela, who brought me many meal deliveries when I wanted to stay focused on my work, and was often the person on the other end of the phone line when I needed a break, you provided me with many laughs and stress relief. Finally, to my daughter, Kayla, my inspiration and my motivation for starting and finishing this journey, I would not have achieved this goal without you. As my biggest fan and supporter, your patience and encouragement,
especially this last year, has been invaluable to me. I hope to be able to provide the same to you one day as you follow your dreams.
ACKNOWLEDGEMENT
I would like to acknowledge the overwhelming support and encouragement I received throughout my doctoral program and research. I am incredibly grateful for those who stood by me to support me along the way.
First, I would like to express my sincerest gratitude to my committee chair, Dr. Misook Heo. Her extreme patience and intellectual contribution to my development as a researcher have been unwavering. I would not have been able to achieve my goals without her guidance, support, and motivation over the years, especially this past year.
I would like to thank my committee members, Dr. Gibbs Kanyongo and Dr. Catherine Luke, for all of their wisdom and feedback. Their constant enthusiasm and encouragement as well as their balancing perspectives were invaluable.
I would especially like to thank my amazing family for the love, support, and constant encouragement I have gotten since day one. I undoubtedly could not have achieved my goals without them. They were my biggest supporters throughout this journey and I would not be where I am today without my mother, father, sister, and daughter.
I would like to thank my friends and “Mars family” for all of their encouragement and support over the years. They cheered for me, reassured me, and pushed me to stay motivated during the most challenging times.
Finally, I would like to thank my fellow cohort members. Relying on the support of one another, especially during all of the long hours we spent in classes on campus and online together, helped me achieve success and develop my knowledge base in even the
TABLE OF CONTENTS
Page
Abstract ... iv
Dedication ... vi
Acknowledgement ... vii
List of Tables ... xiii
List of Figures ... xiv
Chapter I Introduction ... 1
Importance of STEM in K-12 Education ... 4
Science & Mathematics Literacy, Standards, and Assessment ... 6
Technology and Engineering Literacy, Standards, and Assessment ... 8
Statement of the Problem ... 11
Significance of the Study ... 15
Limitations of the Study... 16
Definitions of Terms ... 16
Chapter II Literature Review ... 18
21st Century Workforce... 18
Preparing Students for the 21st Century STEM Workforce ... 20
STEM Education ... 22
STEM Literacy... 22
History... 24
STEM Learning Theories ... 28
Cognitivism ... 32
Constructivism ... 35
Inquiry Based Learning... 38
Project Based Learning ... 40
Problem Based Learning ... 41
Connectivism ... 43
Summary of Learning Theories ... 46
STEM in K-12 Schools ... 47
STEM in Elementary Education ... 48
STEM in Middle & High School Education ... 52
STEM Challenges & Areas in Need of Improvement ... 57
Obtaining & Retaining Qualified Educators ... 58
Targeting Diverse Populations ... 60
STEM Learning Standards and Assessments ... 65
Summary of STEM in K-12 Schools ... 67
National Assessment of Educational Progress (NAEP)... 68
Technology and Engineering Literacy (TEL) ... 72
Framework ... 72
Assessment Area 1: Technology & Society... 74
Assessment Area 2: Design & Systems ... 77
Assessment Area 3: Information & Communication Technology (ICT) ... 80
Assessment ... 84
Chapter Summary ... 85
Chapter III Methodology ... 89
Research Questions ... 90 Hypotheses ... 94 Expected Outcomes ... 94 Research Design... 96 Participants ... 96 Instrumentation ... 96 Variables ... 100 Independent Variables ... 100 Dependent Variable ... 101 Data Analysis ... 101 Chapter Summary ... 110 Chapter IV Results ... 111 Introduction ... 111 Descriptive Statistics ... 112 Inferential Statistics ... 113
First Research Question ... 113
Gender (IV1) ... 114
Socioeconomic Status (IV2) ... 114
Race/Ethnicity (IV3) ... 114
Choices people make that affect the environment (IV 4) ... 122
Inventions changing the way people live (IV 5) ... 122
People working together to solve community/world problems (IV 6) ... 123
Figured out why not working in order to fix it (IV 7) ... 123
Use different tools to see which are best (IV 8)... 123
Built/tested model to check solution (IV 9) ... 124
Learn to credit others for their ideas (IV 10) ... 124
Learn to judge reliability of sources (IV 11) ... 125
Chapter V Conclusions ... 127
Summary of Purpose ... 127
Summary of Procedures ... 127
Participant Demographics ... 128
Summary of the Findings and Response to Hypotheses ... 129
Findings Related to Literature and Implications ... 132
NAEP TEL Assessment and Demographics ... 133
NAEP TEL Assessment and Frequency of Exposure ... 138
Limitations of the Study... 142
Future Research ... 144
Application of Findings ... 145
References ... 148
Appendix A Research Question 1 Reports ... 185
Technology & Society ... 189 Design & Systems ... 193 Information & Communication Technology ... 197
LIST OF TABLES
Page Table 1 Technology & Society sub-areas, principles of understanding, and examples
(National Assessment Governing Board, 2013). ... 75
Table 2 Design & Systems sub-areas, principles of understanding, and examples (National Assessment Governing Board, 2013). ... 78
Table 3 Information and Communication Technology sub-areas, principles of understanding, and examples (National Assessment Governing Board, 2013). . 81
Table 4 Full Information from the Main NAEP Database for Independent Variables ... 92
Table 5 Race/Ethnicity demographics of sample... 113
Table 6 Gender, SES, and Race/ethnicity Comparison Statistics ... 116
Table 7 Gender, SES, and Race/ethnicity Regression Model Statistics ... 117
Table 8 Modes of Instruction Comparison Statistics ... 118
LIST OF FIGURES
Page Figure 1. Example of questions from Student Questionnaire of 2014 NAEP TEL
assessment. Adapted from “National Assessment of Educational Progress (NAEP), 2014 Technology and Engineering Literacy Assessment,” by U.S. Department of Education, Institute of Educational Sciences, National Center for Education Statistics. ... 98 Figure 2. Select Criteria. The criteria “Technology and Engineering Literacy” and “Grade
8” will be selected. Adapted from “National Assessment of Educational Progress (NAEP), 2014 Technology and Engineering Literacy Assessment,” by U.S. Department of Education, Institute of Educational Sciences, National Center for Education Statistics... 105 Figure 3. Select Criteria continued. The criteria “Jurisdiction” and “Measure” will be
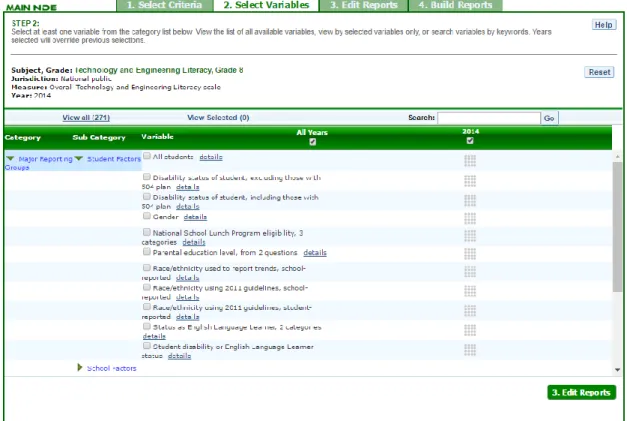
selected. Adapted from “National Assessment of Educational Progress (NAEP), 2014 Technology and Engineering Literacy Assessment,” by U.S. Department of Education, Institute of Educational Sciences, National Center for Education Statistics. ... 106 Figure 4. Select Variables. Independent and control variables will be selected. Adapted
from “National Assessment of Educational Progress (NAEP), 2014
Technology and Engineering Literacy Assessment,” by U.S. Department of Education, Institute of Educational Sciences, National Center for Education Statistics. ... 107
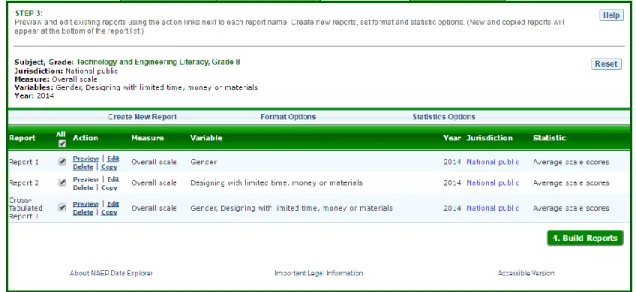
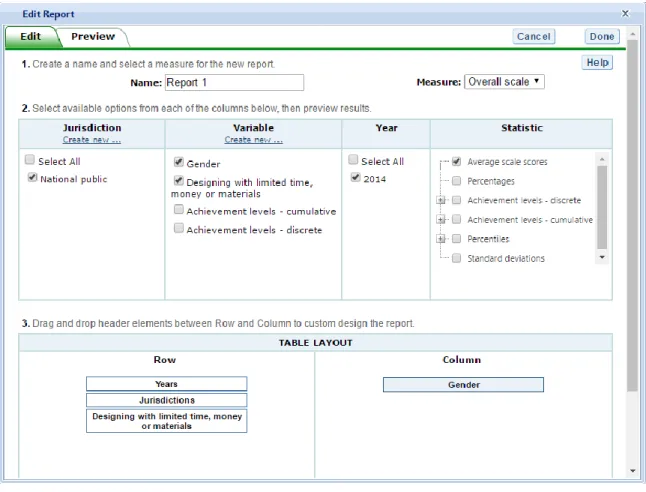
Figure 5. Edit Reports. The edit option will be used to set format and statistic options. Adapted from “National Assessment of Educational Progress (NAEP), 2014 Technology and Engineering Literacy Assessment,” by U.S. Department of Education, Institute of Educational Sciences, National Center for Education Statistics. ... 108 Figure 6. Edit Report Menu. Statistics options to be used include average scales. Adapted
from “National Assessment of Educational Progress (NAEP), 2014
Technology and Engineering Literacy Assessment,” by U.S. Department of Education, Institute of Educational Sciences, National Center for Education Statistics. ... 109 Figure 7. Average scale scores reported by gender (IV 1). Adapted from “National
Assessment of Educational Progress (NAEP), 2014 Technology and Engineering Literacy Assessment,” by U.S. Department of Education,
Institute of Educational Sciences, National Center for Education Statistics. 185 Figure 8. Average scale scores reported by eligibility for the National School Lunch
Program (SES) (IV 2). Adapted from “National Assessment of Educational Progress (NAEP), 2014 Technology and Engineering Literacy Assessment,” by U.S. Department of Education, Institute of Educational Sciences, National Center for Education Statistics... 186 Figure 9. Average scale scores reported by race/ethnicity (IV 3). Adapted from “National
Assessment of Educational Progress (NAEP), 2014 Technology and Engineering Literacy Assessment,” by U.S. Department of Education,
Figure 10. Multiple linear regression analysis for gender, National School Lunch
Program eligibility, and race/ethnicity (IV 1 – IV3). Adapted from “National Assessment of Educational Progress (NAEP), 2014 Technology and
Engineering Literacy Assessment,” by U.S. Department of Education,
Institute of Educational Sciences, National Center for Education Statistics. 188 Figure 11. Average scale scores for choices that people make that affect their
environment (IV 4). Adapted from “National Assessment of Educational Progress (NAEP), 2014 Technology and Engineering Literacy Assessment,” by U.S. Department of Education, Institute of Educational Sciences, National Center for Education Statistics... 189 Figure 12. Average scale scores for inventions changing the way people live (IV 5).
Adapted from “National Assessment of Educational Progress (NAEP), 2014 Technology and Engineering Literacy Assessment,” by U.S. Department of Education, Institute of Educational Sciences, National Center for Education Statistics. ... 190 Figure 13. Average scale scores for people working together to solve community or
world problems (IV 6). Adapted from “National Assessment of Educational Progress (NAEP), 2014 Technology and Engineering Literacy Assessment,” by U.S. Department of Education, Institute of Educational Sciences, National Center for Education Statistics... 191 Figure 14. Multiple linear regression analysis for Technology & Society modes of
instruction (IV 4 – IV6). Adapted from “National Assessment of Educational Progress (NAEP), 2014 Technology and Engineering Literacy Assessment,”
by U.S. Department of Education, Institute of Educational Sciences, National Center for Education Statistics... 192 Figure 15. Average scale scores for figuring out why something is not working in order to
fix it (IV 7). Adapted from “National Assessment of Educational Progress (NAEP), 2014 Technology and Engineering Literacy Assessment,” by U.S. Department of Education, Institute of Educational Sciences, National Center for Education Statistics. ... 193 Figure 16. Average scale scores for using different tools to see which are best (IV 8).
Adapted from “National Assessment of Educational Progress (NAEP), 2014 Technology and Engineering Literacy Assessment,” by U.S. Department of Education, Institute of Educational Sciences, National Center for Education Statistics. ... 194 Figure 17. Average scales scores for building/testing a model to check a solution (IV 9).
Adapted from “National Assessment of Educational Progress (NAEP), 2014 Technology and Engineering Literacy Assessment,” by U.S. Department of Education, Institute of Educational Sciences, National Center for Education Statistics. ... 195 Figure 18. Multiple linear regression analysis for Design & Systems modes of instruction
(IV 7 – IV 9). Adapted from “National Assessment of Educational Progress (NAEP), 2014 Technology and Engineering Literacy Assessment,” by U.S. Department of Education, Institute of Educational Sciences, National Center for Education Statistics. ... 196
Figure 19. Average scale scores for learning to credit others for their ideas (IV 10). Adapted from “National Assessment of Educational Progress (NAEP), 2014 Technology and Engineering Literacy Assessment,” by U.S. Department of Education, Institute of Educational Sciences, National Center for Education Statistics. ... 197 Figure 20. Average scale scores for learning to judge the reliability of sources (IV 11).
Adapted from “National Assessment of Educational Progress (NAEP), 2014 Technology and Engineering Literacy Assessment,” by U.S. Department of Education, Institute of Educational Sciences, National Center for Education Statistics. ... 198 Figure 21. Multiple linear regression analysis for Information & Communication
Technology modes of instruction (IV 10 – IV11). Adapted from “National Assessment of Educational Progress (NAEP), 2014 Technology and Engineering Literacy Assessment,” by U.S. Department of Education,
Chapter I Introduction
A national focus on preparing United States students for global competitiveness began decades ago. One of the main goals was for the US to be able to have a
competitive advantage in global markets and remain at the forefront of post-industrial trade (Barrow, 1996). Achieving that goal was predicted to be largely dependent on developing a more highly educated and diversified workforce (Thurow, 1991). The educational system in the US has changed and developed since then. Historically, in the
early 20th century Industrial Age, education was largely teacher-centered within the brick
and mortar walls of a school. Passive learning and memorization of three main literacies - reading, writing, and mathematics - were commonplace (Shaw et al., 2015). A pivotal
turning point in 20th century education came as a result of the 1957 launch of Sputnik by
the Soviet Union thus emphasizing the need for a greater focus on science and
mathematics preparation in US education (Armstrong, 2006). For this reason, the US passed the National Defense Education Act of 1958 allocating over eight hundred billion dollars to revising and improving science and mathematics standards (Armstrong, 2006). Decades later, the US still exhibited the need for improvement in science and
mathematics (Kimmelman, 2006). Markedly, in the 1980’s, A Nation at Risk report stated that US students were performing at a mediocre level and continued to be outperformed in mathematics and science by those in other countries thus further increasing the call for educational reform to help the US remain globally competitive (Kimmelman, 2006).
The paradigm shift to the 21st century Information Age, also known as the Knowledge or Digital Age, brought about rapid development and growth of new technologies. As such, a generation who needed a new matrix of skills and could put knowledge to work rather than machinery was sought after (Barrow, 1996). For this new
generation of 21st century learners, the matrix of new competencies included critical
thinking, problem solving, collaborating, and working with digital tools (US Department of Education, 2016). Furthermore, a shift to a student-centered learning environment that included project-based learning, global connections, and a focus on multiple literacies had occurred as a driving force toward achieving greater success working in a globalized millennium (McKelvey, 2001; Shaw et al., 2015).
Despite the educational reform efforts in place, an analysis and comparison of the US in relation to other countries at the beginning of the new millennium indicated that the US continued to lag behind in the areas of science and mathematics (Manzo, 2000). Consequently, the Bush administration pushed to make the US stronger in the core academic areas, including reading, science, mathematics, and writing, by developing the No Child Left Behind Act (NCLB) of 2001 placing an increased focus on student achievement (Armstrong, 2006). President Bush additionally proposed the American Competitiveness Initiative Act (ACI) in 2006 emphasizing the need for more rigorous science and mathematics courses to support national competition contributing almost six billion dollars to research, development, and strengthening of US education (Domestic Policy Council, 2006). Unfortunately, a 2012 report (Kelly et al., 2013) indicated that although US students were performing better on national assessments than they were decades ago, the US continued to fall short in comparison with other countries, ranking
35th in mathematics and 27th in science out of 64 countries. Mediocre performance in mathematics and science raised concerns about the ability of the US to be globally competitive and to properly respond to the rapidly growing Science, Technology, Engineering, & Mathematics (STEM) career demands (Thomasian, 2011).
By the year 2020, STEM jobs in the US are projected to increase by over one million, placing them among the top of the fastest-growing occupations (Lockard & Wolf, 2012). There is and will continue to be an eminent need for qualified workers; however, there are not enough students pursuing STEM degrees in preparation for such technical careers (Rockland et al., 2010; Thomasian, 2011). Academic skills as well as the ability to apply skills and knowledge are necessary to succeed in the 21st century workplace; unfortunately US K-12 schools have fallen short in ensuring high school graduates have attained adequate STEM skills, therefore contributing to lower enrollment and lower success rates in higher education STEM degree programs (Casner-Lotto & Barrington, 2006; Trends in International Mathematics and Science Study, 2011). As such, it is predicted that there will not be enough qualified workers in STEM fields to meet the demand of the increasing scientific and technical global economy (Thomasian, 2011).
Recognizing the importance of producing college and career ready students, President Barack Obama addressed the need to improve K-12 STEM education in his State of the Union Address (Obama, 2011). Additionally, the US Chamber of Commerce reached out to businesses requesting that they assist and collaborate with schools to help influence and increase STEM education (Hess, Kelly, & Meeks, 2011). With the push to improve STEM education starting with K-12 schools, the US hopes to increase the output
of STEM literate graduates ready to pursue STEM degrees and enter the workforce, thus aiding the US in remaining globally competitive (Hess, Kelly, & Meeks, 2011; Obama, 2011).
Importance of STEM in K-12 Education
To meet the demands of the 21st Century workforce and ensure a competitive position within the global economy, policy makers, leaders, and educators are pushing for STEM initiatives and integration within US K-12 education (Hess, Kelly, & Meeks, 2011; National Research Council, 2011; Obama, 2011). Since the term STEM was coined in 2001, it has taken on a broad meaning, thus yielding numerous definitions across literature (Brown, 2012). The United States Department of Education describes STEM as programs initiated primarily to strengthen science, technology, engineering, and mathematics education at all levels from elementary through adulthood (United States Department of Education, 2007). STEM has also been described as teaching and learning approaches integrating any of the individual STEM subject areas with any other subject area (Sanders, 2009). Another common description identifies STEM education as an interdisciplinary approach where students apply rigorous academic skills in real world situations (Tsupros, Kohler, & Hallinen, 2009). Despite the different definitions across research, the common goal of providing students with skills and competencies needed to
be successful contributors to the 21st century US economy seems to emerge (Lantz, 2009;
National Research Council, 2012). In order to achieve this goal, a closer look at how STEM is incorporated into K-12 US education is needed.
Recent research has supported the need to attract students to STEM disciplines during their elementary and adolescent years (Myers & Pavel, 2011; Rockland et al.,
2010). Elementary aged students, in general, acquire more positive perceptions and dispositions when they receive early exposure to STEM content (Bagiati, Yoon, Evangelou, & Ngambeki, 2010; Bybee & Fuchs, 2006). Likewise, by the time many students are 14 years old, their aspirations to pursue STEM disciplines are largely formed (Archer et al., 2012; Daugherty, Carter & Swagerty, 2014). It is therefore important that interests in STEM are encouraged and captured during the early elementary to middle school grades. As a result, students intrigued by STEM concepts in elementary and middle school may be more prepared to complete required courses throughout high school and more inclined to participate in elective courses in preparation to enter higher education STEM degree programs (Daugherty, Carter, & Swagerty, 2014).
Although evidence points to positive outcomes by starting STEM studies early in students’ school careers, formal steps toward this change have not been widespread or consistent among US schools. Consequently, elementary schools in the US are seeking assistance on how to best integrate STEM programs within their schools and initiatives to provide earlier exposure to STEM content are a growing priority (Center for Digital Education, 2010; Daugherty, Carter, & Swagerty, 2014). Options for studying STEM in high school, however, seem to be more prevalent including dual enrollment courses, early college entrance programs, residential STEM schools, online education opportunities, and specific STEM programs such as Project Lead the Way and Engineering by Design (DeJarnette, 2012). Although Merrill & Daugherty (2009) suggest STEM be taught as a fully integrated approach where the individual disciplines are not divided, but taught dynamically and fluidly, it is important to look closely at how each of the areas work in the US education system.
Science & Mathematics Literacy, Standards, and Assessment
While it is recommended that STEM areas not be taught independently, but rather integrated together to facilitate STEM literacy (Zollman, 2012), science and mathematics are typically taught as separate subjects in US K-12 public education beginning as early as Kindergarten and continuing through grade 12 (Thomasian, 2011). During middle and high school years, students are usually required to take a specific number and sequence of science and math courses in order to graduate from high school. Examples of such mathematics courses include algebra, geometry, calculus, trigonometry, and statistics. Science courses often include biology, chemistry, physics, human anatomy, and
environmental science. The goal of such courses is to facilitate science and mathematics literacy among all students by the time they graduate high school. Students who are literate in science have the ability to use scientific knowledge to process, understand, solve problems, and participate in decision making related to science in real life, whereas students who are mathematically literate identify, understand, and formulate
mathematical judgements to solve problems in real life contexts (National Council of Teachers of Mathematics, 2000; National Research Council, 1996; Organization for Economic Cooperation and Development, 2003; Organization for Economic Cooperation and Development, 2007).
In an effort to increase scientific and mathematical literacy, K-12 school districts in the US have adopted academic standards (Darling-Hammond et al., 2013). Teaching and learning standards have been created by experts in the field of education for the purpose of streamlining content all US students should know and skills they should be able to perform at each grade level (National Governors Association for Best Practices &
Council of Chief State School Officers, 2010). One of the primary standard sets currently used by districts to guide science and mathematics instruction is the Common Core State Standards (CCSS). The CCSS are aligned to the expectations of colleges, workforce training programs, and employers and were developed to ensure all students are equally prepared to collaborate and compete with their peers (National Governors Association for Best Practices & Council of Chief State School Officers, 2010). To assess whether US students have met the CCSS, standardized assessments in core subject areas are
administered. The US is thus able to analyze the results of the CCSS assessments from each state to help determine student achievement level and identify areas of weakness that may need a stronger focus. In addition to the CCSS used nationwide in the US, large scale standardized assessments such as the National Assessment of Educational Progress (NAEP), Trends in International Mathematics and Science Study (TIMMS), and Program for International Student Assessment (PISA) have been used to measure and compare performance nationally and internationally (Bybee & Fuchs, 2006).
Unfortunately, science and mathematics achievement of US students on such standardized assessments when compared to those in other countries has been a concern for decades (Manzo, 2000). Despite overall achievement in mathematics increasing modestly, science achievement has not changed much for about 15 years (Thomasian, 2011). In an effort to become more globally competitive, the US government has provided funding to schools based on their achievement and growth on the CCSS assessments. As a result of increased accountability and funding as a motivator, schools tend to place a strong focus on improving student performance in subject areas that are included in state standardized testing (National Council of Teachers of English, 2014).
Unfortunately, schools and teachers often feel the burden of state standardized testing because their students’ achievement on such tests largely determines the amount of funding districts receive; consequently, focus on tested subjects is often required and untested areas like technology and engineering become less of a priority (Bhattacharyya, Junto, & Clark, 2013).
Technology and Engineering Literacy, Standards, and Assessment
Unlike science and mathematics, which are typically core courses taught in K-12 public education, technology and engineering are often incorporated as special area classes in elementary schools and elective courses at the secondary level. Technology and engineering may be found in elementary settings in the form of a weekly special area class like physical education, art, or music, as after school clubs, or integrated into classroom activities by an elementary level teacher. At the high school level, examples of courses might include robotics, computer programming, computer science, or graphic design, and are often offered as elective courses. Although US schools are making a shift and incorporating technology and engineering, there is a lack of consistency (Computer Science Teachers Association Curriculum Improvement Task Force, 2005). With this in mind there is cause for concern as technology and engineering are major components in developing STEM literacy and helping to prepare K-12 students for higher education STEM programs and STEM careers.
Technology and Engineering Literacy (TEL) is defined as understanding,
evaluating, and using information and communication technologies as well as developing and achieving goals and solving problems within real-life contexts (National Assessment Governing Board, 2013). Being literate in technology and engineering allows for the
meaningful application of science and mathematics skills and prepares students for careers in all four of the STEM areas (Carr & Strobel, 2011; Sanders, 2009). In order to improve literacy in technology and engineering, US schools use standards of learning to guide their instructional goals. Although technology and engineering components can be found integrated into parts of the Common Core Standards for both Science and
Mathematics used by all US states, the focus within those standards is on science and mathematics content (National Governors Association for Best Practices & Council of Chief State School Officers, 2010). Separate technology standards were, however, created by the International Society of Technology in Education, but formal assessments to measure student proficiency were not widespread among states (International Society for Technology in Education, 2007; Metiri Group, 2009). In order to help fill the gap and strengthen the focus on technology and engineering integration, the Next Generation Science Standards (NGSS) were developed in 2013. Although the NGSS included a much greater focus on integrating science, technology, and engineering content, their use is not yet widespread with currently less than 40% of states adopting them (Metiri Group, 2009). In addition to the lack of depth, consistency, and adoption of standards, a way to formally assess what students know and can do in the areas of technology and
engineering has been lacking (National Assessment Governing Board, 2013). Since technology and engineering are essential parts of STEM education and in an effort to improve the college and career readiness of US students in the 21st century, a
standardized assessment was needed to measure US student performance to assess where improvements can be made and to compare technology and engineering literacy
To meet the need for a standardized performance measure, the National
Assessment Governing Board developed the 2014 NAEP Technology and Engineering Literacy (TEL) framework and assessment (2010). The NAEP is the largest nationally representative continuing assessment of what students in the US know and can do in various subject areas (National Center for Education Statistics, 2013). Accordingly, the TEL framework defined skills students should have, thus, building the foundation for the TEL assessment. The TEL assessment was developed to measure K-12 student
achievement in technology and engineering literacy in a similar way that student achievement had previously been assessed by the NAEP in areas such as science,
mathematics, reading, and other subjects (National Assessment Governing Board, 2013). The TEL framework identified three major areas, Technology and Society,
Design & Systems, and Information and Communication Technology, which students need to achieve proficiency in order to be considered literate in the areas of technology and engineering (National Assessment Governing Board, 2013). Additionally, the framework highlighted three overarching types of thinking and reasoning across each major assessment area including Understanding Technological Principles, Developing Solutions & Achieving Goals, and Communicating & Collaborating, of which students must demonstrate their ability to apply (National Assessment Governing Board, 2013). The TEL framework, accordingly, set the foundation for the development of the TEL assessment.
The NAEP TEL assessment is a standardized tool researchers, educators, and policymakers alike can use to analyze factors contributing to higher degrees of technology and engineering literacy so they can focus on implementing the best
approaches to increase student achievement and demonstrate growth in the future. More specifically, the TEL assessment measures students’ ability to apply technology and engineering skills in real-life computer-based scenarios (National Assessment Governing Board, 2010). The TEL reports on factors such as technology and engineering literacy achievement, instructional experiences, and a multitude of demographic characteristics of which researchers, policy makers, and educators can analyze to help identify contributors to greater achievement (National Assessment Governing Board, 2010). Accordingly, the use of such information may be able to lead to progressive changes in K-12 STEM education.
Statement of the Problem
K-12 students in the US are less adequately prepared for the influx of STEM careers that will be seen within the next decade (Gates & Mirkin, 2012; Kuenzi, 2008). Despite the overwhelming need for scientists, engineers, technologists, and technicians, low numbers of students are pursuing such degree programs (Daugherty, Carter, & Swagerty, 2014; Toulmin & Groome, 2007; National Science Board, 2010). For example, between the 2000-2001 and 2008-2009 academic years, the percentage of STEM field degrees awarded in the US dropped from 12.9 percent to 10.7 percent (Thomasian, 2011). When national comparisons were made, the results seemed even more bleak with regard to total US growth in STEM areas. Between 1998 and 2006, the US produced a growth of 23 percent for total number of STEM degrees compared to 144 percent in Poland, 178 percent in Taiwan, and over 200 percent in China (Thomasian, 2011). In order to develop and promote growth in the STEM field, analyzing factors contributing to subpar enrollment may help elucidate areas in need of improvement.
Considering the multitude of demographic characteristics that can have an effect on the substandard enrollment of STEM areas in the US, two of the more prominent dimensions that seem to emerge include gender and racial disparities (Beede, Julian, Langdon, McKittrick, & Kahn, 2011; Landivar, 2013). Notably, women currently hold nearly half of the jobs in the US; however, they hold less than 25 percent of the positions in STEM fields (Beede, Julian, Langdon, McKittrick, & Kahn, 2011). Over the last decade, more women are obtaining college degrees than men; however, women are pursing STEM degrees at much lower rates than their male counterparts contributing to negative implications for the 21st century workforce (Legewie & DiPrete, 2014). An underrepresentation of female scientists in the field further emphasizes the need to address the gender gap within education programs as a possible solution to increase the number of graduates prepared for the workforce (Fox, Sonnert, & Nikiforova, 2011). Similar to the gender disparity, an imbalance is also seen between some races. Historically, students of African American and Hispanic descent have been
underrepresented in STEM fields (Landivar, 2013). In 2011, for example, African Americans comprised only six percent of the STEM workforce and only seven percent were Hispanic workers (Landivar, 2013). In order to remain globally competitive, it is recommended to begin emphasizing STEM and motivating students in grades K-12 including a focus on targeting underrepresented populations including females, African Americans, and Hispanics, otherwise it may be too late to prepare and attract 21st century STEM workers (Archer et al., 2012; Bottoms & Uhn, 2007; Fox, Sonnert, & Nikiforova, 2011; Freeman, 2005; Gates & Mirkin, 2012; Jeffers, Safferman, & Safferman, 2004; Landivar, 2013; Myers & Pavel, 2011).
Taking a closer look at STEM education in current K-12 US schools, additional factors such as a disconnect between STEM subjects, a lack of consistency in technology and engineering standards, and lack of an evaluation method prior to 2014 seemingly contribute to the current STEM literacy deficiencies (National Assessment Governing Board, 2013; National Governors Association for Best Practices & Council of Chief State School Officers, 2010; Zollman, 2012). Exemplifying a disconnect between STEM subjects, separate Common Core State Standards for Science and Mathematics exist; however, the engineering and technology components incorporated are not
comprehensive (Metiri Group, 2009; National Governors Association Center for Best Practices & Council of Chief State School Officers, 2010). To aid in increasing technology and engineering integration in standards, the Next Generation Science
Standards (NGSS) were created including science, engineering, and technology domains; however, less than 40% of US states have adopted them as of today additionally
signifying inconsistency (Metiri Group, 2009). Likewise, until 2014, the US lacked a consistent and widespread way to formally assess what students knew and could do in the areas of technology and engineering (National Assessment Governing Board, 2013). As of today, all 50 states are required to report on technology literacy based on the
information and communication technology (ICT) standards from National Education Technology Standards (NETS) for Students (International Society for Technology in Education, 2007; Metiri Group, 2009); however, until the NAEP TEL assessment was administered, the variation in assessments used across states made it difficult to know whether students were proficient (Becker, Hodge, & Sepelyak, 2010). Consequently, very little empirical evidence exists to help guide researchers, policymakers, and school
districts in their effort to make comprehensive improvements to their STEM programs (National Research Council, 2011).
Purpose of the Study
The overall goal of this study was to examine how technology and engineering instruction relates to students’ technology and engineering literacy in grades K-8 by using high quality data. The first goal of this study was to identify the relationship between gender, socioeconomic status (SES), and race/ethnicity, on students’ Technology and Engineering Literacy (TEL) achievement. The next goal of the study was to determine how frequency of exposure to technology and engineering instruction in school related to students’ TEL achievement.
Research Questions
To achieve the aforementioned research goals, the two main research questions sought included:
RQ1. What is the relationship between gender, socioeconomic status, and race/ethnicity and student achievement on the NAEP TEL assessment? RQ2. What is the relationship between student-perceived frequency of exposure
to technology and engineering instruction and student achievement on the NAEP TEL assessment?
Through examination of the data provided by the NAEP TEL assessment, conclusions to the research questions above were drawn to contribute to the empirical evidence in order to help guide educators and policy makers toward making progressive decisions around STEM programs in K-12 education.
Significance of the Study
The rationale for this study was to contribute to the overall research on factors related to higher technology and engineering literacy achievement of US K-8 students as identified by student scores on the NAEP TEL assessment. Much research exists on student achievement in the science and mathematics areas of STEM; however, school districts, students, and researchers could benefit from further research in the areas of technology and engineering.
It is recommended that upon high school graduation students be equipped with foundational knowledge in science, technology, engineering, and mathematics at a level
needed to participate in a 21st century digital global economy (International Society for
Technology in Education, 2016; National Research Council, 2012). Much research already exists reporting on science and mathematics achievement; however, little is known about factors contributing to positive student achievement in the areas of
technology and engineering. This study provides information that could serve to inform school districts when working to make improvements in their STEM instruction to benefit students. For example, school districts may identify where to best allocate
funding, which course requirements may need to be added, or whether curricular changes or enhancements are needed. Likewise, this study may lead to positive implications for students because as school districts identify better ways of implementing progressive STEM integration, students will have a greater opportunity to learn skills needed to be successful in college STEM programs and/or the workforce. This study can additionally benefit future researchers by contributing to the limited body of research that currently
exists in the area of technology and engineering literacy achievement among US K-8 students, thus helping to guide them to other areas in need of study.
Limitations of the Study
This study was designed to address research questions using high-quality data from the NAEP. The goal of the NAEP is to ensure their assessments are developed to meet the highest standards of reliability and validity through a complex process of collaboration between experts within the National Assessment Governing Board and the National Center for Educational Statistics (National Assessment Governing Board, 2013). Limitations that were outside the control of the researcher that may have affected the study did, however, exist. First, the 2014 Technology and Engineering Literacy
Assessment was the only assessment given by the NAEP, at the time of this research, to assess what students know and are able to do in the areas of technology and engineering. For this reason, the option of analyzing performance based on multiple testing dates did not exist. Likewise, the assessment had only been administered to students in grade 8. As such, it was not possible to make comparisons of student achievement to identify whether differences existed between elementary, middle, and high school students. Additionally, because the NAEP TEL assessment was so current, at the time of the study, the data was not available for export into statistical software programs. Thus, the
researcher was limited to the use of the NAEP Data Explorer tool to conduct analyses. Definitions of Terms
Engineering: an approach taken to design, build, and use systems that meet human needs and solve problems (National Assessment Governing Board, 2013; National Research Council, 2012).
Information Age (Digital Era): a period in history also known as the Digital Age characterized as the shift from the Industrial Age to a global economy focused, technological society
Technology: a modification to natural or designed objects or application of scientific knowledge for practical purposes (National Assessment Governing Board, 2013) Technology and Engineering Literacy: understanding, evaluating, and using information and communication technologies in addition to developing and achieving goals and solving problems within real-life contexts (National Assessment Governing Board, 2013).
Twenty-first century skills: a set of competencies taught through student centered methods including problem-based and project-based learning that include collaboration, solving authentic problems, critical thinking, effective
communication of ideas, and working with digital tools to produce products (Rotherham & Willingham, 2009; United States Department of Education, 2016).
Chapter II Literature Review 21st Century Workforce
Global competition in the 21st century has initiated a trend of economic,
technological, and educational growth which has established the need for highly skilled and knowledgeable college graduates possessing job related skills, leadership qualities, and characteristics of life-long learners (Association of American Colleges, Universities, & National Leadership Council, 2007). Although basic skills are a necessity when entering the work force, thinking skills and personal skills are the primary essential
qualities employers look for in perspective 21st century employees (Casner-Lotto, &
Barrington, 2006). Work places today desire employees who can be flexible and adapt to the demands of multitasking, working collaboratively with colleagues, identifying
possible problems, and having rapid problem solving skills (The US Department of Education, 2016). In contrast to the 20th century workforce where it was not unusual for workers to occupy a permanent career, 21st century workers tend to have more transient employment patterns. For example, recently, one in four workers in the US has been with their current employer for less than a year (Bureau of Labor and Statistics, 2004). Likewise, it is not uncommon for individuals to work 10 or more jobs in the course of their lifetime before retirement (Saratoga Institute, 2000). For this reason, 21st century workers must be confident, adaptable, life-long learners in order to be employable (Savickas, 2012). To facilitate the growth of a larger population prepared to enter the workforce, educators and business leaders should work together to ensure students are
leaving high school and college prepared with the skills and mindset to succeed in the modern workforce.
Although the United States has experienced growth in the quantity of students attending college in preparation to enter the workforce, college students’ intellectual skills are seemingly underdeveloped upon graduation (Bok, 2007). In fact, employers felt that less than 10% are prepared for work in our current global society (United States Department of Labor, 2007). In order to learn more about what employers are looking
for in 21st century workers and identify their perceptions about the competency of newly
hired employees, an in depth study was conducted with over 400 corporations in fields including manufacturing, businesses/professional services, financial/insurance services, entertainment, and trade (Casner-Lotto & Barrington, 2006). Desired skills that were rated the highest among employers included professionalism, work ethic, oral and written communication, teamwork and collaboration, critical thinking, and problem solving ability (Casner-Lotto & Barrington, 2006). In fact, applied skills including
professional/work ethic, teamwork/collaboration, and oral communications were
emphasized as three of the most important skills needed over basic skills such as reading comprehension and mathematics in the current workforce (Casner-Lotto & Barrington, 2006). Unfortunately, it was concluded that less than 25% of the professionals believed that recent college graduates were well prepared in those areas (Casner-Lotto &
Barrington, 2006). It is important to consider changes and improvements that can be made starting as early as kindergarten so that schools can begin to better prepare
higher education programs and the workforce to ensure that the United States remains globally competitive.
Preparing Students for the 21st Century STEM Workforce
To progress toward the goal of helping students strengthen 21st century skills by becoming critical thinkers, persistent problem solvers, and effective collaborators, it is recommended that schools in the US start educating children in grades K-12 helping them reach their full potential and become successful contributors in our rapidly evolving technical global society (Bell, 2010; Pearlman, 2010). Looking at the performance of US students in comparison to those in other countries upon the turn of the century, the US appeared to be lagging behind in the areas of mathematics and science (Manzo, 2000). With mediocre performance in mathematics and science and minimal progress evident throughout the decade, leaders and policy makers have become increasingly concerned about the US's ability to remain globally competitive (Thomasian, 2011). Consequently, recent educational reforms such as implementing the Common Core State Standards were put into place responding to the call from leaders to help strengthen US students' overall core content knowledge, 21st century skills, and STEM skills (Hess, Kelly, & Meeks, 2011; Manzo, 2000; Obama, 2011). A workforce comprised of inventors, critical
thinkers, and problem solvers is necessary in driving and supporting our global economy (Casner-Lotto & Barrington, 2006). As such, building STEM competencies which
encompass the needed 21st century skills in K-12 students is paramount in helping to
develop such innovators and encourage their entrance into higher education STEM programs in preparation for future STEM careers.
An analysis of future job growth identified STEM jobs as being among one of the fastest growing occupations projecting an increase of over one million jobs by the year 2020 (Lockard & Wolf, 2012). Additionally, STEM careers are among the highest paid, falling above the national average (Casner-Lotto & Barrington, 2006). Having a strong background in STEM education has also been found to contribute to obtaining a higher salary and a higher level of job security, even outside of STEM fields (Thomasian, 2011). It is, however, predicted that due to the low number of graduates entering higher
education STEM programs, there will not be enough qualified STEM workers to meet the demands of the increasingly scientific and technical economy (Thomasian, 2011). One of the main contributing factors in the decline of graduates interested in and prepared to enter STEM fields is a breakdown of effective STEM integration and instruction within the US K-12 school system which is failing to prepare students for future careers
(Rockland et al., 2010). As a result, there is a growing concern that the US may lose its competitive edge in the global economy.
The concept of STEM integration is not new; however, as recent reports of the low numbers of students pursuing STEM disciplines past high school have come to light, the need to develop and strengthen STEM skills starting in K-12 schools has gained the attention of policy makers and educational leaders (Daugherty, Carter, & Swagerty, 2014; Toulmin & Groome, 2007; National Science Board, 2010). It has thus been concluded that by working to instill an interest and build the STEM competencies starting with K-12 students, the US will have a greater chance of increasing the output of graduates prepared for higher education STEM programs to become qualified to enter the workforce.
STEM Education STEM Literacy
To ensure the US remains competitive in the 21st century global economy,
leaders, policy makers, and educators have begun integrating STEM initiatives in K-12 schools to build STEM literacy among students (Hess, Kelly, & Meeks, 2011; Obama, 2011). STEM, a term coined in 2001 by Judith Ramaley, assistant director of the Education and Human Resources Division at the National Science Foundation, refers to Science, Technology, Engineering, and Mathematics (Zollman, 2012). Numerous definitions of STEM exist across literature to attempt to describe the interrelation of the four content areas (Brown, 2012). The United States Department of Education, for example, refers to STEM with a focus on programs initiated for the purpose of strengthening science, technology, engineering, and mathematics knowledge at all educational levels (United States Department of Education, 2007). STEM has
additionally been described by placing an emphasis on teaching and learning approaches through which any of the individual STEM subject areas are integrated with any one or more subject areas (Sanders, 2009). STEM is further identified as an interdisciplinary approach where students apply rigorous academic skills in real world situations (Tsupros, Kohler, & Hallinen, 2009). Regardless of the various definitions, the common goal of building STEM literacy among US K-12 students is important so that they may possess
the competencies necessary to effectively contribute to the 21st century global economy
(Lantz, 2009; National Research Center, 2012).
In order to build STEM literacy, it is helpful to have an understanding of what STEM literacy looks like and what skills students should have. While it is important that
the STEM areas be integrated to facilitate STEM literacy (Zollman, 2012), the individual subject areas are sometimes described independently before being analyzed as a whole. Scientific literacy, for example, often looked at within core science subjects such as physics, biology, chemistry, and earth sciences, refers to a student’s capacity to apply scientific principles and processes to build an understanding of the world around them thus being able to make contributions to the field (Thomasian, 2011). Technological literacy centers around a student’s ability to identify a modification to a natural or designed object, apply their skills and knowledge in using new technology, and demonstrate an understanding of how technology can affect humans and the world around us (National Assessment Governing Board, 2013; Thomasian, 2011).
Engineering literacy is described as having the ability to utilize a systematic approach to design, build, and use systems to meet needs or solve problems (National Assessment Governing Board, 2013; National Research Council, 2012). Mathematical literacy refers to a student’s ability to analyze, reason, and communicate for the purpose of solving mathematical problems (Thomasian, 2011). STEM literacy is thus described as a student’s ability to apply knowledge across the four interrelated subject area domains to solve problems and make sense of the world around them (Thomasian, 2011). It is further explained as having the ability to develop creative solutions to unknown future problems and being able to work flexibly and collaboratively with other individuals as well as new technologies (United States Department of Education, Office of Innovation & Improvement, 2016).
Unfortunately, many, including professionals in STEM fields, university faculty, school teachers, and school administrators lack understanding of STEM (Chiu, Price, &
Ovrahim, 2015; Sanders, 2009). Professionals in STEM related professions often linked STEM with stem cell research or plants (Bybee, 2010). Additionally, a faculty survey at a large university showed that only 25 percent had an accurate understanding of STEM (Breiner, Harkness, Johnson, & Koehler, 2010). Similarly, a study of teachers and administrators across the state of Illinois found that less than half understood or could accurately describe what STEM embodies (Brown, Brown, Reardon, & Merrill, 2011). There is a need for educators at all levels to acquire a greater awareness and
understanding of STEM education in order to successfully prepare students to become more STEM literate (Tsupros, Kohler, & Hallined, 2009).
History
STEM skills and knowledge have been used throughout US history with scientists and inventors exemplifying implementation during the Industrial Revolution through the invention of technologies such as the light bulb, automobiles, and machinery (White, 2014). The skills and knowledge being utilized by inventors such as Thomas Edison or Henry Ford, however, were not traditionally taught and practiced within traditional schools (Butz et al., 2004). Technologies developed during World War II, such as weapons and military transportation additionally demonstrated that scientists,
mathematician, and engineers worked alongside the military to use their STEM skills to help the US remain strong (Judy, 2011). Shortly after the end of World War II, the National Science Foundation was developed to promote scientific advancements, national health, and security helping the US to remain globally competitive (Mervis, 2010). A pivotal turning point in US history and STEM education came in 1957 when the Soviet Union launched Sputnik, the first man-made object successfully sent into orbit
(Armstrong, 2006; Kelly, 2012). This event propelled the US to initiate a greater focus on science and mathematics preparation in US education (Armstrong, 2006; White, 2014). In response, the Space Act was passed by congress and the National Aeronautics and Space Administration (NASA) was formed to expand science, engineering, and technology to increase the space presence of the US (Dick, 2008). In addition to helping the US gain success in triumphs such as sending humans to the moon, NASA has
contributed to STEM initiatives in US K-12 schools and colleges (NASA, 2012; White, 2014). The US also passed the National Defense Act of 1958 which funded the
improvement of science and mathematics academic standards (Armstrong, 2006). Despite these efforts to increase rigorous science and mathematics programs in schools, the US exhibited a need for further advancements (Kimmelman, 2006).
While the areas of science, mathematics, technology, and engineering had been
the focus of US education improvement throughout most of the 20th century, one
significant point in history where US officials realized the continued need to increase STEM literacy of K-12 students was after the 1983 report of President Ronald Regan’s National Commission on Excellence in Education, A Nation at Risk (Gardner, 1983). The publication indicated that the US was performing at a mediocre level and continued to be outperformed by other countries in the areas of mathematics and science (Gardner, Larsen, Baker, Campbell, & Crosby, 1983). Alarming facts presented in the report indicated that on 19 academic tests comparing the US to other countries, American students never achieved first or second place and actually placed last seven times
(Gardner, Larsen, Baker, Campbell, & Crosby , 1983). Additionally, it was reported that about 23 million adults were functionally illiterate, only one fifth of 17 year olds could
write a persuasive essay, and only one third could solve a multi-step mathematics
problem (Gardner, Larsen, Baker, Campbell, & Crosby, 1983). Average achievement of high school students was reported as being lower than it was two decades prior and there had been a decline in SAT scores (Gardner, Larsen, Baker, Campbell, & Crosby, 1983). This report prompted a movement to better prepare students for a growing number of STEM related careers.
Throughout the end of the 20th century and beginning of the Digital Era, the rapid
growth of new technologies contributed to the exponential growth of STEM related
fields, and the need for graduates to possess 21st century skills enticed the government to
provide federal grants and initiatives to promote the expansion of STEM in schools (Lockard & Wolf, 2012; Richardson, Berns, & Marco, 2010). During the late 1980s and through the 1990s, the US implemented what became known as the standards-based education movement where schools were expected to teach students to reach academic standards at certain grade levels and increased the administration of standardize measures to evaluate performance (Kuenzi, 2008). Despite changes made through the standards-based education movement, a comparison of the US and other countries upon the start of the new millennium indicated that the US continued to lag behind other countries in science and mathematics (Manzo, 2000).
The Bush Administration took several steps to facilitate increasing the strength of US students in reading, writing, science, and mathematics beginning around 2001. The No Child Left Behind Act (NCLB) was created and placed an increased focus on student achievement holding every school accountable to ensure proficiency of every child by tying standardized test results to government funding (Armstrong, 2006). Additionally,
the American Competitiveness Initiative Act (AIC) was developed in 2006 which contributed billions of dollars to initiating more rigorous science and mathematics courses to strengthen US education (Domestic Policy Council, 2006). President Obama also recognized the importance of increasing STEM literacy to prepare students to become more college and career ready thus calling for an increase in STEM education K-12 (Obama, 2011). He had an additional focus on improving teacher preparation programs and passed the American Recovery & Reinvestment Act in 2009 allocating over 77 billion dollars to improve K-12 education (Whitecomb, Borko, & Liston, 2009). Despite their efforts, reports continued to indicate that the US was failing to show
competitive performance with other countries in the areas of science and mathematics and the numbers of K-12 students prepared to enter STEM related fields was not sufficient (Kelley et al., 2013; Lockard & Wolf, 2012; National Science Board, 2008).
For example, in 2012, the US ranked 35th in mathematics and 27th in science out of 64
countries (Kelley et al., 2013). It was also found that the US did not have enough students upon graduation who were prepared to pursue STEM related careers although the research indicated that by the year 2020, STEM related careers will grow by over one million becoming one of the fastest growing fields (Lockard & Wolf, 2012; National Science Board, 2008). Additionally, in 2015, only 16 percent of scientists and 29 percent of the general public felt that US STEM education was average or above average and 75 percent of the American Association for the Advancement of Science members felt that a major factor contributing to the lack of scientific knowledge in the US can be attributed to a lack of STEM education in K-12 schools (PEW, 2015).
Although the US government has made multiple and major efforts to increase the performance of students in the area of STEM, it is evident that there continues to be a need to make improvements in K-12 education in order to increase the output of STEM literate students upon high school graduation (Lockard & Wolf, 2012). In order to understand the challenges to STEM integration and steps that may contribute to improving the number of STEM literate graduates in the US, it may first be helpful to
understand the theory behind 21st century learning and what a 21st century learning
environment consists of. STEM Learning Theories
An instructional learning environment is designed and delivered according to the way individuals learn and is often based on learning theories. Learning is complex and can be influenced by a number of factors (Schunk, 2012). With advanced understanding of how individuals learn and better understanding of human cognition, learning theories have been constantly evolving (Ertmer & Newby, 1993; Schunk, 2012). Consequently, the focus of instructional design should not be to determine which learning theory is the best, but rather which will be most effective considering both the learner and the task (Ertmer & Newby, 1993; Shuell, 1986). Depending on factors such as the knowledge development of the learner as well as the level of the cognitive processing needed for learning, strategies and practices from different, and often multiple, theoretical perspectives may be effective (Ertmer & Newby, 1993). As such, it is important for STEM instructors to be knowledgeable of the main learning theories so they may design
Throughout the 20th century, three broad learning theories used most often included behaviorism, cognitivism, and constructivism (Ertmer & Newby, 1993; Siemens, 2005). These traditional theories were developed prior to the expansion of technology in the Digital Era and although elements of each of these theories are
currently used in the instructional design process, they do not always exclusively support
the evolving learning needs of the 21st century society brought on by the rapid
advancements in technology (Mechlova & Malcik, 2012). In addition to the three traditional theories, connectivism, a newer proposed theory of learning, has been seen to
play an important role in the digital shift that has occurred in the 21st century (Mechlova
& Malcik, 2012, Siemens, 2005). Understanding basic assumptions and principles of each learning theory can yield positive implications on instructional design, best practice,
and strategy selection appropriate for 21st century STEM learners (Ertmer & Newby,
1993; Mechlova & Malcik, 2012, Siemens, 2005). Behaviorism
Behaviorism, one of the earliest known theories of learning, suggests that learning occurs through the arrangement of stimuli and consequences within the environment and can be measured through observable actions. The behaviorist learning theory dates back to the late 1800’s, when Russian physiologist, Ivan Pavlov developed a classical
conditioning experiment using a stimulus-response method to train a dog (Mergel, 1998). In Pavlov’s classical conditioning experiment, a dog was trained to salivate (the
response) upon the ringing of a bell (a stimulus substitution) which was associated with food (the stimulus). Because of the stimulus-response method, the dog would salivate