ESCUELA INTERNACIONAL DE DOCTORADO
Programa de Doctorado en Ciencias Sociales
Value Based Performance Measures: Theoretical
Evaluation and Empirical Analysis of their
Application and Value Relevance on a European
Level
Autor:
Nils Eikelmann M.A.
Directores:
Prof. Dr. Roland Wolf
Prof. Dr. Ángel Meseguer Martínez
AUTHORIZATION OF THE DIRECTORS OF THE THESIS FOR SUBMISSION
Prof. Dr. Roland Wolf and Prof. Dr. Ángel Meseguer Martínez as Directors of the Doctoral Thesis “Value Based Performance Measures: Theoretical Evaluation and Empirical Analysis of their Application and Value Relevance on a European Level” by Mr. Nils Eikelmann in the Programa de Doctorado en Ciencias Sociales, authorises for submission since it has the conditions necessary for his defense.
Sign to comply with the Royal Decrees 99/2011, 1393/2007, 56/2005 and 778/98, in Murcia, September 2018.
I write this dissertation after my admission to the doctoral program of the FOM Hochschule für Oekonomie & Management and Universidad Católica San Antonio de Murcia while simultaneously being employed at innogy SE in Essen. This dissertation has been handed in at the university in Murcia in the middle of 2018.
Many people contributed to make this doctoral thesis a valuable and successful experience.
First of all, I would like to thank and I am full in debt to my two advising professors. Prof. Dr. Roland Wolf inspired me to write this dissertation, supported me throughout the whole time and successfully retained my motivation at a high level during the whole participation in the doctoral program. Prof. Dr. Ángel Mesegeuer Martínez continually improved this dissertation substantially with his insightful feedback.
I want to show my gratitude to the FOM Hochschule für Oekonomie & Management and the Universidad Católica San Antonio de Murcia which enabled me to write this dissertation. In particular, I would like to thank Dr. Alexander Zureck, Professor Mercedes Carmona Martínez and Professor Gonzalo Wandosell Fernández de Bobadilla.
For the valuable support of my employer, innogy SE, by flexible working hours and the possibility to give me a time off, I would like to thank Christian Fenger and Wolfgang Miserre representatively.
Furthermore, many thanks to my colleagues of the doctoral program who have always been available for discussions, in particular Sebastian Kuhlmann and Julia Winteroth.
In addition to the already named persons I would like to thank my friends, particularly Carlo, Jan, Julia, Nora, Patrizia, Sebastian and Viktoria for their patience and understanding during the time of dissertation as well as their insightful feedback.
Last but not least, I would like to thank my girlfriend Pia, the love of my life, for her support. Especially I would like to thank my parents, Claudia and
Rolf Eikelmann, for their valuable and great support during my whole education. Without them this work would not have been possible.
Success is no accident. It is hard work, perseverance, learning, studying, sacrifice and most of all, love of what you are doing or learning to do.
LIST OF ABBREVIATIONS ... 19 LIST OF ILLUSTRATIONS ... 21 LIST OF TABLES ... 23 LIST OF FORMULAS ... 27 LIST OF SYMBOLS ... 31 1 INTRODUCTION ... 35 1.1 Problem description ... 35 1.2 Objectives ... 41 1.3 Structure of work ... 43
2 FRAMEWORK CONDITIONS FOR THE APPLICATION OF VALUE BASED PERFORMANCE MEASURES ... 47
2.1 Maximisation of Shareholder Value as primary goal of companies ... 47
2.1.1 Necessity of Value Based Management for companies in today’s business environment ... 47
2.1.1.1 Development of Value Based Management ... 47
2.1.1.2 Elements and objectives of Value Based Management ... 49
2.1.2 Shareholder Value approach as one characteristic form of Value Based Management ... 54
2.1.2.1 Shareholder Value Network... 54
2.1.2.2 Critical discussion of Shareholder Value approach ... 57
2.1.3 Calculation of cost of capital as a crucial part of Value Based Management and Shareholder Value approach... 60
2.1.3.1 Calculation of cost of equity capital with the CAPM and
calculation of cost of debt capital ... 60
2.1.3.2 Critique of CAPM ... 67
2.2 Conflicts of interest between investors and managers ... 69
2.2.1 Classification of Principal Agent Theory and justification of its application ... 69
2.2.2 Structure of principal-agent relationships ... 71
2.2.3 Kinds of information asymmetries and resulting information problems ... 73
2.2.3.1 Hidden Characteristics and Adverse Selection ... 73
2.2.3.2 Hidden Action and Hidden Information ... 75
2.2.4 Relationship between investors and managers on the basis of the Principal Agent Theory ... 76
2.2.4.1 The model of Jensen and Meckling ... 76
2.2.4.2 Accounting and reporting of key figures as important tools for reducing information asymmetries ... 83
2.2.5 Effects of information asymmetries on cost of capital ... 92
2.2.6 Critiques of Principal Agent Theory ... 96
2.3 Relevance of information on capital markets and for its actors ... 98
2.3.1 Price formation on capital markets depending on the level of information ... 98
2.3.1.1 Efficient market model and levels of market efficiency ... 98
2.3.1.2 Critique of efficient market model ... 104
2.3.1.3 Empirical insights on the information efficiency of capital markets ... 107
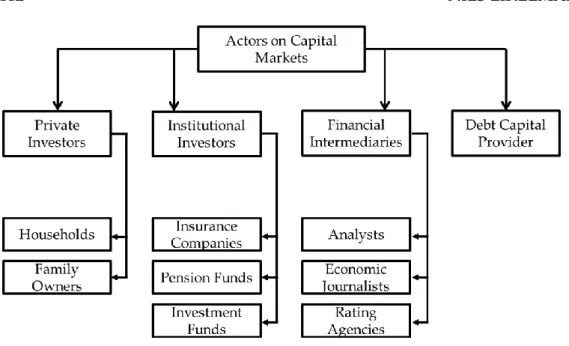
2.3.2 Crucial actors on capital markets and their information needs ... 111
2.3.2.1 Classification of actors on capital markets ... 111
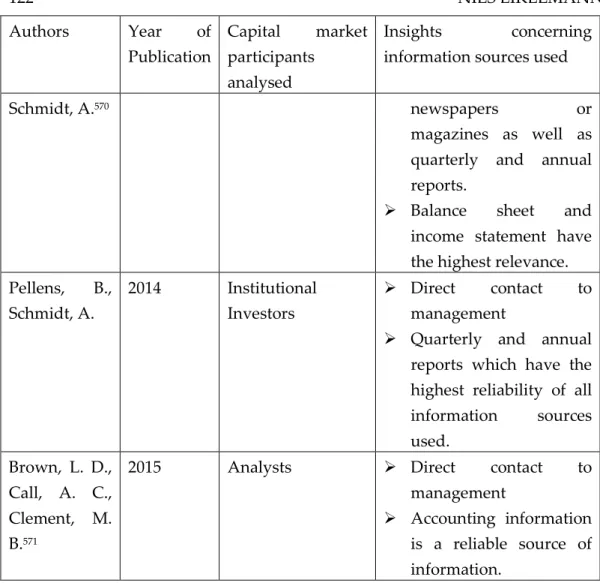
2.3.2.2 Information needs of actors ... 118
research of investors ... 124
2.4 Information delivery of companies on the basis of IFRS annual accounts and Value Reporting... 126
2.4.1 Role of accounting in the context of Principal Agent Theory, theory of efficient capital markets and information needs of investors ... 126
2.4.2 IFRS as rules for disclosing financal statements ... 128
2.4.3 Evaluation of IFRS from an investor’s point of view ... 134
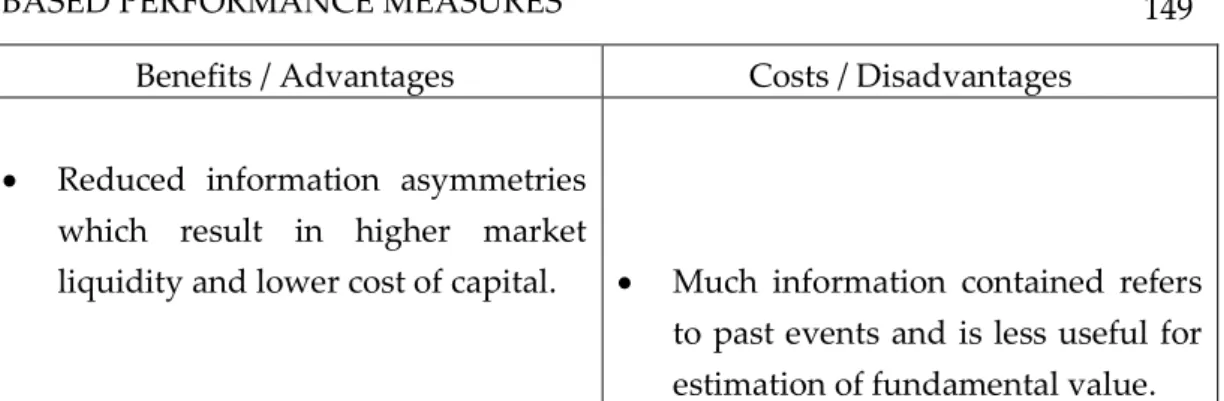
2.4.3.1 Benefits and advantages of IFRS ... 134
2.4.3.2 Costs and flaws of IFRS reporting ... 140
2.4.4 Value Reporting as a supplement of IFRS reporting ... 149
2.4.4.1 Definition and objectives of Value Reporting ... 149
2.4.4.2 Reduction of communication gaps by Value Reporting ... 154
2.4.4.3 Principles of Value Reporting and appropriate communication channels ... 156
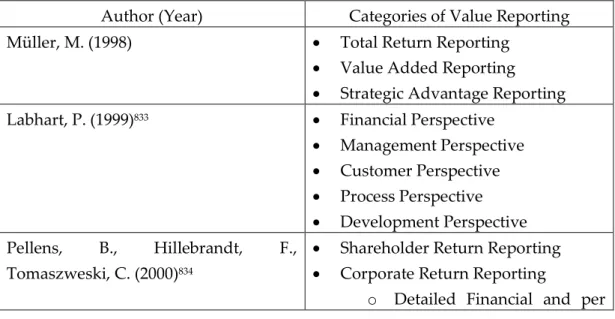
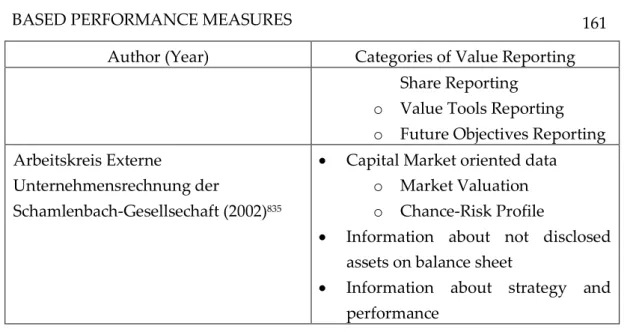
2.4.4.4 Elements of Value Reporting ... 160
2.4.4.5 Integrated Report as latest development of Value Reporting ... 167
3 CRITICAL EVALUATION OF SELECTED VALUE CONCEPTS ... 171
3.1 Traditional key figures used commonly by investors ... 171
3.1.1 Systematisation of traditional key figures ... 171
3.1.2 Price Earnings Ratio and Earnings per Share ... 174
3.1.3 Return on Equity and Return on Sales ... 178
3.1.4 Return on Investment ... 180
3.2 Concept of value based key figures ... 182
3.2.2 Advantages of value based key figures and flaws of traditional
key figures ... 186
3.2.3 Evaluation criteria for value based performance measures ... 189
3.3 Value based performance measures focussing on a single period ... 196
3.3.1 Concept of Residual income (Preinreich-Lücke Theorem) ... 196
3.3.2 Result-based key figures ... 201
3.3.2.1 ROCE Spread and Value Added ... 201
3.3.2.1.1 Calculation ... 201
3.3.2.1.2 Evaluation... 207
3.3.2.2 Economic Value Added ... 212
3.3.2.2.1 Calculation ... 212
3.3.2.2.2 Conversions ... 216
3.3.2.2.3 Evaluation... 220
3.3.3 Cash Flow based key figures ... 225
3.3.3.1 Cash Flow Return on Investment ... 225
3.3.3.1.1 Calculation of dynamic Cash Flow Return on Investment ... 225
3.3.3.1.2 Calculation of static Cash Flow Return on Investment ... 231
3.3.3.2 Cash Value Added ... 232
3.3.3.3 Evaluation of Cash Flow Return on Investment and Cash Value Added... 234
3.4 Value based performance Measures focussing on the total period ... 239
3.4.1 Discounted Cash Flow ... 239
3.4.1.1 Calculation ... 239
3.4.1.2 Evaluation ... 247
3.4.2 Market Value Added ... 250
3.4.2.1 Calculation ... 250
3.5.1 Application of value based performance measures in Europe ... 255 3.5.2 Classification of studies analysing value relevance of key figures . 268 3.5.2.1 Objectives and assumptions of capital market research ... 268 3.5.2.2 Capital market research approaches ... 272 3.5.2.3 Types of statistical tests for determining value relevance .. 275 3.5.3 Value relevance of traditional and value based performance
measures ... 276
4 APPLICATION AND VALUE RELEVANCE OF VALUE BASED
PERFORMANCE MEASURES IN EUROPE ... 289 4.1 Development of the empirical study ... 289
4.1.1 Research questions, research hypotheses and objectives of
empirical study ... 289 4.1.1.1 Analysis of application of value based performance
measures in Europe ... 289 4.1.1.2 Standardised calculation of a value based performance
measure ... 293 4.1.1.3 Value relevance of value based performance measures
and traditional key figures ... 294 4.1.2 Methodology of the study ... 298 4.1.2.1 Analysis of annual reports ... 298 4.1.2.2 Standardised calculation of ROCE, ROE Spread and
Value Added ... 304 4.1.2.3 Association study in the form of a price level model ... 310
4.1.2.3.1 Price level and return models as possible design forms for association studies ... 310 4.1.2.3.2 Ohlson model as theoretical basis for the
regression equation ... 315 4.1.2.3.3 Feltham Ohlson model as extension of the
Ohlson model ... 319 4.1.2.3.4 Derivation of the equation for panel regression . 323
4.1.2.3.5 Definition of endogenous variable... 324
4.1.2.3.6 Definition of explanatory variables ... 327
4.1.2.3.7 Definition of control variables ... 329
4.1.2.3.8 Panel regression as the applied statistical method ... 340
4.1.3 Description of data base ... 346
4.1.3.1 Analysis of annual reports... 346
4.1.3.2 Standardised calculation of ROCE, ROE spread and Value Added... 349
4.1.3.3 Value relevance analysis ... 351
4.2 Results of the empirical study ... 352
4.2.1 Analysis of annual reports ... 352
4.2.2 Standardised calculation of ROCE Spread and Value Added ... 361
4.2.3 Value relevance of Value Added in comparison to selected traditional key figures ... 365
4.2.3.1 Descriptive statistics ... 365
4.2.3.1.1 Descriptive statistics of dependent variable and analysed key figures ... 365
4.2.3.1.2 Descriptive statistics of independent variables ... 372
4.2.3.2 Selection of panel model ... 381
4.2.3.3 Analysis of regression requirements ... 384
4.2.3.4 Value relevance analysis ... 395
4.3 Interpretation of results ... 407
4.3.1 Analysis of annual reports ... 407
4.3.2 Standardised calculation of ROCE Spread and Value Added ... 412
4.3.3 Value relevance analysis ... 413
4.4 Limitations ... 420
4.4.3 Value relevance analysis ... 422
5 CONCLUSION ... 429
5.1 Summary ... 429
5.2 Outlook ... 438
APPENDIX 1 - COMPOSITION OF STOXX EUROPE 600 ON 31ST JULY 2015 ... 443
APPENDIX 2 – ASSIGNMENT OF SUPERSECTOR ... 461
APPENDIX 3 – COMMENTS ON DATA BASE FOR ANALYSING ANNUAL REPORTS ... 479
APPENDIX 4 – BLOOMBERG MNEMONICS FOR ROCE SPREAD, ROE SPREAD AND VALUE ADDED ... 481
APPENDIX 5 – BLOOMBERG MNEMONICS FOR PANEL REGRESSION ANALYSIS ... 483
APPENDIX 6 – COMPANIES WITH LOWEST AND HIGHEST ROCE SPREAD PER PERIOD ... 485
APPENDIX 7 – COMPANIES WITH LOWEST AND HIGHEST CUMULATIVE ROCE SPREAD ... 495
APV Adjusted Present Value
CAPM Capital Asset Pricing Model
CDS Credit Default Swap
CFROI Cash Flow Return on Investment
DAX German Stock Index
EBIT Earnings before interest and taxes
EBITDA Earnings before interest, taxes,
depreciation and amortisation
EPS Earnings per Share
EVA Economic Value Added
EU European Union
FCF Free Cash Flow
FIFO First in first out
FTE Flow to Equity
GCF Gross Cash Flow
GIB Gross Investment Base
HDAX Stock index consisting of DAX, MDAX
and SDAX companies
IASB International Accounting Standards
Board
IFRS International Financial Reporting
Standards
IIRC International Integrated Reporting
Council
LIFO Last in first out
MDAX Mid Cap DAX
MSCI Morgan Stanley Capital International
MVA Market Value Added
NOA Net Operating Assets
NOPAT Net Operating Profit after taxes
NOPLAT Net Operating Profit less adjusted
PAAinE Pro-Active Accounting Activities in Europe
PER Price Earnings Ratio
REVA Refined Economic Value Added
ROCE Return on Capital Employed
ROI Return on Investment
ROIC Return on Invested Capital
RONA Return on Net Assets
SDAX Small cap DAX
S&P Standard & Poor’s
SVA Shareholder Value Added
TCF Total Cash Flow
TecDAX Technology DAX
VBM Value Based Management
VIF Variance Influence Factor
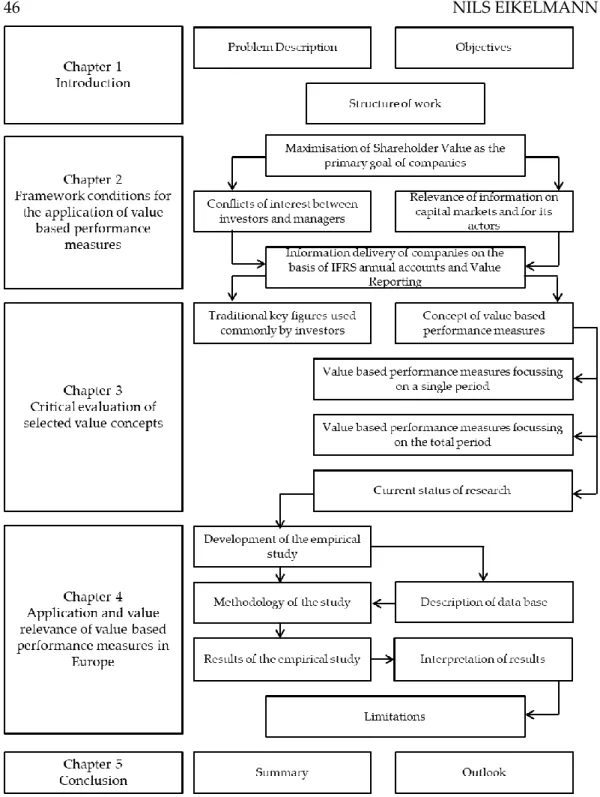
Illustration 1: Structure of work ... 46
Illustration 2: Comparison of hurdle rates from a balance sheet perspective and VBM perspective ... 51
Illustration 3: Shareholder Value Network ... 55
Illustration 4: Capital Market Line and Market Risk Premium ... 64
Illustration 5: Development of market value of company and manager’s expenditures for private consumption ... 79
Illustration 6: Actors on Capital Markets ... 112
Illustration 7: Systematisation of companys‘ publication ... 129
Illustration 8: Accounting Principles of IFRS ... 132
Illustration 9: Communication gaps in the context of Value Reporting ... 155
Illustration 10: Elements of Value Reporting... 162
Illustration 11: Systematisation of value based performance measures ... 185
Illustration 12: Calculation of Capital Employed ... 204
Illustration 13: Calculation of dynamic CFROI ... 230
Illustration 14: Overview of DCF approaches ... 240
Illustration 15: Ex ante and ex post calculation of MVA ... 252
Illustration 16: Links between earning numbers and stock prices ... 271
Illustration 17: Overview of capital market research approaches ... 272
Illustration 18: Differentiation between relative and incremental information content ... 276
Illustration 19: Overview of hypotheses and methodology of empirical study . 297 Illustration 20: Scoring model for analysis of annual reports ... 303
Illustration 21: Calculation of ROCE Spread and Value Added for industry companies ... 308
Illustration 22: Calculation of ROE Spread and Value Added for financial
services companies ... 309 Illustration 23: Decision model for selecting the appropriate panel model ... 343 Illustration 24: Supersectors of Stoxx Europe 600 and allocation to category
Industry or Finance ... 348 Illustration 25: Number of companies with value based performance
measures in their annual business reports ... 353 Illustration 26: Assessment of companies‘ annual business reports ... 359 Illustration 27: Ranking of companies on the basis of the ROCE Spread ... 362 Illustration 28: Ten companies with the lowest cumulative ROCE Spread ... 364 Illustration 29: Ten companies with the highest cumulative ROCE Spread ... 364 Illustration 30: Correlation matrix ... 388 Illustration 31: Comparison of R² of panel regression ... 414 Illustration 32: Framework conditions for the application of value based
performance measures ... 432 Illustration 33: Overview of results of first part of empirical study ... 435 Illustration 34: Overview of results of second part of empirical study ... 436 Illustration 35: Overview of results of third part of empirical study ... 437
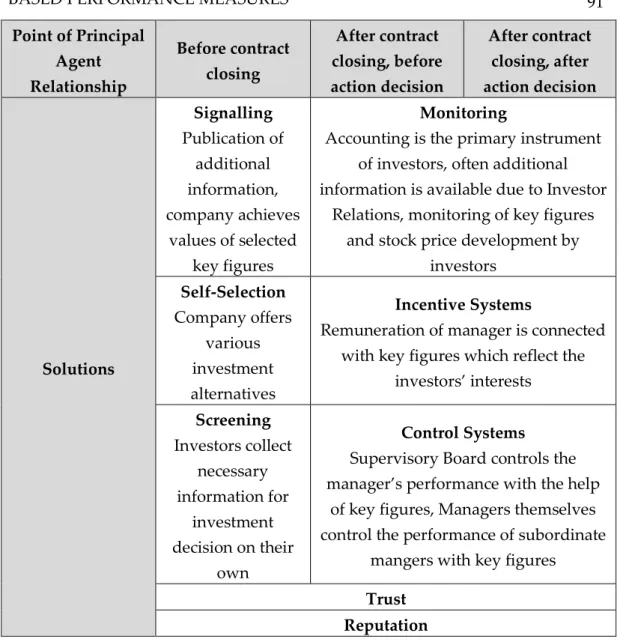
Table 1: Kind of information asymmetries between investors and
managers, resulting agency problems and possible solutions ... 91 Table 2: Overview of empirical studies analysing the information
sources of different investor groups ... 122 Table 3: Benefits / Advantages and costs / disadvantages of IFRS ... 149 Table 4: Possible classifications of Value Reporting elements ... 161 Table 5: Evaluation of ROCE and ROCE Spread ... 211 Table 6: Calculation of NOA and NOPAT ... 215 Table 7: Evaluation of EVA ... 225 Table 8: Calculation of Gross Investment Base and Gross Cash Flow ... 229 Table 9: Evaluation of CFROI and CVA ... 238 Table 10: Calculation and coherence between different kinds of Cash
Flows ... 245 Table 11: Evaluation of Discounted Cash Flow approaches ... 250 Table 12: Evaluation of MVA ... 255 Table 13: Overview of empirical studies dealing with the application of
value based performance measures ... 267 Table 14: Results of analysis of value relevance studies ... 286 Table 15: Defined sections and search terms for analysis of annual
reports ... 299 Table 16: Summary of evaluation of value based performance measures 305 Table 17: Chosen performance measures for panel regression as
explanatory variables ... 328 Table 18: Calculation of net operating assets ... 331 Table 19: Overview of variables of panel regression ... 339
Table 20: Composition of data base for analysing annual reports... 349 Table 21: Composition of data base for standardised key figure
calculation ... 351 Table 22: Composition of data base for panel regression analysis ... 352 Table 23: Number of companies which mentioned a value based
performance measure sorted by their countries of origin ... 354 Table 24: Number of companies which mentioned a value based
performance measure sorted by their Supersector ... 356 Table 25: Applied value based performance measure by companies of
Stoxx Europe 600 ... 358 Table 26: Relative change of companies applying value based
performance measures ... 360 Table 27: Descriptive statistics of the dependent variable Stock price ... 366 Table 28: Descriptive statistics of the variable Value Added ... 367 Table 29: Descriptive statistics of the variable EPS ... 368 Table 30: Descriptive statistics of the variable PER ... 369 Table 31: Descriptive statistics of the variable ROI ... 370 Table 32: Descriptive statistics of the variable ROE ... 371 Table 33: Descriptive statistics of the variable ROS ... 372 Table 34: Descriptive statistics of the variable Book Value of Equity
Capital... 373 Table 35: Descriptive statistics of the variable Net Operating Assets ... 374 Table 36: Descriptive statistics of the variable Dividend ... 375 Table 37: Descriptive statistics of the variable Sales ... 376 Table 38: Descriptive statistics of the variable Leverage Ratio ... 377 Table 39: Descriptive statistics of the variable Total Assets ... 378 Table 40: Descriptive statistics of the variable Risk ... 379
Table 42: Descriptive statistics of the variable Country ... 381 Table 43: Results of the F test for individual effects ... 382 Table 44: Results of the Lagrange-Multiplier-test (Breusch Pagan) for
panel regression scenarios ... 383 Table 45: Results of the Hausman test for panel regression scenarios ... 383 Table 46: Results of the Breusch-Pagan test for heteroscedasticity for
panel regression ... 386 Table 47: Results of the Breusch-Godfrey test for autocorrelation for
panel regression ... 387 Table 48: Results of VIF calculation for panel regression with key figure
Value Added ... 389 Table 49: Results of VIF calculation for panel regression with key figure
EPS ... 390 Table 50: Results of VIF calculation for panel regression with key figure
PER ... 391 Table 51: Results of VIF calculation for panel regression with key figure
ROI ... 391 Table 52: Results of VIF calculation for panel regression with key figure
ROE ... 391 Table 53: Results of VIF calculation for panel regression with key figure
ROS ... 392 Table 54: Analysis of regression requirements for annual regression
analysis ... 395 Table 55: Results of panel regression with VA_rel as independent
variable ... 396 Table 56: Results of panel regression with EPS as independent variable .. 397 Table 57: Results of panel regression with PER as independent variable . 398
Table 58: Results of panel regression with ROI as independent variable . 399 Table 59: Results of panel regression with ROE as independent variable 400 Table 60: Results of panel regression with ROS as independent variable . 401 Table 61: Results of annual regression analysis ... 407
Formula 1: Calculation of WACC including tax shield ... 61 Formula 2: Formula of Capital Asset Pricing Model ... 65 Formula 3: Composition of manager’s wealth ... 80 Formula 4: Comparison of company value and purchasing price for equity
capital under the condition of lower non-pecuniary
consumption ... 81 Formula 5: Comparison of company value and purchasing price for equity
capital under the condition of higher non-pecuniary
consumption ... 82 Formula 6: Manager’s wealth after sale of equity capital ... 82 Formula 7: Dividend Discount Model ... 99 Formula 8: Price formation on capital markets ... 101 Formula 9: Excess return ... 102 Formula 10: Excess return in completely efficient markets ... 102 Formula 11: Calculation of PER ... 174 Formula 12: Calculation of EPS ... 177 Formula 13: Calculation of ROE ... 178 Formula 14: Calculation of ROS ... 179 Formula 15: Calculation of ROI ... 180 Formula 16: Dividend Discount Model with Terminal Value ... 197 Formula 17: Definition of residual income ... 198 Formula 18: Explanation of Dividends through accounting figures I ... 199 Formula 19: Explanation of Dividends through accounting figures II ... 199 Formula 20: Converted residual income formula ... 199 Formula 21: Converted dividend formula ... 200
Formula 22: Combination of residual income and Dividend Discount
Model ... 200 Formula 23: Calculation of limit for combined formula of Dividend
Discount Model and residual income ... 200 Formula 24: Residual income valuation formula ... 201 Formula 25: Calculation of ROCE... 202 Formula 26: Calculation of ROCE Spread ... 206 Formula 27: Calculation of Value Added ... 207 Formula 28: Calculation of EVA (Capital Charge formula) ... 215 Formula 29: Calculation of EVA (Value Spread formula) ... 216 Formula 30: Calculation of dynamic CFROI ... 226 Formula 31: Calculation of useful life ... 229 Formula 32: Calculation of static CFROI ... 231 Formula 33: Calculation of CVA with Value Spread formula ... 233 Formula 34: Calculation of CVA with Capital Charge formula ... 233 Formula 35: Calculation of Shareholder Value with the WACC approach .... 242 Formula 36: Calculation of Shareholder Value with TCF approach ... 243 Formula 37: Calculation of Shareholder Value with APV approach ... 243 Formula 38: Calculation of Shareholder Value with the Equity approach ... 244 Formula 39: Ex ante calculation of MVA ... 251 Formula 40: Ex post calculation of MVA ... 252 Formula 41: Preinreich-Lücke theorem in the context of Ohlson’s model ... 316 Formula 42: Stochastic process of linear information dynamics ... 317 Formula 43: Equation of the Ohlson model ... 319 Formula 44: Equation of the Feltham Ohlson model ... 321 Formula 45: Empirical formulation of the Feltham Ohlson model ... 323
measure Value Added ... 336 Formula 47: Determination of relative information content for performance
measure Price Earnings Ratio ... 337 Formula 48: Determination of relative information content for performance
measure Earnings per Share ... 337 Formula 49: Determination of relative information content for performance
measure Return on Investment ... 337 Formula 50: Determination of relative information content for performance
measure Return on Equity ... 337 Formula 51: Determination of relative information content for performance
measure Return on Sales ... 337 Formula 52: Adapted determination of relative information content for
𝛼 Manager’s share in company’s equity capital
𝐴𝑆𝑆𝑖,𝑡 Total assets of company i at the end of
period t
𝑏𝑣𝑡 Book value of equity capital in period t
𝐵𝑉𝐸𝑖,𝑡 Book value of equity capital of
company i at the end of period t
𝐶𝐹𝑅𝑂𝐼 Cash Flow Return on Investment
𝐶𝑂𝑈𝑁𝑇𝑅𝑌𝑖,𝑡 Country in which company i is located in period t
𝐶𝑉𝐴 Cash Value Added
𝐷𝑡 Transfer payments from company to
shareholders (including dividends)
DC Market value of debt capital
𝐷𝐼𝑉𝑖,𝑡 Dividend payment of company i in the
period t
𝜀̃ Standard normal distributed
disturbance term
𝑒𝑗𝑡 Random disturbance term
𝐸𝑡 (𝐷𝑡+𝑖) Expected future dividends
𝐸𝐵𝐼𝑇 Earnings before interest and taxes
𝐸𝐵𝑇 Earnigns before taxes
EC Market value of equity capital
𝐸𝑃𝑆𝑖,𝑡 Earnings per Share of company i at the
end of period t
𝐸𝑉𝐴 Economic Value Added
F Market Value of manager’s
expenditures on private consumption
𝐹𝐶𝐹 Free Cash Flow
𝐹𝑇𝐸 Flow to Equity
𝐺𝐶𝐹 Gross Cash Flow
𝑖 Risk adjusted interest rate
𝑖𝐷𝐶 Interests paid for debt capital
𝐼𝑛𝑑𝑢𝑠𝑡𝑟𝑦𝑖,𝑡 Industry of company i in period t
𝐿𝐸𝑉𝑖,𝑡 Leverage ratio of company i at the end
of period t
𝑀𝑉𝐷𝐶 Market value of debt capital
𝑀𝑉𝐴 Market Value Added
𝑁𝐷𝐴 Non depreciable assets
𝑁𝑂𝐴𝑖,𝑡 Net operating assets of company t at
the end of period t
𝑁𝑂𝑃𝐴𝑇 Net Operating Profit After Taxes
𝑜𝑎𝑡 Operating assets at date t
𝑜𝑥𝑡𝑎 Operating earnings for period t
𝑃𝑖,𝑡 Market value of company I at the end
of period t
𝑃𝑡 Present value of expected future
dividends / Value of equity capital respectively of a share at time t
𝑝𝑡+𝑇 Present Value of a payment in period t
+ T
𝑃𝐸𝑅𝑖,𝑡 Price-Earnings-Ratio of company i at
the end of period t
𝑟 Risk-adjusted discount rate / Stewart’s
r
𝑟𝑗,𝑡+1 Expected return of security j at the end
of period t
𝑟𝐷𝐶 Cost of debt capital
𝑟𝐸𝐶 Cost of equity capital
𝑟𝑓 Risk free interest rate
𝑅𝑓−𝜏 Risk free interest rate increased by
factor one
𝑟𝑚 Return of market portfolio
𝑅𝑛 Terminal Value
end of period t
𝑅𝑂𝐼𝑖,𝑡 Return on Investment of company i at
the end of period t
𝑅𝑂𝑆𝑖,𝑡 Return on Sales of company i at the
end of period t
s Tax rate of company
𝑆0 Purchase price of sold equity capital
𝑆𝑖 Market value of manager’s remaining
equity capital
∆𝑆𝐴𝐿𝐸𝑆𝑖,𝑡 Change in sales of company i in period t
ß Beta factor
TC Market value of total capital
𝑇𝐶𝐹 Total Cash Flow
𝑇𝑉 Terminal Value
V Market Value of Company
𝑉𝑡 Book value of equity capital at time t
𝑣𝑡 Information variable / other
information than abnormal earnings
𝑉𝐴𝑖,𝑡 Value added of company i at the end
of period t
W Manager’s wealth
𝑊𝐴𝐶𝐶 Weighted average cost of capital
𝑥𝑡𝑎 Residual income of period t
𝑥𝑡 Profit
𝑥𝑗,𝑡+1 Excess return
𝑥𝑡𝑎 Residual earnings in period t
𝑥̃𝑎 Estimated residual earnings in future
periods
𝑦𝑡 Book value of equity capital in period t
𝛷𝑡 Set of available information at the end
1.1 PROBLEM DESCRIPTION
Today, the majority of managers lead companies on the basis of the Shareholder Value approach and pursues Value Based Management.1 Also annual business reports of large European companies contain commitments to the Shareholder Value approach. For example, Anheuser-Busch InBev describes its strategic goals as follows: “A long-term strategic mind set motivates us to continually seek – and seize upon – opportunities for future growth and shareholder value creation.”2 Telefónica outlines its focus on Shareholder Value creation in the following way: “This intensification of investment is consistent with our commitment to continuous improvement of financial flexibility as well as an attractive payment to our shareholders.”3 By pursuing the Shareholder Value approach, companies have to generate an adequate rate of return for their shareholders.4 Otherwise investors will withdraw their capital.5
Challenging framework conditions exacerbate this goal attainment. A crucial factor is capital procurement. Due to globalisation and the continuing expansion of activities in several countries, worldwide capital demand is rising.6 Domestic capital markets are no longer sufficient to satisfy the capital demand of companies. As a consequence, they have to acquire capital on foreign markets.7
1 Cf. Bezemer, P.-J., Zajac, E. J., Naumovska, I., et al. (2014), pp. 1-2; Firk, S., Wolff, M. (2018), p. 52; Loderer, C., Roth, L., Waelchli, U., et al. (2010), p. 5; Lopatta, K., Kaspereit, T. (2014), p. 475; Rieg, R. (2015), p. 193.
2 Quotation taken from: Anheuser-Busch InBev (2013), p. 3. 3 Quotation taken from: Telefonica (2013), p. 42.
4 Cf. Losbichler, H. (2012), pp. 266-267; Rappaport, A. (1986), pp. 55-56. 5 Cf. Moir, L., Kennerley, M., Ferguson, D. (2007), p. 388.
6 Cf. Didier, T., Schmukler, S. L. (2013), p. 112; Dillerup, R., Stoi, R. (2016), p. 193; Lattwein, J. (2002), p. 113; Reichmann, T. (2011), p. 636; Riedl, J. B. (2000), p. 107; cf. contradictory Bris, A., Koskinen, Y., Nilsson, M. (2014) outlines that cost of capital decreases in the timespan after the introduction of the Euro (investigation period 1991-2006) for companies in the euro zone, pp. 554-556.
7 Cf. Bris, A., Koskinen, Y., Nilsson, M. (2014), p. 554-555; the authors explain that due to the introduction of the currency Euro companies have easier access to
Beside globalisation of capital markets, the importance and influence of institutional and foreign investors rose in the last decade.8 For example, in Germany 62 % of shareholders in the DAX are institutional investors.9 These increased investor activities lead to higher expectations concerning the performance of companies.10
The financial crisis between 2007 and 2009 also has effects on capital procurement.11 Gearing is more difficult for two reasons. Firstly, banks do not deal in credit in the same way as they did before the crisis.12 Secondly, as a reaction to turbulence within several banks and state interventions during the financial crisis the Basel Committee on Banking Supervision adapted the set of regulations, now called Basel III.13 In comparison to Basel II, banks have to meet higher requirements concerning the common equity capital ratio, implement a capital conservation buffer and reach liquidity key figures like the liquidity coverage ratio and the net stable funding ratio.14 The more restrictive loan origination15 fosters the importance of capital markets.16
foreign capital markets in the euro zone; Hanauer, M., Kaserer, C., Rapp, M. S. (2013), p. 469; Meyer, M. (2005), p. 1; Weber, J., Schäffer, U. (1999), p. 226.
8 Cf. Horváth, P., Gleich, R., Voggenreiter, D. (2012), p. 279; Mallin, C. (2012), pp. 179-181; Schmolke, K. U. (2007), p. 702; Yeh, T.-m. (2014) p. 312.
9 Cf. Schneider, U. (2012), p. 519-520. 10 Cf. Athanassakos, G. (2007), p. 1397.
11 Cf. Elyasiani, E., Mester, L. J., Pagano, M. S. (2014), p. 62; Kahle, K. M., Stulz, R. M. (2013), pp. 282-283; the authors review different theories which deal with the shortage of capital supply during the financial crisis; the first year of crisis is 2007 (p. 281); the last year of the crisis is 2009 (p. 282).
12 Cf. Garcia-Appendini, E., Montoriol-Garriga, J. (2013), p. 273; Hristov, N., Hülsewig, O., Wollmershäuser, T. (2012), pp. 569-570; Krol, F. (2009), pp. 94-95.
13 Cf. King, M. R. (2013); pp. 4144-4145; Rossignolo, A. F., Fethi, M. D., Shaban, M. (2013), p. 1323.
14 Cf. Cabral, R. (2013), p. 110-112.
15 Cf. Allen, B., Chan, K. K., Milne, A., et al. (2012), pp. 163-166; Hofmann, J., Schmolz, S. (2014), p. 35; contradictory Dietrich, Hess and Wanzenried do not see a negative influence on bank performance due to the new net stable funding ratio, cf. Dietrich, A., Hess, K., Wanzenried, G. (2014), p. 14.
16 Cf. Coenenberg, A. G., Salfeld, R. (2007), p. 37; Spremann, K., Gantenbein, P. (2005), p. 23.
the European sovereign debt crisis. Whole states like Greece, Portugal, Spain or Ireland have heavy financial problems.17 Banks and capital markets in these countries are very vulnerable. This leads to a shortage in liquidity which in turn exacerbates the challenge of capital procurement for companies.18 The European Central Bank reacts to both crises among other things with a period of low interest rates in order to reduce the effects of the crisis on European economies and to foster bank lending to companies.19 On the basis of low interest rates, the asset class of shares is again a focus of investor’s interests. The alternatives to shares are rare.20 Nonetheless, the current period of low interest rates does not ease the situation concerning the capital procurement as companies compete globally for capital.21
Against the backdrop of increasing competition for capital and a more restrictive debt capital allocation, the challenge for companies is to ensure a constant supply of capital at appropriate prices.22
Beside the trend on the capital markets, managers have to be aware of the development in financial reporting. Between investors and management principal agent relationships exist which are caused by the separation of ownership and control.23 Financial Reporting has the objective to reduce these information asymmetries.24
17 Cf. Eichler, S., Hielscher, K. (2012), pp. 552-553; Moro, B. (2014), pp. S9-S10; the development of the CDS spread of Greek bonds clarifies the extent of the financial problems, cf. Grammatikos, T., Vermeulen, R. (2012), pp. 521-522.
18 Cf. Kousenidis, D. V., Ladas, A. C., Negakis, C. I. (2013), pp. 351-352.
19 Cf. Cour-Thimann, P., Winkler, B. (2012), p. 772; Eichler, S., Hielscher, K. (2012), pp. 554-555, 564; Fiordelisi, F., Galloppo, G., Ricci, O. (2014), pp. 49-50.
20 Cf. Schier, S. (03.12.2014), p. 26; Sommer, U. (15.12.2014), p 1.
21 Cf. Krol, F. (2009), p. 94; Weber, J., Bramsemann, U., Heineke, C., et al. (2017); Zwirner describes that the total capital costs of companies do not change despite the low interest rates as the cost for equity capital have risen, cf. for details Zwirner, C. (2014), pp. 381-386.
22 Cf. Baetge, J., Kümmel, J. (2003), p. 48; Dobbs, R., Kim, A., Lund, S. (2011), pp. 82-93.
23 Cf. Gong, J. J. (2011), p. 4. 24 Cf. Peters, S. (2009), pp. 260-261.
As mentioned, the importance of institutional and foreign investors is growing. These investors have more comprehensive information needs which companies have to satisfy.25 Equity capital providers become the primary target group of the reporting of companies.26
The IFRS react to this development. The management approach obliges companies to report internal information to the public, for instance via the segment reporting.27 Nevertheless, communication through annual reports is problematic. The IFRS-accounting is among other things criticised for its orientation towards the past28 and its intensified application of Fair Value accounting.29 For investors it is more difficult to analyse the annual reports because the quantitative extent of these reports has increased enormously.30 Hence, the IFRS annual accounts cannot completely satisfy the information needs of investors.31
Several companies publish so-called pro-forma key figures in their annual reports, e.g. EBIT or EBITDA.32 The IASB does not regulate these key figures. Managers decide on the way of calculation autonomously.33 For investors this is a problem as managers can influence these key figures easily according to their interests and disguise the real performance of the companies.34
As a consequence, the question arises in which way companies should communicate their increase in Shareholder Value. This question is important to answer.35 A comprehensive external reporting reduces cost of capital36 and helps
25 Cf. Gronwald, T., Nasev, J. (2013), p. 52; Pape, U. (2010), pp. 179-180. 26 Cf. Velte, P., Stiglbauer, M., Sepetauz, K. (2011), p. 124.
27 Cf. Königsgruber, R., Palan, S. (2013), p. 7. 28 Cf. Wellner, K.-U. (2001), p. 42.
29 Cf. Kühnberger, M. (2014), p. 429; cf. for further details Kühnberger, M. (2014), the author contrasts advantages and disadvantages of Fair Value accounting (pp. 434-442).
30 Cf. Christensen, B. E., Glover, S. M., Wood, D. A. (2012), pp. 133-134.
31 Cf. for a comprehensive critique of IFRS: Frings, G. W., Frings, M. C., Mastilak, C. (2012a), pp. 17-21.
32 Cf. Bassen, A., Frank, R., Madsen, O., et al. (2012), p. 360. 33 Cf. Reimsbach, D. (2014), p. 482.
34 Cf. Doyle, J. T., Jennings, J. N., Soliman, M. T. (2013), pp. 41-42. 35 Cf. Macharzina, K., Wolf, J. (2012), pp. 232-233.
Furthermore, investors are intensively claiming information about a company’s activities and its effects on Shareholder Value.38
A solution is the extension of legally fixed reporting standards. This development is called Value Reporting.39 With the additional information of Value Reporting investors are able to evaluate a company on more comprehensive data.40 Value based key figures like EVA, CFROI or SVA are one part of Value Reporting.41 They are a way to show investors at one glance the company’s performance by indicating an increase or decrease of Shareholder Value at the end of the period.42
Academic literature mentions several advantages of value based key figures and theoretical concepts.43 The problem is that companies adapt these developed theoretical concepts to their practical needs.44 Investors cannot compare economic developments of different companies as even key figures with the same name can be calculated in many different ways.45
Furthermore, a high number of value based key figures exist out of which companies can choose.46 It is a difficult choice for managers of a company which performance measures they should implement, in order to steer the organisation best.47 36 Cf. Britzelmaier, B. (2013b), p. 189. 37 Cf. Hilpisch, Y. (2005), p. 205. 38 Cf. Laier, R. (2011), p. 1. 39 Cf. Britzelmaier, B. (2013b), pp. 189-193. 40 Cf. Schierenbeck, H., Wöhle, C. B. (2012), p. 769. 41 Cf. Chari, L. (2009), pp.46-47.
42 Cf. Hoffjan, A., Schroll, S. (2010), p. 410.
43 Cf. Weber, J., Schäffer, U. (2016), p. 183-184; ; frequently flaws of traditional key figures are mentioned in this context, cf. exemplary Horster, J., Knauer, T. (2012), pp. 119-121.
44 Cf. Hahn, G. J., Burger, A., Kuhn, H. (2011), p. 310; Schäffer, U., Lewerenz, U. (2011), p. 298.
45 Cf. Jacque, L. L., Vaaler, P. M. (2001), p. 817; the authors illustrate that more than 160 kinds of conversion exist which can be used to calculate the EVA.
46 Cf. Meyer, M. (2005), p. 62.
Considering described developments on capital markets and in reporting, the current state of research is as follows: Despite the long period of investigation of key figures and their determination of significance, authors do not agree on a common superior key figure. On the contrary: Investigations draw different conclusions.48 This discussion about the best key figures is referred to as Metric War in academic literature.49 Despite many analyses, there is no consensus as to whether value based performance measures are superior to traditional key figures.50 Due to its high popularity several analyses deal with the EVA and its significance. The analysis of other value based performance measures does not have the same scope.51 The number of articles which compare the value relevance of value based performance measures and traditional ones is limited.52 Unanswered is the question which effects the application of value concepts have on Shareholder Value development of a company in contrast to companies which do not use value concepts.53 Closely related to this question is the issue in which dimension value based key figures support investors in their decisions.54 To sum up: Value relevance research is a research field in which research questions are not completely and comprehensively answered55 despite a large number of publications and empirical research.56
48 Cf. exemplary for two contrary position about a value based performance measure: Bacidore, J. M., Boquist, J. A., Milbourn, T. T., et al. (1997) and Ferguson, R., Leistikow, D. (1998); cf. also the empirical study of Barton, J., Hansen, T. B., Pownall, G. (2010) who analyse the value relevance of key figures across 46 countries and cannot determine a common superior key figure.
49 Cf. Myers, R. (1996).
50 Cf. Elgharbawy, A., Abdel-Kader, M. (2013), p. 104; El‐Sayed Ebaid, I. (2011), pp. 70-71; Schultze, W., List, T., Schabert, B., et al. (2018), p. 514; cf. for a comprehensive overview over several investigations Ittner, C. D., Larcker, D. F. (2001), pp. 358-362 and Schremper, R., Pälchen Oliver (2001), pp. 543-546.
51 Cf. Ittner, C. D., Larcker, D. F. (2001), p. 361; cf. for an overview of empirical studies with analysing value relevance of EVA: Gundel, T. (2012), pp. 158-160.
52 Cf. Schremper, R., Pälchen Oliver (2001), p. 543.
53 Cf. Knauer, T., Silge, L., Sommer, F. (2018); Rapp, M. S., Schellong, D., Schmidt, M., et al. (2011), p. 172.
54 Cf. Laier, R. (2011), p. 289. 55 Cf. Barth, M. E. (2000), p. 26. 56 Cf. Kothari, S. P. (2001), p. 106.
measures, academic literature examines which kinds of value concepts are used by companies.57 In Germany, many DAX companies use value based key figures.58 Further need for research is seen in an intensive comparison of applied value concepts.59 An investigation about the implementation of value concepts across a large population of companies is also necessary.60 Many of the empirical studies focus on single countries.61 Cross-national investigations about the application of value based performance measures are rare.62 Many studies concerning Value Based Management (VBM) focus on Anglo-American companies.63
In the context of value based performance measures and the Shareholder Value approach the remuneration of management is a further topic. The way in which the performance of management is influenced, in the sense of shareholders if the remuneration is linked to a value based key figure, should also be investigated.64
1.2 OBJECTIVES
This dissertation has three objectives. The first objective is to examine the application of value based key figures on a European level. Many articles in academic literature deal with the question which key figures German companies use. Investigating the implementation of value concepts on a European level is a
57 Cf. exemplary for investigations about the application of value concepts in the DAX: Aders, C., Herbertinger, M., Schaffer, C., et al. (2003) and Quick, R. (2012).
58 Cf. Borm, M., Britzelmaier, B., Kraus, P., et al. (2012), p. 27.
59 Cf. Arbeitskreis Internes Rechnungswesen der Schmalenbach-Gesellschaft (2010), p. 798.
60 Cf. Burkert, M., Lueg, R. (2013), p. 33.
61 Cf. exemplarily the studies of Aders, C., Herbertinger, M., Schaffer, C., et al. (2003), Laier, R. (2011), Malmi, S., Ikäheimo, S. (2003), Ruhwedel, F., Schultze, W. (2002).
62 Cf. for cross-national studies Firk, S., Schrapp, S., Wolff, M. (2016), Horváth, P., Minning, F. (2001).
63 Cf. Rapp, M. S., Schellong, D., Schmidt, M., et al. (2011), p. 174. 64 Cf. Schäffer, U., Botta, J. (2011), p. 316.
much broader perspective in order to assess the application of value based measures.65
Within the context of application of value based key figures, it is essential to describe the framework conditions in which companies use them: The dominance of the Shareholder Value approach,66 conflicts of interests between managers and investors due to the separation of ownership and control,67 and the competition for capital.68 The illustration of the framework conditions should stress the necessity of Value Reporting for companies in today’s business environment. Furthermore, it is necessary to evaluate the most popular value based key figures on the basis of uniform criteria in order to clarify strengths and weaknesses of each single value concept.
The second objective is to calculate a uniform value based performance measure so that it is possible to compare the performance of selected companies during the investigation period. So far, this is not possible because companies adapt the key figures to their individual needs or do not publish them in the annual report.69
The third objective is to conduct a value relevance analysis in which the value relevance of the previously calculated value based performance measure is compared with value relevance of selected traditional key figures.
This dissertation reduces some of the listed research gaps. Investigating the implementation of value concepts on a European level corresponds to the demand concerning the missing investigations of value based key figures within a large population of companies.70 In addition, the focus is on European companies, not Anglo-American ones.71 Underlining the necessity of Value Reporting in combination with describing the current situation at capital markets helps investors get a better understanding of the effects of Value Reporting on a
65 Cf. Burkert, M., Lueg, R. (2013), p.33.
66 Cf. Bezemer, P.-J., Zajac, E. J., Naumovska, I., et al. (2014), pp. 1-2. 67 Cf. Gong, J. J. (2011), p. 4.
68 Cf. Macharzina, K., Wolf, J. (2012), pp. 232-233. 69 Cf. Schäffer, U., Lewerenz, U. (2011), p. 298. 70 Cf. Burkert, M., Lueg, R. (2013), p. 33.
the value relevance of value based and traditional key figures in the context of the Metric War as it investigates the value relevance in an unique economic situation in Europe.73
Beyond named research gaps, academic researchers are identifying a gap between academic research and practice. This means that results from academic research, in this case management accounting research, are not communicated properly to practitioners even though they are relevant for them. Therefore, research should also deliver insights or solutions for practice. By investigating the named issues, this dissertation aims to contribute to the reduction of the gap between research and practice.74
1.3 STRUCTURE OF WORK
This dissertation is divided in five chapters. The first chapter summarises the problem description, the relevance of the topic and presents the objectives of this work.
The second chapter illustrates the conditions under which companies apply value based performance measures. In the first part the concepts of VBM and the Shareholder Value approach are presented. Due to the high importance of cost of capital in these two concepts the calculation of cost of equity capital on the basis of the Capital Asset Pricing Model (CAPM) is presented.
After introducing principles on which companies act in today’s business world, the relationships between managers and shareholders will be described on basis of the Principal Agent theory. For this purpose the application of the Principal Agent theory in this work is justified and the basic structure of Principal Agent relationships and kinds of information symmetries are presented. Following on from the work of Meckling and Jensen, the importance of key figures as a tool for reducing information asymmetries will be explained. Beside
72 Cf. Laier, R. (2011), p. 289.
73 Cf. Ittner, C. D., Larcker, D. F. (2001), pp. 358-362; Schremper, R., Pälchen Oliver (2001), pp. 543-546.
74 Cf. extensively Nicolai, A., Seidl, D. (2010), p. 1257; Tucker, B., Parker, L. (2014).
the relationship between manager and investor it is also important to analyse the effect of information asymmetries on cost of capital which is done in the following part. The part concludes with a critical discussion of the Principal Agent theory and its assumptions.
After analysing the relationship of managers and shareholders, the relevance of information for the formation of stock prices will be investigated. For this purpose the efficient market model and empirical studies are presented. This part is followed by a presentation of the composition of the group of shareholders and an analysis of their information needs.
In the context of the Principal Agent theory and efficient market model the role of accounting of companies will be assessed. Afterwards, the core principles of IFRS are introduced, followed by a critical assessment of the accounting standard from the investors’ point of view. The last part of the chapter deals with the Value Reporting as a supplement of legal reporting and classifies the disclosure of value based performance measures into the reporting of companies.
The third chapter focuses on value based performance measures and their characteristics. In order to make differences clear between value based performance measures and traditional ones, the first part of the chapter focuses on the commonly used traditional key figures Price Earnings Ratio (PER), Earnings per Share (EPS), Return on Equity (ROE), Return on Sales (ROS) and Return on Investment (ROI).
The second part of the chapter introduces value based performance measures with the help of a general systematisation and listing their advantages in comparison to traditional key figures. This part ends with an introduction of the criteria for assessment of the selected value concepts.
The third part of the chapter starts with an explanation of the concept of residual income which is the justification for applying value based performance measures. In total the third and fourth parts introduce and assess the value based performance measures ROCE Spread, Value Added, EVA, CFROI, CVA, DCF and MVA on a theoretical basis. For every key figure the calculation and its specific characteristic are presented and in a second step each key figure is assessed on the previous defined evaluation criteria.
research with regard to the application of value based performance measures and with regard to value relevance analysis of value based performance measures. Before presenting empirical studies which deal with value relevance analysis, the common research approaches and classification of capital market studies are discussed.
The fourth chapter contains the empirical study and consists of four parts. The first part identifies open questions in scientific literature and derives objectives and hypotheses for the study on the basis of the previously presented status of research. Then the applied methodology for each part of the study is explained. For the value relevance analysis this includes the question which model should be used, what is the theoretical basis for the regression equation, which variables are part of the model and which statistical method is applied. Finally, the data base is specified and described.
The second part shows the results of the empirical study while in the third part the results are interpreted. Finally, the last part of the chapter points out the limitations of this study.
The last chapter of this dissertation summarises the insights gained and shows avenues for future research.
Source: Own illustration
2
FRAMEWORK CONDITIONS FOR THE APPLICATION OF
VALUE BASED PERFORMANCE MEASURES
2.1 MAXIMISATION OF SHAREHOLDER VALUE AS PRIMARY GOAL OF COMPANIES
2.1.1 Necessity of Value Based Management for companies in today’s
business environment
2.1.1.1 Development of Value Based Management
Value Based Management (VBM) is a wide spread management philosophy.75 It can be seen as the fourth stage of Strategic Management76 or as the fourth stage in managerial accounting.77 Famous authors who characterise the ideas behind this philosophy are e.g. Fruhan,78 Rappaport,79 Copeland80, Stern and Stewart81 as well as Lewis.82
For the purpose of this work, VBM summarises the diverse management approaches which focus on the augmentation of company value. The Shareholder Value approach is one example of VBM. The difference between the two terms is the definition of their objectives. The Shareholder Value approach strives to
75 Cf. Britzelmaier, B. (2013b), p. 15; Velthuis, L. J., Wesner, P. (2005), pp. 1-2. 76 Cf. For detailed description of phases of Strategic Management Palli, M. C. (2004), pp. 31-43.
77 Cf. for detailed description of four phases of managerial accounting Ittner, C. D., Larcker, D. F. (2001), pp. 351-352.
78 Cf. Fruhan, W. (1979). 79 Cf. Rappaport, A. (1986).
80 Cf. Copeland, T. E., Koller, T., Murrin, J. (1991). 81 Cf. Stewart, G. B. (1999).
82 Cf. Lewis, T. G., Lehmann, S. (1992); Lewis, T. G., Stelter, D. M., Casata, T., et al. (1995).
increase the return of equity capital providers, whereas VBM in general wants to increase the value of the company.83
Even if the Shareholder Value approach is only a part of VBM, the popularity of Rappaport’s approach initiated the development of VBM. The economic circumstances fostered the spread of VBM. During the 1980ies many hostile takeovers, undertaken by so-called Corporate Raiders, took place in the United States. Companies tried to protect themselves by identifying and closing gaps between market and book value by increasing the market value of the company. In many companies the objectives of shareholders and managers were diverse and led to bad financial results.84 At the beginning of 1990ies, American consulting companies, mainly Stern Stewart & Co. and Holt Planning Associates (later Boston Consulting Group), fostered the implementation of the theoretical concepts within the companies.85 During the New Economy phase at the end of 1990ies VBM finally established as a main guideline for management decisions.86
Over time and until today, the economic circumstances prescribe the necessity of VBM for companies:87
Separation of ownership and control: Several companies are not managed directly by their owners. In these cases managers and owners need a common objective in order to steer the company in the sense of its owners.88
Shortcomings of traditional key figures89 and reinforced application of Cash Flow based measures for evaluating performance of companies.90
83 Cf. for a detailed differentiation between the terms VBM and shareholder value Riedl, J. B. (2000), pp. 85-86; Stiefl, J., Westerholt, K. von (2008), pp. 4-6; cf. contradictory Velthuis, L. J., Wesner, P. (2005), pp. 1-2 who describe VBM as the practical conversion of the Shareholder Value approach; cf. for an overview of the status of research of VBM Lueg, R., Schäffer, U. (2010).
84 Cf. Stiefl, J., Westerholt, K. von (2008), pp. 8-10.
85 Cf. Baum, H.-G., Coenenberg, A. G., Günther, T. (2013), p. 310. 86 Cf. Coenenberg, A. G., Salfeld, R. (2007), pp. 9-7.
87 Cf. for an overview of economic framework conditions Dillerup, R., Stoi, R. (2016), pp. 193-194; Pape, U. (2010), p. 9.
88 Cf. Imberger, K. (2003), p. 25.
89 Cf. for detailed remarks about shortcomings of traditional key figures Knorren, N. (1998), pp. 10-16.
Financial analysts evaluate the performance of a company on the basis of selected key figures and give a buying, selling or holding advice.91
Growing importance of institutional investors.92 Globalisation of capital markets.93
Increased capital procurement via international capital markets.94 Application of own shares for mergers and acquisition activities.95 Threat of a hostile takeover.96
2.1.1.2 Elements and objectives of Value Based Management
The main objective of VBM is to increase the company’s value in the long-term.97 This leads to the necessity of continuous control of Shareholder Value development.98 Besides this primary objective, VBM also supports management by determining if products and activities are delivering a contribution to the company’s value or by making investment decisions. Company owners are enabled by VBM to assess the performance of managers. Last but not least, VBM aligns the interests of managers and owners. By focusing on increasing the company value, they have one common objective.99 Shortly, VBM is a management strategy or approach which strives to reduce conflicts between shareholders and owners, to influence managers to make decisions under consideration of its effects on the company value and finally leads to an increase of the value of the company.100 It is undoubtedly the Controlling department that is especially responsible for monitoring goal attainment in the sense of VBM and
91 Cf. Friedrich, N. (2007), pp. 39-40.
92 Cf. Stührenberg, L., Streich, D., Henke Jörg (2003), p. 1. 93 Cf. Fiss, P. C., Zajac, E. J. (2004), pp. 501; Pape, U. (2010), p. 9. 94 Cf. Bris, A., Koskinen, Y., Nilsson, M. (2014), pp. 554-555. 95 Cf. Coenenberg, A. G., Salfeld, R. (2007), pp. 8-9.
96 Cf., Blyth, M. L., Friskey, E. A., Rappaport, A. (1986), p. 48.
97 Cf. Kraus, P. (2011), pp. 8-9; Stiefl, J., Westerholt, K. von (2008), p. 5; cf. also the empirical study of Ryan, H. E., Trahan, E. A. (2007) which comes to the conclusion that VBM improves economic performance.
98 Cf. Dillerup, R., Stoi, R. (2016), pp. 196-197. 99 Cf. Hilpisch, Y. (2005), pp. 131-133.
provides management with information. In this context key figures seem to be a convenient instrument.101
Four features characterise VBM: Future-oriented, risk-oriented, Cash Flow-oriented and a clear focus on company value.102 The focus on future is not surprising as the main objective of VBM is to ensure the long-term existence of a company. For this purpose decisions have to be evaluated against their consequences on the long-term company value. It is decisive how the company will perform in future.103
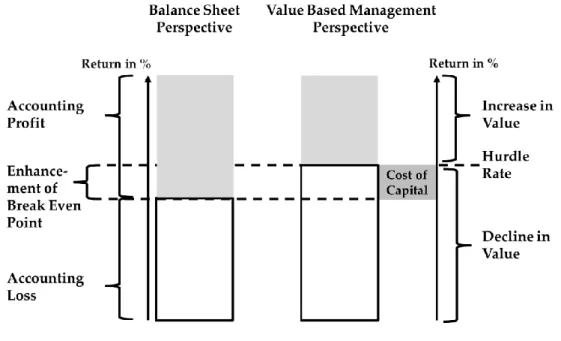
The second characteristic, risk-oriented, describes the attitude of equity capital providers. From their point of view, a company is an investment with a certain risk factor. For this risk factor the company has to deliver an adequate rate of return. The higher the risk, the higher the required rate of return.104 If the expected rate of return is not delivered, equity capital providers will withdraw their capital. Costs of equity capital are nothing other than opportunity costs.105 By considering the required rate of return, the hurdle rate for companies raises as the costs for equity capital are not included in the profit disclosed in the profit and loss statement.106 In order to fulfil the required returns by investors, companies at least have to reach a level of profit which covers the total cost of capital. The illustration below contrasts the assessment of success on the basis of balance sheet profits and from VBM’s perspective.107
101 Cf. Ossadnik, W., Barklage, D. (2003). pp. 1286-1287.
102 Cf. Krol, F. (2009), pp. 61-66; cf. for similar characteristics Ebeling, C. (2007), pp. 3-4; Tappe, R. (2009), pp. 68-71.
103 Cf. Aders, C., Herbertinger, M., Wiedemann, F. (2003), pp. 356-358. 104 Cf. Horváth, P. (2011), pp. 443-445.
105 Cf. Reim, J. (2015), p. 554. 106 Cf. Behringer, S. (2014), p. 101.
107 Cf. Auer, M. (2007), pp. 302-303; Wolf, R. (2014), pp. 7-9; Wuntsch, M. v., Bach, S. (2012), p. 21.
In the style of: Behringer, S. (2014), p. 101; Kraus (2011), p. 7
Illustration 2: Comparison of hurdle rates from a balance sheet perspective and VBM perspective
The third characteristic of VBM is the focus on Cash Flow based measures.108 The principles of dynamic investment theory are transferred to the valuation of a company. This means that Cash Flows of a company are mathematically discounted in order to derive the value of the company. Changes in company value are often measured in key figures based on Cash Flows.109
The forth characteristic of VBM, clear focus on company value, refers to the main objective. If a company strives to increase its value, every decision has to be checked against this target. This applies also for every concept which is categorised as VBM.110
The characteristics of VBM show a combination of insights of capital market and investment theory.111 Elements of investment theory are transferred to
108 Cf. Ebeling, C. (2007), p.3. 109 Cf. Tappe, R. (2009), pp. 70-71.
110 Cf. Weber, J., Bramsemann, U., Heineke, C., et al. (2017), pp. 17-19. 111 Cf. Britzelmaier, B. (2013a), p. 208.
corporate evaluation. The company is an investment object which generates Cash Flows. Following on from these Cash Flows, a present value can be calculated. Hereby the distribution over time and level of Cash Flows as well as the inherent risk for these Cash Flows are considered.112 Insights from capital market theory are used by calculating the cost of equity capital. Regularly the CAPM is used for this purpose.113 In total, VBM is not an invention of a completely new management approach, but a useful combination of established theories.114
VBM does not only consist of financial or controlling aspects.115 Apart from value based performance measures, which are a method to determine value creation in the sense of VBM, further topics and areas can be assigned to VBM. For example, development and assessment of corporate strategies, the structure of management compensation dependent on a company’s performance or the appropriate communication to the capital market.116 Due to its various aspects it is difficult and costly to implement VBM successfully in a company. Companies have often underestimated these efforts.117
Many aspects of VBM are summarised and categorised in the VBM accounting framework which divides the process of VBM in six steps.118 The first step is to choose appropriate organisational objectives. This step also refers to the application of value based performance measures because they play an important role in aligning internal objectives with an increase of company value.
The second step is to develop a strategy and to select an organisational design which fits to the defined objectives in the first step.119 Examples for a developed strategy are cost leadership strategy or innovation strategy on which a
112 Cf. Schönherr, M. (2016), pp. 59-60. 113 Cf. Dinstuhl, V. (2003), p. 24.
114 Cf. Baum, H.-G., Coenenberg, A. G., Günther, T. (2013), p. 310.
115 Cf. Haspeslagh, P., Noda, T., Boulos, F. (2001), p. 68; Hirsch, B. (2006), p. 271. 116 Cf. Coenenberg, A. G., Salfeld, R. (2007), pp. 10-13; Hirsch, B. (2006), p. 271. 117 Cf. Haspeslagh, P., Noda, T., Boulos, F. (2001), pp. 66-67.
118 Cf. for a comprehensive description and an overview of many aspects of VBM Ittner, C. D., Larcker, D. F. (2001).
company can focus. Organisational design refers to the structure of a company, like decentralisation or allocation of decision rights to managers.120
The third step comprises the identification of value drivers. These are factors which lead to an increase of company value.121 Exemplary methods for identifying cost drivers are activity-based costing, strategic cost management or Balanced Scorecard.122
In the fourth step the company develops action plans, selects performance measures and sets targets which are associated with the value drivers identified in step three.
The fifth step is to evaluate the performance of the company and its managers. In order to take current results and development into account, it is necessary that a company continuously reassesses the organisational objectives, strategies, organisational design, value drivers and control system. So, this process is iterative and starts again at step one.123
The VBM accounting framework stresses the important role of appropriate performance measures and designed control systems in the context of VBM. Key figures are involved in step one with setting the organisational objectives and in step four and five within the decision for the relevant key figures and observing them.124 The application of key figures in the context of VBM is essential because they are an important tool for managers to make decisions which increase the company value and communicate achieved successes to external shareholders and stakeholders.125 120 Cf. Ittner, C. D., Larcker, D. F. (2001), pp. 362-364. 121 Cf. Ittner, C. D., Larcker, D. F. (2001), p. 368. 122 Cf. Ittner, C. D., Larcker, D. F. (2001), pp. 368-371. 123 Cf. Ittner, C. D., Larcker, D. F. (2001), p. 353. 124 Cf. Ittner, C. D., Larcker, D. F. (2001), pp. 353, 358-362. 125 Cf. Holler, A. (2009), pp. 1-2.