i
FINANCIAL DEVELOPMENT, INTEGRATION AND ACCESS TO FINANCE IN AFRICA
Grace Etim Essien
Submitted in accordance with the requirements for the degree of Doctor of Philosophy
The University of Leeds The Department of Economics Leeds University Business School
ii
The Candidate confirms that work submitted is her own and that appropriate credit has been given where reference has been made to the work of others.
This copy has been supplied on the understanding that it is copyright material and that no quotation from the thesis may be published without proper acknowledgement.
iii ACKNOWLEDGMENTS
First and Foremost, I offer my deepest gratitude to the Almighty God who has been with me throughout the entire time and providing me with everything I have ever needed.
I am also deeply indebted to my Supervisor, Dr. Kausik Chaudhuri for his constant support. His patience and steadfast encouragement helped me to complete this work. I am also grateful to Professor Malcolm Sawyer for accepting to supervise me and for all his valuable comments, suggestions and supports. I am also thankful to the late Dr. Kevin Reilly, for his guidance and support I received earlier on in my research, his support remains invaluable in my heart.
I would also like to express my deepest gratitude to my father for providing the funds and for his constant prayers and encouragement that helped me through this process. My mother has been a major support. I appreciate her for her sacrifices, daily calls, prayers, and for being a source of inspiration. I am also thankful to my siblings for their unending encouragement and support.
My sincere appreciation goes to friends and colleagues Dr. Halima Jibril, Dr. Faith Bamiduro, Dupe Ajayi, and Dr. Tolulope Ibukun for their invaluable discussion and suggestions. I am also grateful to my Leeds family: DLBC Leeds, Dr. Victor Ebenuwa and his wife for making my stay in Leeds a memorable one with their unending love and sweet fellowship.
Lastly, I am extremely thankful to my husband, Paul, whose love, support, and belief in me made this possible. Thanks for your prayers, encouragements, and for sharing in my joy and tears during this PhD process.
iv ABSTRACT
This thesis is made up of three empirical studies that fall under the general classification of international and financial economics, particularly the study focuses on the financial system of selected African countries.
The first empirical study presented in Chapter 2 examines the role of financial development in improving the effect of FDI on the economic growth of some African countries. Investigations were conducted to pinpoint which financial structure could provide the best improvement by applying the bank-based vs. market-based debate. Results from the regression analysis conducted show that the effect of FDI on economic growth becomes significant only when financial development measures were factored in. Analysis of results indicate that development of the overall financial system of African countries would be more beneficial in comparison to developing either the banks or financial markets alone.
Chapter 3 empirically measures the level of financial integration in Africa’s Regional Economic Communities (RECs) using beta and sigma convergence to measure the speed and degree of financial integration in four RECs. These chapter also theoretically examines how regional financial integration contributes to financial development and economic growth in Africa. Analysis of the results show that Africa’s RECs are integrating at a relatively slow and diverse rate. Therefore, policy makers in Africa would need to focus on reform strategies that would strengthen financial integration in their regions. A fully financially integrated system would contribute immensely to financial development and promote sustainable economic growth.
The fourth chapter investigates the effect of access to finance on firms’ productivity. Using cross-sectional firm-level data to estimate the effect of access to finance on labor productivity, total factor productivity (TFP), and the stochastic frontier trans-log model. This study estimates an instrumental variable (GMM) model to address potential endogeneity bias between access to credit and firms’ productivity. The results obtained show that the lack of access to finance negatively affects the productivity of firms in Africa. This study suggests that the development of a balanced financial system should be of topmost priority to policy makers. This ensures that more finance is channeled towards those firms whose productivity depends heavily on the availability of finance irrespective of their characteristics. This would result in firms increasing their investments in productivity-enhancing activities, which would benefit long-term economic growth.
v TABLE OF CONTENTS
ACKNOWLEDGMENTS ... iii
ABSTRACT ... iv
TABLE OF CONTENTS ... v
LIST OF TABLES ... viii
LIST OF FIGURES ... x
ABBREVIATIONS ... xii
Chapter 1: INTRODUCTION... 1
1.1 Background and Objectives of the Thesis ... 1
1.2 Layout and Content of the Thesis ... 4
Chapter 2: FOREIGN DIRECT INVESTMENT AND ECONOMIC GROWTH IN AFRICA: THE ROLE OF FINANCIAL DEVELOPMENT ... 6
2.1 Introduction ... 6
2.2 Overview of Africa’s Financial Systems and FDI Inflow ... 10
2.2.1 General Overview ... 10
2.2.2 Detailed Review of Selected Financial Systems ... 15
2.2.3 The Inflow of Foreign Direct Investment in Africa ... 27
2.3 Literature Review... 30
2.3.1 FDI and Economic Growth ... 30
2.3.2 The Role of Financial System Development in the FDI-Growth Nexus ... 33
2.3.3 The Financial Structure Claim (Bank-based vs. Market-based debate). ... 39
2.4 Methodology and Analytical Framework ... 46
2.4.1 Model Specification ... 46
2.4.2 Expected Signs ... 48
2.4.3 The Method ... 48
2.4.4 Econometrics Problem: Endogeneity ... 49
2.4.5 Description of Variables ... 50
2.4.6 Data ... 56
2.4.7 Country Classification of the Financial Structure ... 58
2.5 Empirical Results ... 61
2.6.1 Panel Unit Root Test ... 61
vi
2.6 Conclusion and Policy Implications ... 67
Chapter 3: REGIONAL FINANCIAL INTEGRATION IN AFRICA ... 68
3.1 Introduction ... 68
3.2 Process and Progress of Regional Financial Integration (RFI) and Monetary Union Formation in Africa... 72
3.2.1 Process of Regional Financial Integration and Monetary Union Formation ... 72
3.2.2 Progress towards Regional Financial Integration and Monetary Union Formation74 3.3 Literature Review... 87
3.3.1 The Potential Cost and Contribution of Regional Financial Integration in Africa . 87 3.3.2 Regional Financial Integration and Financial Development in Africa ... 89
3.3.3 Measuring Regional Financial Integration... 90
3.4 Methodology and Analytical Framework ... 95
3.4.1 Definition of Financial Integration – The Model ... 95
3.4.2 The Methods ... 96 3.4.2 Data ... 97 3.5. Empirical Results ... 102 3.5.1 Beta Convergence ... 102 3.5.2 Sigma Convergence ... 111 3.5.3 Discussion of Results ... 113
3.6 Conclusion and Policy Recommendations... 114
Chapter 4: FINANCE AND FIRM PRODUCTIVITY IN AFRICA: BACKGROUND STUDY FROM WORLD BANK ENTERPRISE SURVEY DATA ... 117
4.1 Introduction ... 117
4.2 The Composition of Finance across Firms in Africa ... 120
4.3 Literature Review... 127
4.3.1 Theoretical Framework ... 127
4.3.2 Empirical Review... 138
4.4 Methodology and Analytical Framework ... 142
4.4.1 Model Estimation ... 142
4.4.2 The Method: Estimating Productivity ... 144
4.4.3 Description of Data ... 145
vii
4.5 Empirical Results ... 149
4.5.1 OLS Estimates: Total Factor Productivity Model ... 149
4.5.2: Robustness Checks ... 152
4.5.3: OLS Estimates: Labour Productivity Model ... 154
4.5.4 IV-GMM: Instrumental Variable Model ... 156
4.5.5: Stochastic Frontier Model ... 157
4.6 Conclusion and Policy Implication ... 159
Chapter 5: CONCLUSION ... 160
REFERENCES ... 164
viii LIST OF TABLES
Table 1: Turnover as a % of GDP ... 13
Table 2: Number of Listed Companies ... 14
Table 3: Banking System Indicators in Egypt ... 19
Table 4: Structure of Ghana’s financial system ... 20
Table 5: Kenya’s Banking System Compared to Others (%) ... 21
Table 6: Structure of Morocco’s financial system, 2005-2007 ... 22
Table 7: Financial Soundness Indicator in South Africa. 2002-2007 ... 24
Table 8: FDI flows by region, 2010-2012 ... 28
Table 9: Inward FDI rates of return, 2006-2011 ... 29
Table 10: Summary list of the financial system development measures ... 53
Table 11: Principal Component Analysis for Overall Financial Development-Liquidity ... 57
Table 12: Principal Component Analysis for Structural Aggregate ... 58
Table 13: Country Classification of the Financial Structure ... 59
Table 14: Long-run and Short-run DFE result, Without Interaction term ... 62
Table 15: DFE result, With Interaction term: (Dependent variable 𝛥Log GDPPP) ... 64
Table 16: Stages of RFI in Africa ... 72
Table 17: Status of Implementation of integration agenda per RECs ... 86
Table 18: ECOWAS: Beta Convergence in Interbank Market – Pooled regression ... 102
Table 19: ECOWAS: Beta Convergence in Bank-Credit Market – Individual regression .... 103
Table 20: WAMZ: Beta Convergence in Interbank Market – Pooled regression... 104
Table 21: SADC: Beta Convergence in Interbank Market – Pooled regression... 105
Table 22: SADC: Beta Convergence in Interbank Market – Individual regression ... 106
Table 23: SADC members without overlapping membership: Beta Convergence in Interbank Market – Pooled regression ... 107
Table 24: CMA: Beta Convergence in Interbank Market – Pooled regression ... 107
Table 25: SACU: Beta Convergence in Interbank Market – Pooled regression... 107
Table 26: COMESA: Beta Convergence in Interbank Market – Pooled regression... 108
Table 27: COMESA: Beta Convergence in Interbank Market – Individual regression ... 109
Table 28: EAC: Beta Convergence in Interbank Market – Pooled regression ... 110
Table 29: EAC: Beta Convergence in Interbank Market – Individual regression ... 110
ix
Table 31: Access to finance based on type of ownership ... 125
Table 32: Reasons for not applying for loans or line of credit. ... 126
Table 33: Base Regression Results (OLS): Whole Sample ... 149
Table 34: Base Regression Results (OLS): Whole Sample with Country Dummy ... 151
Table 35: Base Regression Results (OLS): Whole Sample ... 152
Table 36: Base Regression Results (OLS): Size of the Firms ... 153
Table 37: Base Regression Results (OLS): Ownership of the Firms... 154
Table 38: Base Regression Results (OLS): Whole Sample ... 155
Table 39: IV-GMM: Instrumental Variable Model ... 156
x LIST OF FIGURES
Figure 1: Measures of Financial Development ... 11
Figure 2: Domestic credit to Private sectors by banks (% of GDP) - Africa ... 12
Figure 3: Number of Listed Companies ... 15
Figure 4: Market Capitalization (% of GDP) ... 15
Figure 5: Domestic credit to Private sectors by banks (% of GDP) – Sample data ... 16
Figure 6: Domestic credit provided by the financial sector (% of GDP) ... 16
Figure 7: Size of Botswana’s Banks Relative to the Economy ... 17
Figure 8: Market Capitalization of listed companies (% of GDP) in Cote d’Ivoire ... 18
Figure 9: Financial soundness Indicators in Nigeria... 23
Figure 10: FDI inflows by region, 2008-2012 (Billions of dollars) ... 27
Figure 11: Top 5 recipients of FDI in Africa 2011-2012 (Billions of Dollars) ... 29
Figure 12: Map Showing Member countries of CEN-SAD... 75
Figure 13: Map Showing Member countries of COMESA ... 76
Figure 14: Map Showing Member countries of EAC ... 78
Figure 15: Map Showing Member countries of ECCAS ... 79
Figure 16: Map Showing Member countries of ECOWAS ... 81
Figure 17: Map Showing Member countries of IGAD ... 82
Figure 18: Map Showing Member countries of SADC ... 83
Figure 19: Map Showing Member countries of AMU... 84
Figure 20: Interest Rate spreads of selected ECOWAS countries ... 98
Figure 21: WAEMU: Interest Rate Spreads ... 99
Figure 22: WAMZ: Interest Rate Spreads ... 99
Figure 23: Interest rate spread of selected EAC countries ... 100
Figure 24: Interest rate spread of selected COMESA countries ... 100
Figure 25: Interest rate spread of selected SADC countries ... 101
Figure 26: Sigma Convergence: ECOWAS ... 112
Figure 27: Sigma Convergence: SADC ... 112
Figure 28: Sigma Convergence: COMESA ... 112
Figure 29: Sigma Convergence: EAC... 112
xi
Figure 31: Proportion of Investments Financed by Various Sources of Finance ... 121
Figure 32: Percentage of firms using financing for Working Capital ... 121
Figure 33: Percentage of firms using financing for Investment ... 122
Figure 34: Firms Access to Finance... 123
Figure 35: Access to Finance based on Firm’s Size ... 124
xii ABBREVIATIONS ABSA: ACM: ADB: AEC: AMU: ASEAN: AU: BD BIS: BOB: CARICOM: CEMAC: CEN-SAD CMA: COMESA: CSE: DFD: DFE: EAC: ECB: ECCAS: ECOWAS: ECU: EU: ES FD: FDI: FINDEX: FS:
Amalgamated Bank of South Africa Africa Common Market
African Development Bank African Economic Community Arab Maghreb Union
Association of Southeast Asian Nations African Union
Banking System Development Measures Business Innovation and Skills
Bank of Botswana Caribbean Community
Central African Economic and Monetary Community Community of Sahel-Saharan States
Common Monetary Area
Common Market for Eastern and Southern Africa Casablanca Stock Exchange
Destination country’s financial development Dynamic Fixed Effect
Eastern African Community European Central Bank
Economic Community of Central African States
ECOWAS: Economic Community of West African States Equatorial Customs Union
Eurozone
Enterprise Survey
Overall Financial Development Measures Foreign Direct Investment
The Financial Index Formula Financial Structure
xiii FTA: GDP GSE: IGAD: IMF: JSE: LuSE: MNCs: NBFIs OCA: ODA: OECD: OTC: PCA: R&D: RECs: RFI: SACU: SADC: SD SEM: SMEs: SSA: TFP: UK: UNCTAD: UNECA: US: WAEMU: WAMZ:
Free Trade Areas
Gross Domestic Product Ghana stock exchange
Intergovernmental Authority on Development International Monetary Fund
Johannesburg Stock Exchange Lusaka Stock Exchange Multinational companies Nonbank Financial Institutions Optimum Currency Area
Official Development Assistance Organisation for Economic Cooperation Over-The-Counter Market
Principal Component Analysis Research and Development Regional Economic Communities Regional Financial Integration Southern African Customs Union
Southern African Development Community Stock Market Development Measures Stock Exchange in Mauritius
Small and medium-sized enterprises Sub-Saharan African
Total Factor Productivity The United Kingdom
United Nations Conference on Trade and Development United Nations Economic Commission for Africa The United States
West African Economic and Monetary Union West African Monetary Zone
1 Chapter 1: INTRODUCTION
1.1Background and Objectives of the Thesis
Africa has been recognised as the next frontier for economic development. The World Bank’s 2015 Global Report states that Africa ranks behind North America as the second most attractive destination for investment. In Doing Business Ranking for 2015, amongst the top ten global improvers five1 African countries were included. The continent of Africa has experienced a significant increase in the influx of investors seeking to invest mainly in non-commodities sectors such as manufacturing, financial services, and construction (Makhtar et al., 2015). For example, the inflow of Foreign Direct Investment (FDI) in 2015 was $60 billion, five times its level for 2000. Particularly, China, Turkey, and India have increased their investments in Africa and are the major job creators in the manufacturing sector (Makhtar et al., 2015).
However, despite the prospects of Africa, the continent faces major economic and social challenges. The 2016 Africa’s prosperity report shows that the growth in Africa’s economy is not consequently being transformed into higher levels of prosperity in individual countries. Besides being the least developed continent in the world, Africa remains the poorest region with negligible technological advancement, the most indebted, food-insecure, and marginalised region (UNECA, 2014). Almost two-thirds of Africans lack access to adequate infrastructure and basic human needs such as electricity, water, and food (UNECA, 2014).
According to the World Bank, one of the major challenges amongst others is the inability of Africa’s financial system to promote economic growth that is sustainable and inclusive. A developed, integrated, competitive, and efficient financial system that is accessible to a wider range of a country’s population is a fundamental requirement for sustaining economic growth and development. (Ndulu, 2007). Evidence from theoretical and empirical literature shows that the financial system plays a major role in sustaining economic growth, stimulating poverty reduction, and income equality (Levine 1997; Ndikumana 2001; Ndulu 2007; Goodhart 2016). However, although Africa’s financial systems have made some remarkable improvement, it remains underdeveloped, shallow, unintegrated, and serves a limited number of people. This thesis focuses on three aspects of the financial system. The first two empirical studies use country-level data (macro) to explore the concept of financial development and integration
2
respectively, and the third study uses firm-level data (micro) to examine how finance affects firms’ productivity.
The first aspect of the financial system explored is financial development. The first empirical analysis examines the role of financial development in improving the effect of FDI on Africa’s growth. The major contribution of this study is that it introduces a new dimension by applying the bank-based vs. market-based debate to determine which financial system would be more appropriate in improving this effect. In Africa, FDI is a major source of external finance and capital investment. Some of the benefits derived from the inflow of FDI include job creation, technology transfer, and spillover effects. However, these benefits do not accrue automatically as the condition of the host country is an important factor in determining how well a country benefits from FDI inflow (Alfaro et al., 2004).
According to Carp Lenuta (2013), the financial system is one of the main channels through which the benefits of FDI can betransmitted to the host country’s economy.Alfaro et al., (2004) states that the nature of the host countries financial system determines how well they would be able to benefit from the inflow of FDI. The economic literature posits that in a well-functioning economy, there is the need for a financial system that promotes fund transfer between people who invest, lend, and borrow (United Nations Economic Commission for Africa, 2008). A developed financial system ensures that foreign investors have access to efficient financial services, and domestic firms can access external finance to meet the technological knowledge gaps generated through FDI inflow (Alfaro et al., 2003).
Beyond the analysis of the role of financial development, this study examines if the dominance of the bank-based system has an effect on how the benefits of FDI is accrued on economic growth in Africa. This study analysis the need for African countries to move from financial systems dominated by banks to a balanced financial system comprising of well-functioning and efficient banks and stock markets by applying the bank-based versus market-based debate. The results of the study show that in the absence of financial development measures, the effect of FDI on economic growth is positive but insignificant for the sampled countries. However, when financial development measures are factored in, FDI significantly and positively impacts economic growth. Furthermore, the results show that this positive effect would be improved if the overall financial system of African countries is developed compared to developing either the banks or financial markets alone.
3
Financial integration is the second aspect explored in the second empirical analysis. The first empirical analysis of this thesis suggests that the development of the overall financial system enhances the effect of FDI on economic growth, thereby promoting sustainable economic growth in Africa. However, Africa’s financial systems remain underdeveloped, shallow, inaccessible, and lack depth (Yartey 2008; Allen et al., 2010). Hence, this observation supports the hypothesis that the underdeveloped nature of Africa’s financial system could be contributing to its inability to benefit fully from FDI inflow and therefore enhance sustainable economic growth.
In an attempt to address the issue of underdeveloped financial systems in Africa, policymakers are beginning to recognise the need for pooling financial resources together. Studies by the World Bank and other financial institutions suggest that the promotion of regional financial integration (RFI) could potentially address the problems associated with the underdeveloped nature of Africa’s financial system. Africa’s regional economic communities (RECs) are beginning to establish sub-regional capital markets to overcome the limitations of their fragmented capital markets (United Nations Economic Commission for Africa, 2008). African countries are currently pursuing the agenda of regional financial integration and monetary union formation to promote sustainable economic growth and reduced poverty level.
The second empirical analysis measures the extent of regional financial integration in Africa’s RECs using beta and sigma convergence to measure the speed and degree of financial integration. This study also theoretically examines the potential contribution of regional financial integration towards financial development and sustainable economic growth in Africa. The findings of this study show that the level of RFI in Africa’s RECs is incomplete and uneven. The financial systems and economic conditions of Africa’s RECs would be better off if they focus on strengthening regional financial integration in their regions and slow down on the agenda of monetary union formation.
The third empirical analysis explores the effect of the financial system at the micro level. Access to finance has been considered to be one of the important factors in influencing firms’ real activities and in promoting aggregate growth. According to Beck et al., (2013), the productivity of firms is considered an important catalyst for growth and development in Africa. However, various factors such as skilled labour, stable energy supply, access to finance amongst others constrain firms’ productivity. However, literature on the relationship between finance and firm-level productivity is almost non-existent for African countries. This study fills this gap using cross-sectional firm-level data from World Bank Enterprise Survey data from
4
17 African countries and 4682 firms from the period 2006-2014. The effect of access to finance on labour productivity, total factor productivity (TFP) and stochastic frontier Cobb-Douglas and translog model are analysed. Access to finance is captured using direct measures such as having a checking or savings account, the presence or absence of overdrafts and lines of credit.
The results obtained show that the lack of access to finance, especially overdraft facilities negatively affects the productivity of firms in Africa. Also, smaller firms and sole-proprietorships are mostly affected because they have less access to finance. Access to finance improves the number of start-ups, enables firms to benefit from growth and investment opportunities, and is essential for the daily operation and long-term sustenance of the firm (Beck et al., 2009). Therefore, African countries should strive to have developed financial systems that ensure the efficient allocation of finance to the appropriate firms irrespective of their characteristics.
1.2 Layout and Content of the Thesis
This thesis comprises of three separate but related empirical analyses. Chapter 2, 3, and 4 each form a self-contained study and have similar format. Chapter 2 examines the role of financial development in the FDI-growth Nexus. This chapter uses measures of financial development to construct overall financial development measure, banking system development measure, and stock market development measure. To estimate the role of financial development, each development measure is made to interact with the measure of FDI. The Dynamic fixed effect estimation method developed by Pesaran et al., (1999) with cross-correlated effect in the long run is employed to control for potential cross-sectional dependence and heterogeneity across panels.
Chapter 3 presents an analysis of the level of regional financial integration in Africa’s RECs by measuring the extent of financial integration in Africa’s Regional Economic Communities (RECs). This study uses 3-month interbank interest rate data for four RECs to measure the speed and degree of convergence using beta and sigma convergence respectively. This study also theoretically examines how regional financial integration could contribute to the development of Africa’s financial system and promote sustainable economic development. Chapter 4 contains an empirical analysis of the effect of access to finance on firms’ productivity. Cross-sectional firm-level data from World Bank Enterprise Survey is used estimate the effect of access to bank overdrafts, credit line and checking account on various measures of productivity such as labour productivity, total factor productivity (TFP) and stochastic frontier
5
Cobb-Douglas and translog model. To address potential endogeneity and OLS estimation bias, instrumental variable (GMM) model is used to estimate the TFP model using the type of ownership and the sex of the owner(s) as instruments. Chapter 5 presents the overall conclusion and policy recommendations.
6
Chapter 2: FOREIGN DIRECT INVESTMENT AND ECONOMIC GROWTH IN AFRICA: THE ROLE OF FINANCIAL DEVELOPMENT*
2.1 Introduction
According to recent reports, before the financial crisis (2002 - 2008) Africa’s economy achieved average annual growth rates of 5.6%, this unsurprisingly fell to just about 2.2% in 2009 before recovering to 4.6% in 2010 (UNECA, 2013). By 2012, Africa recorded an average annual growth rate of 5% in spite of the economic uncertainties and global slowdown, and the recovery progressed to about 5.6% for 2014. Projections forecast a potential growth rate of 6% for 2015, thereby making Africa one of the fastest-growing regions in the world (UNECA, 2013, UNECA, 2015).
While Africa seems to be returning to relatively strong growth rates, the continent still faces some challenges. One of the major concerns is that Africa’s impressive economic growth has not translated into a diversified economy which creates jobs, and fosters faster social development (UNECA, 2013). Africa still lags behind regarding socio-economic progress when compared to other developing continents. This is because Africa has not been able to produce sufficient domestic savings and investments in its economy, a problem that can be addressed by not just assessing the quantity but the quality of investments (UNECA, 2015). According to Dahou et al., (2009), Africa continuously requires a significant amount of capital investment for productivity enhancement, job creation, and the provision of basic amenities for individuals and households.
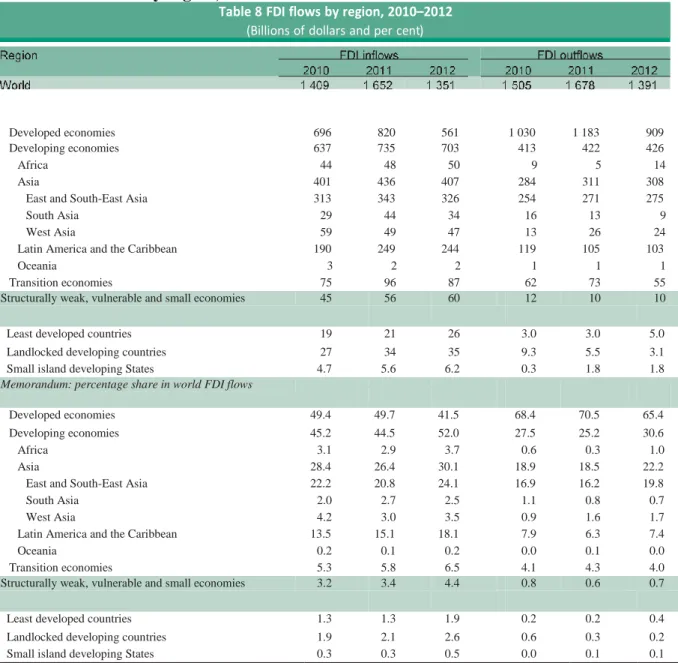
Foreign Direct Investment (FDI) is a primary source of capital investment and external finance in Africa. FDI is assumed to be a major factor in improving Africa’s economy because of the benefits accrued from it. Also, it is the main form of foreign private capital inflows in Africa. The inflow of FDI to Africa ranks higher than other sources of external finance such as remittances, private debt and portfolio equity, and Official Development Assistance (ODA). According to UNCTAD (2013), FDI flow to Africa increased by 5% to $50 billion, making it one of the few regions that registered a year-on-year growth in 2012. In 2013, Africa experienced a further increase of 4% to $57 billion (UNCTAD, 2014).
*Part of this chapter has been published in International Research Journal of Finance and Economics. Issue 141, October 2015.
This chapter has been presented in the following conferences:
Royal Economic Society (RES) PhD Meeting and Job Market at Cambridge London in January 2015. 8th RGS doctoral conference in economics at Universität Duisburg-Essen, Germany in February 2015.
7
Endogenous growth theory suggests that the condition of the financial system is crucial in determining not only the quantity but quality of FDI that a country can attract (Alfaro et al., 2004). This chapter empirically investigates the role of financial development in improving the effect of FDI on Africa’s economy to ensure a sustainable and fully inclusive growth. This chapter contributes to the literature by applying the bank-based or market-based financial system debate to the FDI-growth nexus in Africa. It introduces a new dimension to the analysis of financial development by investigating which financial system would be more appropriate in improving this effect. Hence, results presented in this chapter could contribute to enhancing existing knowledge in the field of financial development.
The broad objective of this chapter is to determine the role of financial development in enhancing the relationship between FDI and economic growth in African countries while identifying whether the dominance of the banking system is affecting how the benefits of FDI is accrued on economic growth in Africa. To achieve this, the following specific sub-objectives will be pursued: determine the overall effect of the development of the financial system (i.e. banks and stock markets) on the FDI-growth linkage using aggregate measures of financial development, analyse the effect of the choice of developing only banks and stock markets respectively on FDI-growth nexus in Africa using measures of the financial structure. Based on the findings, this chapter would proffer policy advice that could assist in enhancing the effect of FDI on African economies through the development of the appropriate financial system.
The financial system consists mainly of financial intermediaries (i.e. banks) and financial markets (i.e. stock markets) which function differently and have different effects on economic performance. The study by Allen et al. (2010) shows that Africa’s financial system is mainly dominated by banks because they have the ability to function even in environments with poor institutions. However, it is argued that Africa needs both types of financial institutions (banks and stock markets), because preferring one over the other may leave Africa without the long-term finance it requires to stimulate economic growth (Rateiwa and Aziakpono, 2015). The dominance of the banking system in Africa has led to the existence of a financial gap2 in Africa, because the predicted levels of financial development exceeds the actual level experienced (Mahonye and Ojah, 2014). Hence, the existence of this financial gap has led to new interest in the role of the stock markets in African economies.
8
This chapter addresses this concern by investigating whether Africa’s focus on developing a bank-based system is supporting or hampering the effect of FDI on economic growth, and if it should move towards developing a market-based system, or focus on developing well-functioning and efficient banks and stock-markets. In other words, this chapter explores whether the degree to which African countries financing sources mix is slanted (bank-based or market-based finance) matters for fully benefiting from FDI inflow.
The relevance of this study to the African context are: first, the largely undeveloped nature of Africa’s economy subjects African leaders to intense pressure to improve and strengthen the drivers of economic growth so as to stimulate development within their countries. Second, expert knowledge of the relative importance of the banking sector and stock market in the financial system is a vital tool needed by the government to formulate optimum growth-enhancing economic policy. Therefore, the form of financial system that would promote sustainable economic growth must be determined to aid the formulation of sound economic policy for the country (Arestis et al., 2005). Lastly, using financial development measures that capture only one aspect of the financial system (i.e. banks) in an economy with fairly developed stock markets hinders the financial system from exerting its overall effect on the economy and could lead to incorrect conclusions on the effects of financial development and its role in the FDI-growth nexus. (Aziakpono, 2008: Beck and Levine, 2004).
The results obtained showed that developing the overall financial system of African countries is more beneficial than developing either the banks or financial markets. The results are inconsistent with the bank-based and market-based view of the financial system. Therefore, the dominance of the banking system in African economies could be limiting the effect of FDI on economic growth. A balanced financial system consisting of both banks and stock markets that provide efficient and effective services improves the effect of FDI on economic growth in African countries. Therefore, the overarching policy implication is that relevant authorities should invest in accumulating quantity and quality financial services in order to fully benefit from FDI inflow in Africa. As a result, policymakers should concentrate on formulating and implementing structural reform strategies that promote the development of stock markets that would work in harmonization with banks. Significantly, the liquidity of banks and stock markets should be developed.
The chapter is structured as follows. Section 2.2 provides an overview of Africa’s financial systems and FDI Inflow. Section 2.3 reviews existing theoretical and empirical literature on FDI, financial development, and economic growth. Section 2.4 provides details of the
9
econometric methodology used and describes the data in the study. Section 2.5 reports and discusses the results, and the summary of findings, implications for policy action and conclusions are presented in Section 2.6.
10
2.2 Overview of Africa’s Financial Systems and FDI Inflow
The continent of Africa is made up of 53 countries, with each country having different economic and cultural characteristics including different financial systems (Allen et al., 2010). Having been characterized as a region with challenging financial markets due to its political and economic problems, recent practice of market liberalization makes the continent increasingly attractive to foreign traders and investors. Given that the African continent is a diverse one, a review of its financial systems becomes a challenge (Allen et al., 2010). This section would review the general financial system of Africa and provides a detailed overview of the twelve3 countries used in the empirical analysis. It also reviews the flow of FDI into Africa.
2.2.1 General Overview
Africa has most of the least developed financial systems in the world (Dahou et al., 2009; Becks et al., 2009; Allen et al., 2010). The financial markets in most African countries are characterized by inadequate regulatory framework, underdeveloped capital markets, lack of innovative financial instruments, and banking sectors that fail to exercise its role of intermediation. The financial systems in Africa are small both in absolute and relative terms (Becks et al., 2009). Particularly, the financial systems of Sub-Saharan African (SSA) countries (excluding South Africa) are the least developed when compared to other developing regions, and are dominated by traditional banking and informal finance practices. Africa’s financial systems lack the technological innovations needed to provide quality services (Allen et al., 2010). In 2011, the Global Financial Development Report recorded the number of ATM per 100,000 persons in SSA to be seven compared to approximately seventeen recorded for other developing countries.
However, in recent times, substantial changes have begun to take place in Africa’s financial system. Countries that mostly depended on the traditional banking system, recently (after the outbreak of the global financial crisis) started embracing the role of capital markets in the economy (Andrianaivo and Yartey, 2012). These improvements in Africa’s financial system are the results of extensive economic reforms that have taken place over the years. Also, the introduction of non-bank finance, particularly in the form of stock markets has increased across Africa leading to improved financial system operations (Africa Development Indicators Report
3The countries are: Botswana, Cote d’Ivoire, Egypt, Ghana, Kenya, Mauritius, Morocco, Nigeria, South Africa, Swaziland, Zambia and Zimbabwe.
11
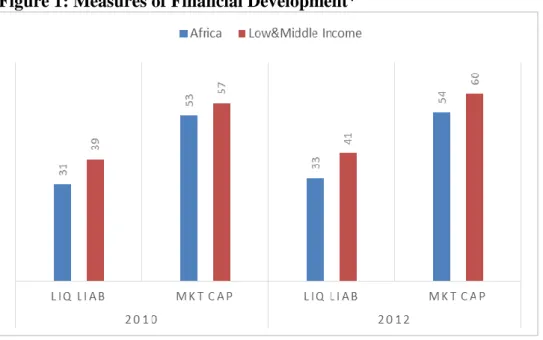
2013). Although, Africa’s financial systems have experienced improvements in both its capitalization (size) and trading activity its measures of financial development are still lower than other low and middle income countries as seen in the figure below. This implies that Africa still needs more improvement in its financial sector to be able to take advantage of the benefits derived from a balanced and developed financial system.
Figure 1: Measures of Financial Development4
Source: Author’s calculation using data from World Bank, Global Financial Development
2.2.1.1 Banking Systems in Africa
In the banking system, the main indicators of financial development are credit to the private sector and bank assets (IMF, 2005). Andrianaivo and Yartey (2012), highlights the difficulties involved in generalizing banking system development in Africa. This is because as stated above African countries differ, and do too regarding financial development and access to financial services (Andrianaivo and Yartey, 2012). However, some common features can be identified such as an increase in credit provided to the private sector and the measure of bank asset relative to GDP. Despite, the recorded improvement of Africa’s banking system, its financial depth indicators are still the lowest in the world (Andrianaivo and Yartey, 2012). While developed economies record an average of more than 100 percent for the credit to private sector, Africa records a little over 15% (Global Financial Development Indicators).
4LIQ LIAB represents Liquid liabilities (M3) as % of GDP.
MKT CAP represents Market capitalization of listed domestic companies (% of GDP).
This is calculated by adding the combined average values of Sub-Saharan African countries and the five Arab states. The low and middle income excludes all African countries.
12
Another common feature of the banking system in Africa is that a more significant number of banks invest in government securities, mainly treasury bills (Allen et al., 2010). This reflects a highly dysfunctional financial intermediary and could be worrisome because banks are more inclined to safer government securities and reject the provision of private credit (Allen et al., 2010). For this reason, banks in Africa record low levels of private credit provisions and development. Various African policy makers have recognised the dysfunctionality in the banking system and measures are being implemented to correct this defect. A functional banking system would provide an enabling environment that serves all economic agents and ensures the efficient allocation of resources by building information capital (Allen et al., 2010).
However, Nigeria and some Southern African countries like Malawi, Botswana, South Africa and the Seychelles already have banking systems that are well capitalized, dynamic and pursuing innovative banking practices (Allen et al., 2010). Particularly, the banking system of Seychelles is as highly sophisticated like those in most developed countries (Allen et al., 2010).
Figure 2: Domestic credit to Private sectors by banks (% of GDP) - Africa
Source: Allen et al., 2010
2.2.1.2 Stock Markets in Africa
In the last two decades there has been a significant increase in the number of stock markets in Africa. Presently 29 stock markets are in operation in Africa compared to twenty years ago when SSA and North Africa had only 5 and 3 stock markets respectively (Allen et al., 2010). The two oldest stock markets in Africa are in South Africa and Egypt and have been in existence since the 1880s, newer stock markets have experienced a market capitalization boom (Allen et al., 2010). In SSA, a regional stock exchange located in Abidjan was established. It serves the Francophone countries of West Africa. For Southern and Eastern Africa plans are in place to establish a similar regional market so as to consolidate their thinly capitalized markets
13
(Allen et al., 2010). Table 1 below shows that African markets turnover is improving when comparing 2007 and 2008 turnover ratios. These improvements are the result of development in regulatory and economic environments that have occurred in recent years. Also, the participation of foreign firms is increasing and African markets seem to be emerging towards a more developed system.
Table 1: Turnover as a % of GDP COUNTRY 2007 2008 % ∆ 2007‐2008 Botswana 0.9 0.6 -33% Egypt 41.4 57.57 39% Ghana 0.7 2.26 223% Kenya 4.5 3.62 -20% Mauritius 5.12 5.42 6% Morocco 41.9 29.65 -29% Namibia 3.7 18.74 406% Nigeria 28.2 7.79 -72% South Africa 52.5 63.1 20% Tanzania 0.1 0.15 50% Uganda 0.1 0.45 350% Zambia 0.6 1.55 158% Africa Mean 14.98 15.91 6% Africa Median 4.5 5.42 20% WFE Mean 96.6 101.5 5% EMERGING MARKETS Buenos Aires SE 8.9 7 -21% Bursa Malaysia 57.1 36 -37% Bombay SE 29.4 29 -1% Taiwan SE 153.3 145.5 -5% Istanbul SE 129.7 135.1 4% Amman SE 42.3 59.1 40% Singapore SE 77.6 63.7 -18% South Korea 196.3 192.6 -2%
Source: A comparative analysis of the performance of African Stock markets; Capital Market Authority
Notwithstanding the progress made, when compared to stock markets in other emerging markets, Africa’s stock markets are relatively small and are dominated by few large firms representing a high proportion of total market capitalization (Andrianaivo and Yartey, 2012). As seen in Table 2, with the exception of South Africa, Egypt, and Nigeria, all others have very few companies listed on the stock markets. More than 50 percent of the listed companies are located in South Africa and Egypt. Regarding market capitalization, the region is dominated by the Johannesburg stock exchange in South Africa. However, in recent times, rapid growth has been recorded in the Cairo and Alexandria Stock Exchange (CASE). Smaller stock exchanges lack the experience and resources required to issue new shares, preventing active
14
trading activities from institutional investors and minority government stockholders (Andrianaivo and Yartey, 2012).
Table 2: Number of Listed Companies
2006 2007 2008 2009 %∆ 2008-2009 Botswana 18 30 31 31 0.00% Cote d'Ivoire 40 40 40 40 0.00% Egypt 595 435 373 313 -16.09% Ghana 32 32 35 35 0.00% Kenya 52 54 56 55 -1.79% Mauritius 41 41 40 40 0.00% Malawi 11 13 15 15 0.00% Morocco 63 73 73 73 0.00% Namibia 28 27 29 29 0.00% Nigeria 202 212 213 216 1.41% South Africa 401 422 425 396 -6.82% Swaziland 6 6 5 5 0.00% Tanzania 10 10 14 15 7.14% Tunisia 48 48 50 52 4.00% Uganda 11 12 13 13 0.00% Zambia 16 17 19 21 10.53% Zimbabwe 83 85 90 96 6.67% Sudan 51 53 53 53 0.00% Mozambique 5 7 6 6 0.00% Libya 4 6 6 6 0.00% AFRICA TOTAL 1,717 1,623 1,586 1,510 -4.79% AFRICA MEAN 85.85 81.15 79.30 75.50 AFRICA MEDIAN 36 36 37.5 37.5 AFRICA % OF WFE 3.80% 3.49% 3.46% 3.33% WFE TOTAL 45,211 46,509 45,846 45,358 -1.06% EMERGING MARKETS Malaysia 1020 1027 976 959 -1.74% Mexico 151 131 373 406 8.85% Thailand 518 523 525 535 1.90% Chile 246 244 238 236 -0.84% Bombay SE 4796 4887 4921 4,955 0.69% Argentina 106 111 112 106 -5.36%
Source: A comparative analysis of the performance of African Stock markets; Capital Market Authority
Also, stock markets in Africa are illiquid and trading occurs mainly in the few stock markets that have the majority of market capitalization (Yartey and Adjasi, 2007). There is a large gap between the orders made for the purchase of shares and what is actually sold, because shares are rarely traded in most stock markets (Andrianaivo and Yartey, 2012). For example, in Swaziland the turnover ratio is 0.04 percent compared to Mexico with a turnover ratio of 31 percent. The effect of low liquidity leads to stock exchanges generating low business volume, making it difficult for them to support local markets with market analysis and its own trading systems (Andrianaivo and Yartey, 2012)
In summary, while it is recognized that African stock markets are improving, stock markets in Africa are still small and illiquid exposing them to various risk such as economic and political
15
instabilities, fluctuation in the value of currencies. These risk, if not hedged against can prevent further growth in Africa’s market (Allen et al., 2010).
2.2.2 Detailed Review of Selected Financial Systems
Due to data availability, twelve African countries are studied in this chapter. This section provides a review of the financial system of each country. The figures below show various indicators of financial development in years 1995 and 2011.5
Figure 3: Number of Listed Companies
Source: Author’s calculation using data from World Bank, Global Financial Development
Figure 4: Market Capitalization (% of GDP)
Source: Author’s calculation using data from World Bank, Global Financial Development
5 Note: these years are chosen randomly for comparison.
0 100 200 300 400 500 600 700 800 1995 [YR1995] 2011 [YR2011] 0 20 40 60 80 100 120 140 160 180 200 1995 [YR1995] 2011 [YR2011]
16
Figure 5: Domestic credit to Private sectors by banks (% of GDP) – Sample data
Source: Author’s calculation using data from World Bank, Global Financial Development
Figure 6: Domestic credit provided by the financial sector (% of GDP)
Source: Author’s calculation using data from World Bank, Global Financial Development
Figures 3 to 6 show that on average, these countries have experienced some form of financial development. For example, in Mauritius, domestic credit to private sectors increased from 43% to 91%. However, measures like market capitalization when compared to other developing countries, are still low for most countries in this study.
2.2.2.1 Botswana
Botswana’s banking sector has grown over the years and has become one of the most important sectors in the economy as it aids in the development of other sectors (Keith and Abo, 2010). In
0 10 20 30 40 50 60 70 80 90 100 1995 [YR1995] 2011 [YR2011] -50.00 0.00 50.00 100.00 150.00 200.00 1995 [YR1995] 2011 [YR2011]
17
the Botswana Stock market (BSE), the banking system dominates market capitalization and in recent years it has been the driving force for growth in the BSE. The Bank of Botswana (BOB) established in 1975, regulates and supervises the operations of the banking system. Figure 7 shows that for the period 1997 to 2007, an average growth rate of 21% for banking system asset was recorded, while the relative size of the economy - measured by nominal GDP recorded an average growth of 14%.
Figure 7: Size of Botswana’s Banks Relative to the Economy
Source: BOB; CSO; Econsult
Botswana’s stock market is at its embryonic stage. It was formally established in 1995 after operating informally as Botswana Share market for the period between 1989 and 1995. It remains relatively illiquid and small. In 2008, the market capitalization was estimated to be 35%, but reduced to 31% in 2012.
2.2.2.2 Cote d’Ivoire
Cote d’Ivoire’s primary financial sector is the banking system, and it is in an oligopolistic situation with few commercial banks controlling over 75% of the banking transactions. The banks are regulated by the Central Bank of West African States (BCEAO). It is located in Dakar, Senegal and is the only bank authorised to issue currency for the West African Economic and Monetary Union (WAEMU) member states. About 46.6% stake holdings are held by foreign investors in banking system, 33.4% held by private nationals and 20% is held by the government (Allen et al., 2010).
18
Until 1998, the Abidjan Stock Exchange was the only stock exchange in the francophone West African Countries. The Bourse Régionale des Valeurs Mobilières (BRVM) located in Abidjan was then formed to serve the WAEMU members6. A branch is located in the capital city of each member states. In Côte d'Ivoire market capitalization of listed companies (% of GDP) was 26.12% as of 2011. Its highest value over the past 23 years was 42.2% in 2007 while its lowest value was 3.75% in 1993.
Figure 8: Market Capitalization of listed companies (% of GDP) in Cote d’Ivoire
Source: Index Mundi
2.2.2.3Egypt
The banking system in Egypt is dominated by few large banks, which are mainly foreign banks. More than 60% of banking operations is accounted for by foreign banks. Forty banks are operating in Egypt and two-thirds of them are owned by foreigners either wholly or have majority stockholdings. Various reforms are taking place in the banking system and focuses on restructuring and selling off state-owned stockholdings to improve the quality of banks. Following the initiation of these reforms program, the banking system has recorded improvements as seen in Table 3.
6 Eight countries are members of the WAEMU region.
0 5 10 15 20 25 30 35 40 45 1985 1990 1995 2000 2005 2010 2015
19 Table 3: Banking System Indicators in Egypt
End of June 2007 2008 2009 2010 2011 2012
First : Domestic Credit 531314 570953 695326 775268 892766 1072566
Net claims on the government (A+B-C) 178323 174005 273122 326141 437337 578654
A- Securities 278011 271788 397804 440410 542792 677139
B- Credit facilities 52151 67732 55939 68139 98826 111362
C- Government deposits 151839 165515 180621 182408 204281 209847
Claims on public business sector 24446 26897 33146 29985 32981 40620
Claims on private business sector 268607 291719 304470 326350 323241 340865
Claims on household sector 59938 78332 84588 92792 99207 112427
Second : Other Items (Net) -87255 -107969 -118249 -140217 -136855 -135782
Capital accounts+ -114534 -135401 -148332 -170877 -146543 -168778
Net unclassified assets and liabilities 27279 27432 30083 30660 9688 32996
Source: Central Bank of Egypt, Annual Report
The stock market in Egypt is one of the oldest in Africa and the world. It is called the Cairo and Alexandria stock exchange (CASE) and began operations in 1885 as the Alexandria futures market. In the over-the-counter market (OTC) de-listed and low securities are traded. There has been in a decline of about 16% in the number of companies listed on the stock exchange from 596 in 2006 to 313 in 2009 (Table 2). Despite the decrease, the turnover ratio still increased from 41.4% in 2007 to 51.6% in 2008 as seen in Table 1. At the moment, the Egyptian stock market is in the process of transitioning to a fully automated trading system (Allen et al., 2010).
2.2.2.4Ghana
The banking system in Ghana is made up of three separate areas, namely: the Central Bank, Commercial/Universal Banks, and Rural/Community Banks (Allen et al., 2010). As at 2013, there were 29 commercial banks in Ghana and foreign banks accounted for more than 75% of bank ownerships. Recent competition from Nigerians banks has reduced the market share of
20
the previously top three banks7. A stated capital of not less than GHc60 million is required from banks operating in Ghana by the new regulation of Bank of Ghana. Ghana currently has 129 rural banks serving the rural communities and are regulated by the ARB Apex Bank.
Table 4: Structure of Ghana’s financial system
Source: IMF Country Report; Ghana: Financial System Stability Assessment Update
In 1990, the Ghana stock exchange (GSE) started operation and as of the end of 2013, the number of listed companies was 34, with a market capitalization of GHc 61,158 million. The GSE is highly concentration, 95% of the total market capitalization is held by the top 10 firms while 81% of market capitalization is held by the top 3 firms listed on the stock exchange (Allen et al., 2010).
2.2.2.5Kenya
The financial system in Kenya is relatively well developed when compared to others in the region (Beck and Fuchs, 2004). As at 2012, Kenya had 43 commercial banks, and the size of assets was Ksh. 2.2 trillion (equivalent to $2.2 billion). The banks are regulated by the Central Bank of Kenya established shortly after independence. Several structural adjustment programs have taken place leading to the privatization of government-owned banks. Reports by the
7Barclays Bank, Standard Chartered Bank and Ghana Commercial Bank
Dec-00 Dec-05 Dec-09 Dec-10
Number Percent of Total Assets Number Percent of Total Assets Number Percent of Total Assets Number Percent of Total Assets
Commercial Banks 16 76.9 20 70.5 26 75.1 26 75.1
Private 10 39.2 15 42.5 21 52.4 21 53.4
Domestic 5 4 6 8 8 12.7 8 15.1
Foreign 5 35.2 9 34.6 13 39.8 13 38.3
State-Owned 1/ 6 37.7 5 28 5 22.6 5 21.7
Rural and Community Banks 113 2 121 4.3 134 3.3 135 2.7
Other Banking and Quasi Banking Institutions 33 3.9 34 4.7 46 5 47 4.6
Savings and Loan companies 8 0.2 12 1 18 1.6 19 1.8
Mortgage Finance Companies 1 1.4 0 0 1 0.3 1 0.3
Leasing and Finance Houses 21 1.2 20 2.3 27 3 27 2.5
Discount Houses 3 1.1 2 1.4 0 0 0 0
Nonbank Financial Institutions 57 17.2 80 20.6 113 16.6 134 17.5
Insurance companies 22 ... 26 2.8 42 3.9 42 3.6 Life insurance 2 ... 5 ... 17 1.3 17 1.3 Non-life insurance 18 ... 19 ... 23 2.5 23 2.3 Reinsurance 2 0 2 ... 2 0 2 0 Pension funds ... 12.5 ... 17.8 ... 12.7 ... 12.4 SSNIT 2 ... 12.5 ... ... 12.7 ... 11.8 Other Public ... ... ... ... ... 0 ... ... Private ... ... ... ... ... 0 ... ... Securities Industry 35 ... 54 ... 71 0 92 1.5 Broker-dealers 14 ... 18 ... 22 ... 21 0.3 Investment advisors 17 ... 28 ... 39 ... 52 1.2 Custodians - ... 3 ... 4 ... 12 ... Trustees - ... 2 ... 2 ... 3 ...
21
central bank showed that the financial sector is developing faster than the overall economy. It grew by 9.0% in 2010 and 7.8% in 2011, while the economy grew by 5.8% and 4.4% in 2010 and 2011 respectively (Central Bank of Kenya, quarterly report 2012).21,713,580,528.92
Table 5: Kenya’s Banking System Compared to Others (%)
Private Credit/GDP Financial Deposits/GDP Bank Concentration8
Kenya 25.6 33.2 39.3
Sub-Saharan Africa 18.7 23.5 77.0
Low-income countries 16.0 19.5 74.2
OECD countries 92.6 113.5 47.9
Source: Beck and Fuchs (2004)
Kenya’s stock market - The Nairobi stock exchange was formed in 1954 and is the oldest and most active stock exchange in the central African region. Regarding volume, it is the 4th largest in Africa and the 5th largest in terms of market capitalization (Allen et al., 2010). It is also the only market in the region that has an index.
2.2.2.6Mauritius
At independence, Mauritius inherited a bank-dominated financial system and was quite developed with 11 banks. The banking system in Mauritius is highly concentrated with two long-established domestic and two international banking groups dominating the banking sector. Presently, there are 19 commercial banks and 14 nonbank deposit-taking institutions in Mauritius (IMF, 2008). The Bank of Mauritius regulates the operations of the banks and recently the quality of banking supervision has improved significantly with higher standards than in most African countries.
As is common for small countries, the stock markets are quite shallow. However, in recent years, it has experienced some level of growth. The Stock Exchange of Mauritius (SEM) is marginally profitable. According to IMF report (2008), the SEM replaced the OTC market with the Development Enterprise Market, this would enhance transparency and disclosure for smaller firms.
2.2.2.7Morocco
In Morocco, the banking system plays a major role. From 2005, credit to the private sector has increased by 18 percent per year and at the end of 2007, it was equal to 66 percent of GDP (compared to 12 percent in Algeria, 61 percent in Tunisia, and 75 percent in Lebanon) (IMF country report, 2008). It recorded an increase in the size of asset (% of GDP) from 81 percent
22
in 2003 to 109 percent in 2007. The number of privately owned banks is six, foreigners have major stakes in five banks, and five are publicly owned (IMF country report, 2008). Foreign-owned banks held 14 percent of financial sector assets and 21 percent of banking system assets at the end of 2006. The government continues to control directly or indirectly about 23 percent of the banking sector, down from 40 percent in 2002. The banking system is concentrated and controlled by six of the largest banks that hold up to 85% of the assets (Table 6).
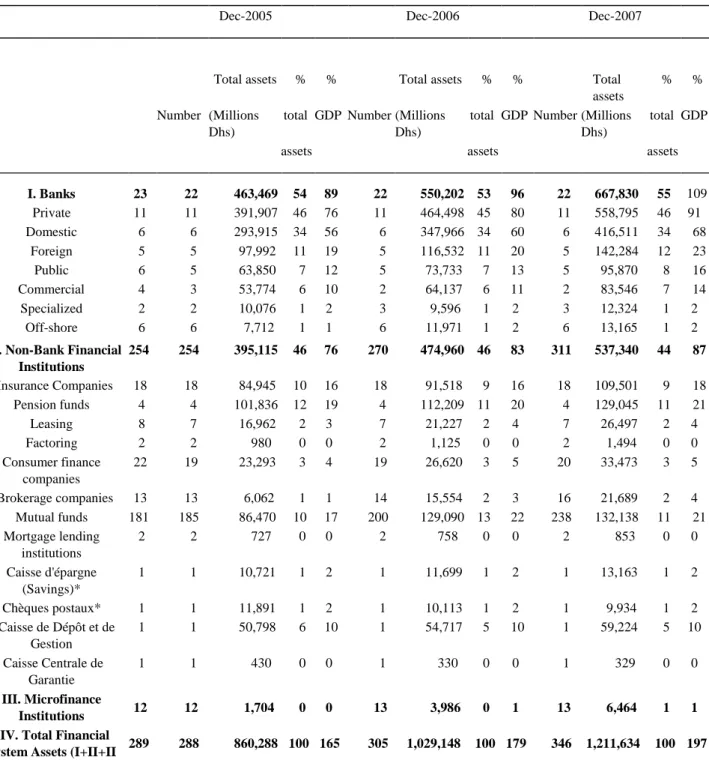
Table 6: Structure of Morocco’s financial system, 2005-2007
Dec-2005 Dec-2006 Dec-2007
Total assets % % Total assets % % Total assets
% %
Number (Millions Dhs)
total GDP Number (Millions Dhs)
total GDP Number (Millions Dhs)
total GDP
assets assets assets
I. Banks 23 22 463,469 54 89 22 550,202 53 96 22 667,830 55 109 Private 11 11 391,907 46 76 11 464,498 45 80 11 558,795 46 91 Domestic 6 6 293,915 34 56 6 347,966 34 60 6 416,511 34 68 Foreign 5 5 97,992 11 19 5 116,532 11 20 5 142,284 12 23 Public 6 5 63,850 7 12 5 73,733 7 13 5 95,870 8 16 Commercial 4 3 53,774 6 10 2 64,137 6 11 2 83,546 7 14 Specialized 2 2 10,076 1 2 3 9,596 1 2 3 12,324 1 2 Off-shore 6 6 7,712 1 1 6 11,971 1 2 6 13,165 1 2
II. Non-Bank Financial Institutions 254 254 395,115 46 76 270 474,960 46 83 311 537,340 44 87 Insurance Companies 18 18 84,945 10 16 18 91,518 9 16 18 109,501 9 18 Pension funds 4 4 101,836 12 19 4 112,209 11 20 4 129,045 11 21 Leasing 8 7 16,962 2 3 7 21,227 2 4 7 26,497 2 4 Factoring 2 2 980 0 0 2 1,125 0 0 2 1,494 0 0 Consumer finance companies 22 19 23,293 3 4 19 26,620 3 5 20 33,473 3 5 Brokerage companies 13 13 6,062 1 1 14 15,554 2 3 16 21,689 2 4 Mutual funds 181 185 86,470 10 17 200 129,090 13 22 238 132,138 11 21 Mortgage lending institutions 2 2 727 0 0 2 758 0 0 2 853 0 0 Caisse d'épargne (Savings)* 1 1 10,721 1 2 1 11,699 1 2 1 13,163 1 2 Chèques postaux* 1 1 11,891 1 2 1 10,113 1 2 1 9,934 1 2 Caisse de Dépôt et de Gestion 1 1 50,798 6 10 1 54,717 5 10 1 59,224 5 10 Caisse Centrale de Garantie 1 1 430 0 0 1 330 0 0 1 329 0 0 III. Microfinance Institutions 12 12 1,704 0 0 13 3,986 0 1 13 6,464 1 1
IV. Total Financial
System Assets (I+II+II 289 288 860,288 100 165 305 1,029,148 100 179 346 1,211,634 100 197
23
Morocco’s stock market - the Casablanca Stock Exchange (CSE) is relatively developed and has 77 companies listed on it. In 2008, the total traded volume in the CSE was MAD 217.7 billion (approx. US$25.6 billion). However, the rate of foreign investment in the CSE is low even though there are no restrictions on foreign ownership of Moroccan companies (Allen et al., 2010). On the CSE trading volume as a fraction of capitalization is 40.9%, while trading volume as a fraction of GDP it is 158.4% (Allen et al., 2010).
2.2.2.8Nigeria
The Central Bank of Nigeria (CBN) started operations in 1959 and controls the operations of the monetary and financial sector in Nigeria. Nigeria’s financial system faces the problem of weak governance, and this includes non-transparent ownership structures, deficiencies in financial reporting, and widespread perceptions of corruption. According to IMF report (2013), the failures and extreme undercapitalization of some banks emphasized these weaknesses leading to the consolidation of the banking sector from 89 banks in 2005 to 20 in 2012. However, Nigeria’s financial system is experiencing fast growth and has become more integrated with both regional and global financial systems. 61 percent of GDP was attributed to the gross financial system asset in 2011. Presently, 20 banks are operating in Nigeria. However, the banking system is dominated by 6 of them who accounted for about 60 percent of total banking sector assets, and only 4 percent of total banking asset is held by European banks (IMF country report, 2013). In general, the Nigerian banking system seems to be well capitalized, liquid, and profitable.
Figure 9: Financial soundness Indicators in Nigeria
Source: IMF, 2013 Nigeria: Financial Sector Stability Assessment -1.0 -0.5 0.0 0.5 1.0 1.5 2.0 Return of Assets System Average Weak Banks Rest of Banks -10.0 -5.0 0.0 5.0 10.0 15.0 Return on Equity System Average Weak Banks Rest of Banks
24
In 1960, the Lagos Stock Exchange was established and is currently the most liquid stock exchange in the West African region (Allen et al., 2010). It was later renamed the Nigeria Stock Exchange (NSE) in 1977 and has eight branches across the country. However, it remained relatively small and recorded a decrease in market capitalization (% of GDP) from 30% in 2008 to 12% in 2012. (IMF country report, 2013). Nigeria stock exchange is highly concentrated with the 10 largest companies accounting for over 75% of the market share.
2.2.2.9South Africa
The financial system in South Africa is more sophisticated than other African countries. It comprises of well-established capital and stock markets, insurance companies, and pension funds (IMF country report, 2008). South Africa’s financial system has been able to overcome the challenges posed by the global financial crises without any major effect on its operations.
Table 7: Financial Soundness Indicator in South Africa. 2002-2007
2002 2003 2004 2005 2006 2007 (Percent, unless otherwise indicated) Capital adequacy:
Regulatory capital to risk-weighted assets 1 12.6 12.4 14.0 12.7 12.3 12.8
Regulatory tier 1 capital to risk-weighted assets 1 8.7 8.9 10.5 9.7 9.0 9.5
Asset quality:
Nonperforming loans to total gross loans 2 2.9 2.4 1.8 1.5 1.1 1.4
Nonperforming loans net of provisions to capital 2 13.2 8.5 6.2 6.4 5.6 8.2
Share of mortgage advances in domestic private credit 3 40.7 39.6 43.3 46.2 47.7 48.9
Earnings and profitability:
Return on assets (average) 0.4 0.8 1.3 1.2 1.4 1.4
Return on equity (average) 5.4 11.6 16.2 15.2 18.3 18.1
Interest margin to gross income 52.3 38.3 41.6 38.2 43.8 58.5
Noninterest expenses to gross income 60.4 74.8 68.5 61.5 48.5 48.9
Liquidity:
Liquid assets to total assets 4.7 4.7 4.7 4.8 4.6 4.6
Share of short-term deposits in total deposits 47.9 45.7 43.7 43.5 42.8 42.5 Exposure to FX risk:
Maximum effective net open FX position to capital 3.6 1.3 0.8 1.9 1.4 0.7 Share of foreign currency loans in total lending 13.6 11.9 10.9 11.1 11.4 9.3 Share of foreign currency deposits in total deposits 4 4.4 2.7 2.7 2.7 3.3 3.0
Share of foreign liabilities in total liabilities 5 6.3 3.8 4.0 4.2 5.3 6.0
Source: IMF country report, 2008. South Africa:Financial System Stability Assessment
1Total (banking and trading book).
2The official definition of nonperforming loans comprises doubtful and loss loans. Doubtful are loans overdue for 180
days unless well secured, or with a timely realization of the collateral.
3Domestic private credit not seasonally adjusted. 4Foreign funding to total funding.
5Foreign funding to total liabilities (including capital).
25
The commercial banks are the largest and most important component of the financial system in South Africa, with their assets equivalent to 120 percent of GDP. However, the banking system is highly concentrated with only four9 banks accounting for almost 85 percent of total assets and have substantial international presence (IMF country report, 2008). Also, the presence of foreign banks has increased significantly in South Africa. In 2005, Barclays took over as the major shareholder in ABSA and the Industrial and Commercial Bank of China’s (ICBCs) acquired 20 percent stake in Standard Bank at the end of 2007 (IMF country report, 2008).
The Johannesburg Stock Exchange (JSE) is the premier and most sophisticated stock exchange in Africa comparable to stock markets in developed countries (Allen et al., 2010). The JSE market capitalization is the largest among emerging markets and is reflected in the inclusion of South Africa in major investable global stock market indexes (IMF country report, 2008). Trading transaction in JSE is carried out using an upgraded technology system- the London Stock Exchange’s TradElectTM (Allen et al., 2010). In 2007, the average number of daily trade recorded was 46,216, and a total number of 99,959 has been registered on the futures closing date (Allen et al., 2010).
2.2.2.10 Swaziland
The financial system in Swaziland is small and not very well diversified and developed. There are currently four authorized commercial banks in the country and are regulated by the Central Bank of Swaziland. However, banks have been affected adversely from lending to a narrow corporate client base and have become shallower. Since 1995, there has been a reduction in the private sector lending, money supply, and bank deposits as a percentage of GDP (Allen et al., 2010). The nonbank financial institutions (NBFIs) were developed to fill the financial needs not met by the banks. Nonetheless, they are not regulated and supervised adequately. The NBIFs focuses on rural/non-steady income citizens that do not have access to banking services. There were 266 NBIFs at the end of 2007 in Swaziland. In 1991, the Swaziland Stock Exchange (SSX) was established and remains relatively inactive. There are only five companies listed on the stock exchange in Swaziland.