University
of
Cape
Town
Loan Growth and Risk:
Evidence from Microfinance Institutions in Africa
Eliud Dismas Moyi
Thesis Presented for the Degree of
Doctor of Philosophy
in Economics
School of Economics
University of Cape Town
Supervisor
Professor Eftychia Nikolaidou
University
of
Cape
Town
The copyright of this thesis vests in the author. No
quotation from it or information derived from it is to be
published without full acknowledgement of the source.
The thesis is to be used for private study or
non-commercial research purposes only.
Published by the University of Cape Town (UCT) in terms
of the non-exclusive license granted to UCT by the author.
i
Declaration
I declare that this thesis is my own work, except where acknowledged in the text. I further declare that this thesis has not been submitted for a degree at any other university.
Eliud Dismas Moyi
--- Signature
10th January 2019
ii
Abstract
Microfinance markets in Sub-Saharan Africa (SSA) have experienced remarkable growth, particularly after the early 2000s. Since microfinance institutions (MFIs) provide financial services such as loans, savings and insurance to poor clients who face exclusion from formal financial institutions, they are considered as one of the most prolific tools to alleviate poverty and achieve financial inclusion in developing countries. These institutions are of particular importance in SSA, given that the region has the highest poverty levels in the world and the highest levels of financial exclusion. However, in recent years the fast loan growth of MFIs has been accompanied increasingly by loan delinquencies which threaten the financial health of these institutions. This is a major concern for policymakers, regulators and practitioners given the developmental importance of microfinance in the region. Despite the pivotal role of microfinance, there is only a very limited number of studies that either investigate the underlying reasons for the fast growth of MFIs or that identify the determinants of credit risk in MFIs in this particular region of Africa.
Motivated by both the remarkable loan growth and the rising credit risk that MFIs experienced and the fact that SSA has been neglected in the relevant literature, this thesis provides evidence from the region on the factors that contribute to MFIs’ growth, the determinants of MFIs’ credit risk as well as the factors that influence access to MFIs credit. The latter pays particular attention to the effect of mobile financial services (MFS) on borrowing from MFIs, an aspect that has been ignored in previous scholarly work. Furthermore, the thesis overcomes the limitations of previous studies that employed static regressions, which are limited in dealing with panel endogeneity bias, by focusing on the dynamic aspects of loan growth and credit risk.
The thesis is structured around three related studies that are presented in three chapters, namely Chapter 2, Chapter 3 and Chapter 4. The purpose of the second chapter is to identify the factors
iii
that explain variations in loan growth in the region’s MFIs. This is an important issue as high loan growth may pose significant stability risks in the microfinance sector via a deterioration in portfolio quality. The chapter applies two-step system generalised method of moments estimators on data for 34 countries in SSA over the period 2004 - 2014. The results show that loan growth is higher in MFIs that have lower risk exposure, higher capital asset ratios and already recording high growth. Similarly, loan growth is higher in countries with better economic prospects, and in those with sound private sector policies and regulations. Against expectations, loan growth is faster in countries with poor legal rights of borrowers and lenders.
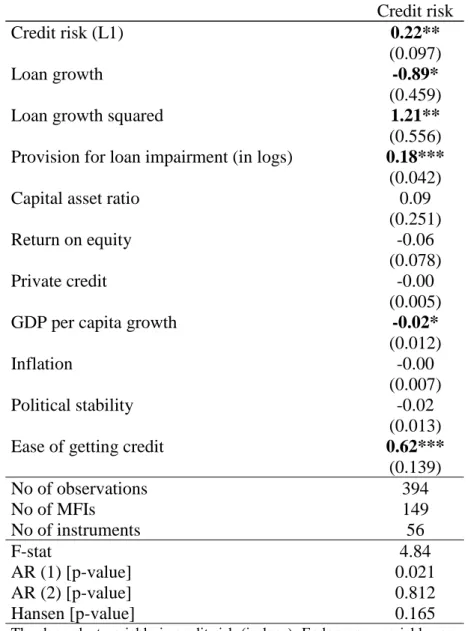
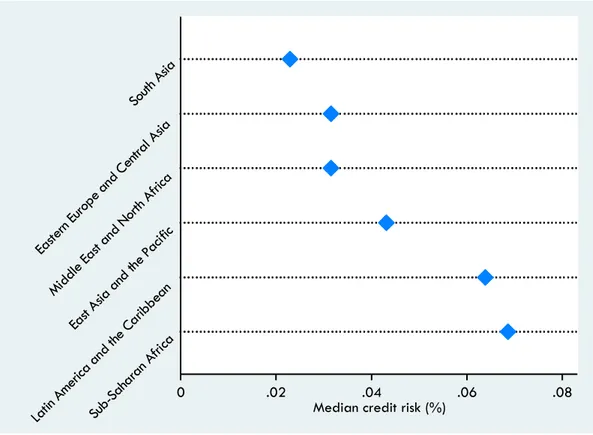
Credit risk in microfinance institutions in SSA has been rising, and the financial health of these institutions remains an issue of concern. Hence, Chapter 3 examines the factors that explain variations in credit risk in MFIs in the region. Similarly, the chapter employs a system GMM approach on data for 34 countries in SSA over the period 2004 – 2014. Results suggest that the main predictors of credit risk in SSA are lagged credit risk, loan growth, provisions for loan impairment, GDP per capita growth and ease of getting credit. In addition, the study identifies threshold effects in the relationship between credit risk and loan growth. Credit risk falls with loan growth until a trough at 36.8% when this relationship is reversed. On the regional scale, comparisons suggest that credit risk is most persistent in East Asia and the Pacific but least persistent in SSA.
Relatively few scholarly works have analysed the influence of mobile financial services (MFS) on access to credit. Chapter 4 aims to identify the factors that explain the differences in the propensity to use loans from MFIs in Kenya, paying particular attention to the effects of mobile money (M-money), mobile banking (M-banking) and mobile credit (M-credit). Kenya is an interesting case study because the country outperforms other SSA countries in terms of financial and digital inclusion. The study applies a probit model using FinAccess cross
iv
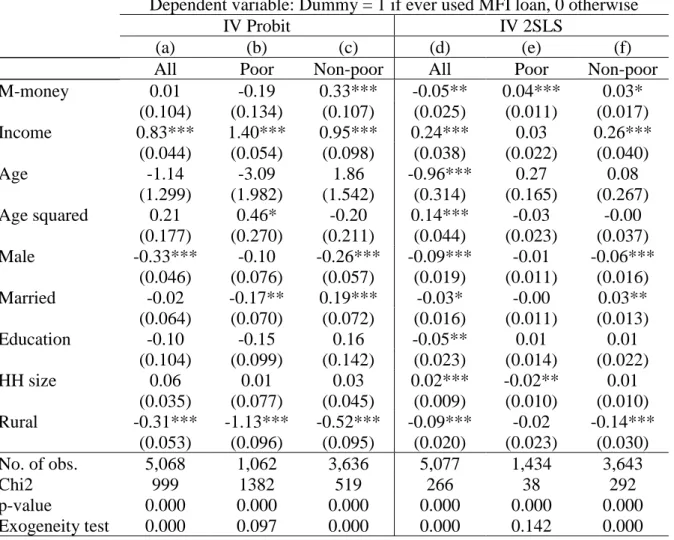
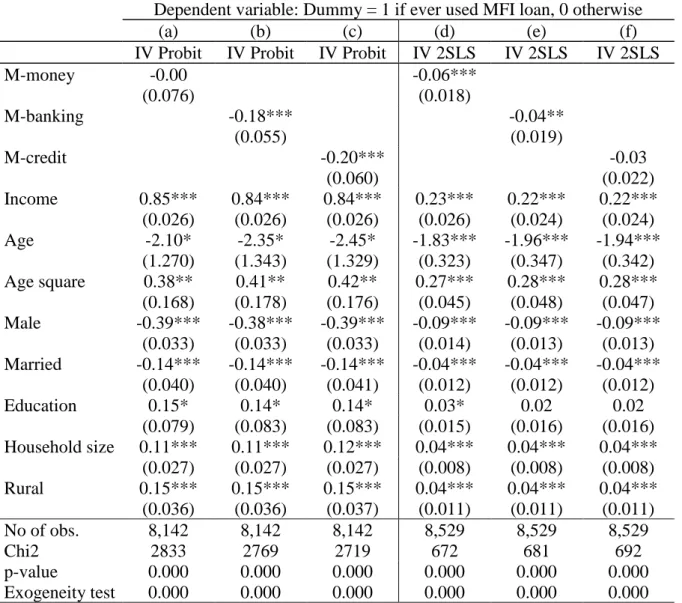
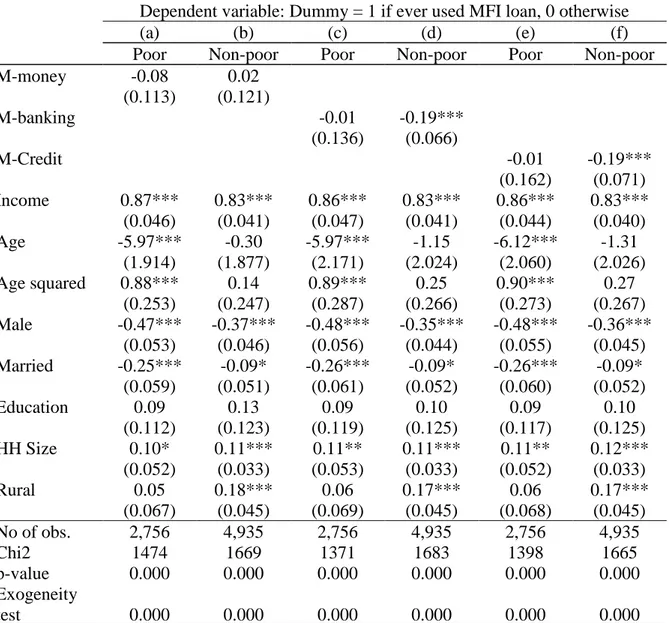
sectional data that was collected in 2013 (N=6112) and 2015 (N=8665). After addressing endogeneity concerns in the data, the 2013 results suggest that the factors that make a significant difference in the likelihood of using MFI credit include income, gender and type of cluster. An important observation is that non-poor users of M-money are more likely to use microcredit. The 2015 results show that the likelihood of using MFI credit is lower among those using M-banking and M-credit as well as among males and married persons. However, higher income, being educated, higher household size and being located in a rural cluster are associated with a higher propensity to use MFI credit. In addition, the results suggest a U-shaped relationship between age and the probability to use MFI credit. Similarly, the negative relationship between the likelihood of using MFI credit and using M-banking and M-credit suggests that the introduction of MFS in the financial sector has resulted in the migration of clients from microfinance products towards mobile-based financial services.
In terms of policy, two recommendations stand out. Firstly, since dynamics matter for both loan growth and credit risk, credit management strategies that incorporate past risk and loan performance are likely to be more effective. Secondly, the evident trade-offs between loan growth and credit risk confirm the fact that modest loan growth is not the source of instability within the region’s microfinance sector. However, the presence of threshold effects suggests that MFIs should determine the turning points for lending growth because excessive growth in loans can be perilous to the existence of the institution itself, and the sector by extension.
v
Dedication
vi
Acknowledgements
As the adage goes, every long journey begins with one step. My PhD journey, which started in January 2014 was not an entirely pleasant experience. The five-year period of coursework and research was not a piece of cake. It started with all odds against my successful completion of the PhD. The first two years turned out to be the toughest. Three staggering blows filled this journey with pain. I had to spent time shuffling between nursing a sick wife and a gruelling coursework whilst I was not on salary. I lost my wife in 2015 and everything seemed to fall apart. I was left devastated and heartbroken. Though this was a season of tears, sorrow and pain, it was also the season that gave me the opportunity to become more human, humble and strong. As the psalmist writes in Chapter 124 verses 1 and 3 “If it had not been the Lord who was on our side, now may Israel say; If it had not been the Lord who was on our side, when men rose up against us:Then they would have swallowed us up quick, when their wrath was kindled against us”. By His grace, God kept me strong. By His righteous right hand, he gave me comfort and through His Word He sharpened my focus.
This thesis is a product of the labours of many people as well as the resources of many organisations. I will never forget the labours of my supervisor, my kindred and my friends. I will ever be grateful to my employer, KIPPRA, the Government of Kenya, African Economic Research Consortium (AERC) and United Nations University World Institute of Development Economics Research (UNU-WIDER).
My supervisor, Professor Eftychia Nikolaidou, stands out as the main motivator of this project. She painstakingly walked with me during the 3 years of conceptualising the research topic and writing the thesis. Without her commitment, zeal and encouragement, this thesis would never have seen the light of day. My kindred inspired me to undertake this faith project. They
vii
provided the much needed spiritual fuel and emotional warmth that fired my never satiated inner man. I thank my sister Ms. Hellen Okaalo and Ms. Priscilla Ong’ayo and my brothers Mr. Okaalo Dobi and Mr. Peter Okaalo for their labors. My friends and brothers in Christ, Mr. Samwel Addo and Mr. James Gichuki, held my hands when the fire was too hot. They also proofread portions of my thesis. For these endeavours, I’ll be forever grateful.
My PhD scholarship was funded by the Government of Kenya through the African Economic Research Consortium. I gratefully acknowledge the team at AERC who ably coordinated the numerous PhD programme activities including disbursement of my stipend, organization of the research review workshops held in Nairobi (June 2016) and Johannesburg (June 2017) (where I presented the PhD research proposal and the work-in-progress) and the Joint Facility for Electives held in Arusha, Tanzania. My employer, The Kenya Institute for Public Policy Research and Analysis (KIPPRA), gave me the four-year study leave that enabled me to travel to the University of Cape Town for my studies.
During this PhD journey, I applied for a United Nations University World Institute for Development Economics Research (UNU-WIDER) PhD fellowship in 2016. I was awarded the fellowship, which funded my 3 months (April to June 2017) sojourn at the UNU-WIDER headquarters in Helsinki, Finland. During my stay at UNU-WIDER, the technical reviews with my fellow interns and research fellows enriched chapter 3 of my thesis particularly through the comments I received during the internal seminar held at the Institute as well as the technical input of my mentor, Dr Kyle McNabb.
viii
List of abbreviations
AMFI Association of Microfinance Institutions ASCA Accumulating Savings and Credit Association
AR Auto Regressive
CEMAC Economic and Monetary Community of Central Africa CPI Consumer Price Index
EAP Eastern Asia and the Pacific EECA Eastern Europe and Central Asia FDI Foreign Direct Investment FI Financial Intermediary GDP Gross Domestic Product
GMM Generalised Method of Moments GNI Gross National Income
HHI Herfindahl -Hirschman Index IV Instrumental Variable
LAC Latin America and the Caribbean M3 Broad money supply
MFS Mobile Financial Services MFI Microfinance Institution MENA Middle East and North Africa MIX Microfinance Information eXchange M-Banking Mobile Banking
M-Credit Mobile Credit M-PESA Mobile Money
NASSEP National Sample Survey and Evaluation Programme NGO Non-Government Organisation
ix
NPV Net Present Value OLS Ordinary Least Squares
SA South Asia
SACCO Savings and Credit Cooperative Associations SME Small and Medium Enterprise
SSA Sub-Saharan Africa
TGA Temporary Government Administration TSLS Two Stage Least Squares
USAID United States Agency for International Development USD United States Dollar
WAEMU West African Economic Monetary Union WDI World Development Indicators
x
Contents
Declaration ... i Abstract ... ii Dedication ... v Acknowledgements ... viList of abbreviations ... viii
List of tables and figures ... xiii
Chapter 1 ... 1
Introduction ... 1
1.1 Introduction ... 1
1.2 Why Focus on Sub-Saharan Africa? ... 7
1.3 Structure of the Thesis... 8
Chapter 2 ... 9
Determinants of Loan Growth in Microfinance Institutions: The Case of Sub-Saharan Africa and Comparisons with other Regions of the World ... 9
2.1 Introduction ... 9
2.2 Literature Review ... 12
2.2.1 Theoretical Literature... 12
2.2.2 Empirical Literature ... 16
2.3 Methodology and Data ... 21
2.3.1 Model Specification ... 21
2.3.2 Data Description and Sources ... 23
2.3.3 Definition and Measurement of Variables ... 24
2.4 Empirical Results ... 28
2.4.1 Descriptive Statistics ... 28
2.4.2 Regression Results ... 30
xi
Chapter 3 ... 39
Determinants of Credit Risk in Sub-Saharan Africa Microfinance Institutions ... 39
3.1 Introduction ... 39 3.2 Literature Review ... 42 3.2.1 Theoretical Literature... 42 3.2.2 Empirical Literature ... 46 3.3 Methodology ... 52 3.3.1 Model Specification ... 52
3.3.2 Data Type and Sources ... 53
3.3.3 Definition and Measurement of Variables ... 54
3.4 Empirical Results ... 56
3.4.1 Descriptive Statistics ... 56
3.4.2 Regression Results ... 58
3.5 Conclusion and Policy Recommendations ... 65
Chapter 4 ... 67
Factors Influencing Households’ Access to MFI Credit in Kenya ... 67
4.1 Introduction ... 67
4.2 Structure of the Credit Market in Kenya ... 70
4.3 Literature Review ... 74
4.3.1 Theoretical Literature... 74
4.3.2 Empirical Literature ... 79
4.4 Methodology ... 85
4.4.1 Data Type and Sources ... 85
4.4.2 Model Specification ... 86
4.4.3 Definition of Variables ... 89
4.5 Empirical Results ... 90
4.5.1 Descriptive Statistics ... 90
4.5.2 Regression Results ... 91
4.6 Conclusion and Policy Recommendations ... 102
xii
Conclusion ... 105 References ... 111 Appendix ... 128
xiii
List of tables and figures
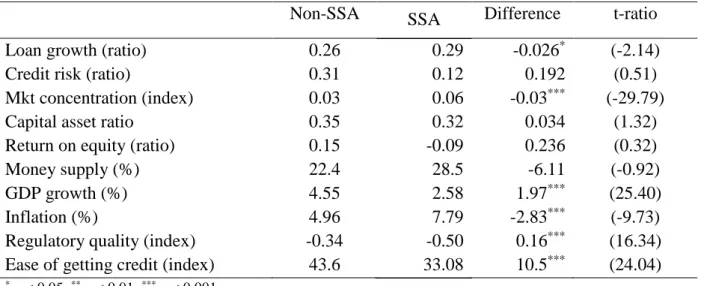
Table 1: Comparisons – SSA and non-SSA 29
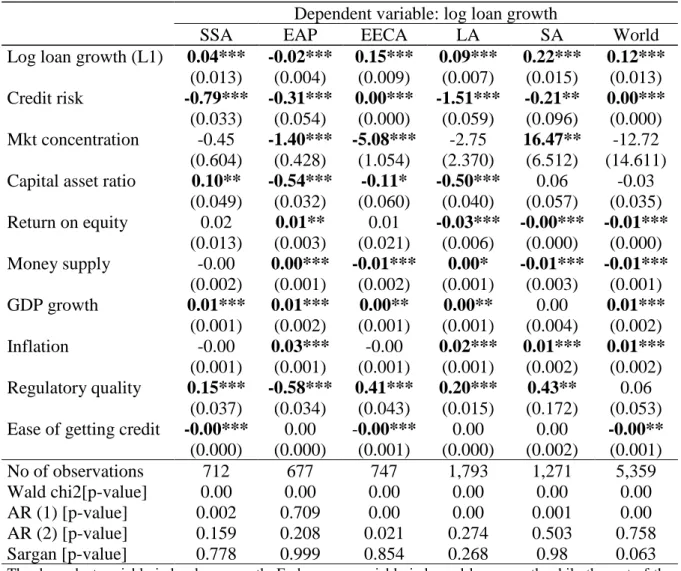
Table 2: Determinants of loan growth in SSA – Baseline results 31 Table 3: Determinants of loan growth – International comparisons 35
Table 4: Comparisons of means – SSA and non-SSA 58
Table 5: Credit risk determinants in SSA: Baseline results 60
Table 6: Credit risk determinants – SSA vs non-SSA 63
Table 7: Sources of Credit in Kenya 71
Table 8: IV estimates of the probability of using MFI credit (2013) 94 Table 9: Estimates of the probability of using MFI credit (2015) – Baseline results 97 Table 10: IV Probit estimates of the probability of using MFI credit by poverty status (2015) 101
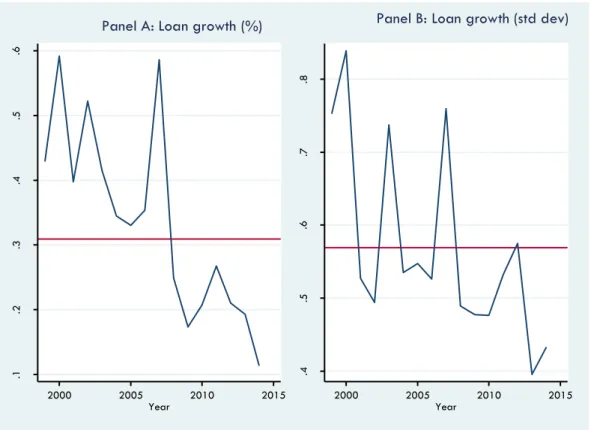
Figure A1: Gross loan portfolio - growth and variability 128
Figure A2: Credit risk and it's variability 129
Figure A3: Global distribution of credit risk (2000-2014) 130
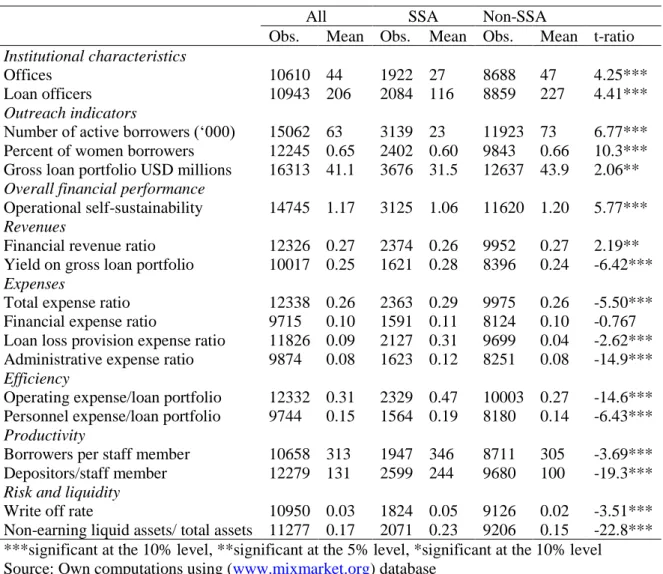
Table A1: Selected indicators of microfinance outreach 131
Table A2: A comparison of selected MFI indicators in SSA and Non-SSA (2000 – 2014) 132
Table A3: Sample countries 133
Table A4: Cross-country specific variables (averages for 2004 – 2014) 134
Table A5: Descriptive statistics 135
Table A6: Correlation matrix 135
Table A7: Descriptive statistics 136
Table A8: Correlation matrix 136
Table A9: Credit risk determinants in SSA, alternative specifications 137 Table A10: Summary statistics of the variables used in the regressions 138
Table A11: Correlation matrix (2015, N=8665) 139
Table A12: Correlation matrix (2013, N=6112) 139
1
Chapter
1
Introduction
1.1 Introduction
Broadly, the concept of microfinance encompasses the provision of credit plus the accumulation of savings and other financial services, including the supply of insurance policies, in lesser amounts to cater for poor clients, who are conventionally believed to lack the capacity to access the formal financial institutions (Dichter, 2007; Onyuma and Shem, 2005). Since microfinance targets the “bottom of the pyramid”, it has been viewed as one of the most prolific tools for alleviating poverty and achieving financial inclusion in developing countries (Triki and Faye, 2013). This is because microfinance offers not only financial services but also add-ons that develop sectors such as education, nutrition, health and also build entrepreneurial skills.
Microfinance markets in Sub-Saharan Africa (SSA) have witnessed remarkable growth, particularly after the 2000s. Their gross loan portfolio grew by about 23 times between 2000 and 2014, which represents an annual median growth rate of 25% per annum (see Appendix Table A1). During the same period, the number of active borrowers expanded by about 5 times representing an annual median growth rate of 18%. Assets of the sector have mushroomed by a factor of 27 while the number of depositors grew from 773,000 in 2000 to 14.8 million in 2014, representing an annual median growth of 22.7%.
Between 2000 and 2007, median annual growth in gross loan portfolio and assets in SSA was 36.8% and 38.2%, respectively. Over this period, the number of borrowers and depositors grew annually by 24% and 25.2% respectively. Although these growth patterns slowed down in the
2
2008-2014 period, partly due to the adverse effects of the global financial crisis (Wagner and Winkler, 2013), there have been concerns among development practitioners and regulators (Shankar and Asher, 2010) regarding this rapid expansion in microfinance markets. Sceptics wonder whether this rapid growth is truly beneficial (Wichterich, 2012) and whether this growth is too fast (Gonzalez, 2010). Moreover, there are fears that such growth may not be sustainable in the medium term and may pose significant risks to the stability of the financial sector via a deterioration in portfolio quality (or an increase in non-performing loans). This last concern is consistent with real business cycle theory which associates episodes of credit booms with overheating of financial markets, which eventually end up as financial crises (Elekdag and Wu, 2011).
Fears that fast loan growth in microfinance markets could be harmful to the stability of the sector have arisen from episodes of increasing loan default rates. Credit risk is usually reflected as an increase in non-performing loans and indicates the increasing vulnerability of a financial institution (Craig and Dan, 2013). In 2000, credit risk was 3.5% in SSA microfinance institutions (MFIs), which increased to 8.2% in 2010 and 8.1% in 2014 (see Appendix Figure A2 Panel A). Similarly, there have been episodes of ailing and dying MFIs in India, Morroco, Pakistan, Nicaragua, Bosnia and Herzegovina (Chen et al., 2010; Wichterich, 2012). In SSA, there have been insolvencies in Ghana (50 MFIs in 2013 alone), the West African Economic Monetary Union (25 MFIs), the Economic and Monetary Community of Central Africa (4 MFIs) and one each recorded in Zambia and South Africa (Boateng et al., 2016; Riquet and Poursat, 2013). This instability in the microfinance sector has been attributed to the failure of MFIs to prioritize risk management and to other factors such as weak regulation, excessive market growth, predatory lending, fraud and loss of focus (Lutzenkirchen et al., 2012; Marulanda et al., 2010). Despite these episodes, there has been little empirical analysis to unravel the relationship between loan growth and portfolio at risk in SSA microfinance
3
markets. Furthermore, little is known on how such growth, especially when it is excessive, impacts asset quality in microfinance. The aim of this thesis is to provide new evidence on the trade-offs between loan growth and credit risk in MFIs located in SSA and to analyse the causes of loan growth and the associated risk. It also explores demand-side factors that could be used to explain the expansion witnessed in the region’s microfinance markets.
At the global level, scholarly works have attempted to explain variations in loan growth in microfinance markets (Wagner and Winkler, 2013; Ahlin et al., 2011). Whereas Wagner and Winkler (2013) sought to explain whether microfinance was exposed to global financial crises, Ahlin et al. (2011) were more concerned with the effect of macroeconomic and institutional factors on the microfinance sector. Regarding credit risk exposure, empirics have been concerned with the roles of gender (Schmit and Marrez, 2010; D’espallier et al., 2011), group lending (Crabb and Keller, 2006), macroeconomic shocks (Gonzalez, 2007), loan growth (Gonzalez, 2010) and loan size (Chikalipah, 2018). In addition, Sainz-Fernandez et al. (2015), Yimga (2016), Lassoued (2017) and Noomen and Abbes (2018) sought to identify the drivers of credit risk. From the demand side, studies that have sought to explain why access to finance differs across households and countries include Mohieldin and Wright (2000), Okurut (2006), Manrique and Ojah (2004), Zeller (1994), Okurut et al. (2005), Khoi et al. (2013) and Farazi (2014). Generally, these studies have identified individual factors, household characteristics, financial factors, sector-level attributes and macro-institutional factors as the key determinants of access to credit.
A review of the relevant literature reveals glaring gaps in studies that analyse the determinants of both loan growth and risk in microfinance markets first of which is that SSA has been neglected in the relevant literature. Secondly, previous studies have paid little attention to the dynamic aspects of loan growth and risk. They employed static regressions, applying either
4
random effects and fixed effects estimators which are limited in dealing with panel endogeneity bias. They also failed to deal with endogeneity issues that arise from omitted variables, measurement errors and reverse causality. The third gap observed is that very few studies have explored these issues at the disaggregated level, yet such analysis unmasks important differences in the effects of region-specific idiosyncratic factors. Undertaking international comparisons is useful because it allows one to test whether factors that turn out statistically significant in SSA are also important elsewhere. Finally, relatively few scholarly works have analysed the effect of mobile financial services (MFS) on access to credit. Given these knowledge gaps, this thesis approaches microfinance from both the demand and supply sides. From the supply side, the thesis considers the lending behaviour in MFIs and examines whether excessive lending is associated with higher risk exposure and whether any non-linearities exist in this relationship. The demand side looks at some of the potential barriers to accessing MFI credit at the household level.
Specifically, the aim of Chapters 2 and 3 is to identify the factors that determine loan growth and assess predictors of credit risk differences in SSA, respectively. Both chapters also compare and contrast the statistical significance of these factors in other global regions. Chapters 2 and 3 apply system generalised method of moments (GMM) on data from 2004-2014 to investigate the determinants of loan growth and credit risk in SSA microfinance markets while also identifying any trade-offs that may exist between both variables. Data was derived from four sources: MIX dataset, World Development Indicators, World Governance Indicators and Doing Business Indicators. These two chapters contribute to the literature in several ways. Firstly, they provide evidence on SSA, which is a region that has been neglected in the literature. Secondly, they extend the models that have been used previously by introducing dynamics as well as specific and idiosyncratic factors of the SSA region. Thirdly,
5
they use system GMM estimators, which have been known to accommodate endogeneity biases. Lastly, they identify predictors of loan growth and risk in Eastern Asia and the Pacific (EAP), Eastern Europe and Central Asia (EECA), Latin America and the Caribbean (LAC) and South Asia (SA).
Both Chapters establish the existence of trade-offs between loan growth and risk. Loan growth was higher in MFIs facing lower risk exposure and vice versa. In contrast to Chapter 2, the third Chapter establishes non-linearities between loan growth and credit risk, thus providing evidence of threshold effects. The two Chapters also report that dynamics are important in predicting both loan growth and credit risk, which points to the persistence of these two variables. In addition, the analysis in Chapter 2 shows that loan growth in MFIs for the entire period (2004-2014) is higher when ease of getting credit is lower and when capitalisation, GDP growth and regulatory quality are higher. According to Chapter 3, other predictors of credit risk in SSA MFIs are provisions for loan impairment, GDP per capita growth and ease of getting credit. A comparative analysis of credit risk determinants in Chapter 3 shows that credit risk was persistent in all regions (ECA, EECA, LAC and SA). The same analysis in Chapter 2 identifies loan growth as an important predictor of credit risk in all regions. A global analysis of loan growth determinants in Chapter 2 also shows that loan growth is persistent in all regions.
Chapter 4 examines the differences in the propensity to use microcredit in Kenya using FinAccess survey data collected in 2013 and 2015, paying particular attention to the effects of MFS including M-banking, M-money and M-credit on the likelihood of using microcredit. Kenya is an interesting case study because the country out-performs other countries in the region in terms of both financial and digital inclusion. The 2014 Global Financial Inclusion database shows that out of 38 SSA countries, account ownership in Kenya was 74.7%
6
compared to 34.2% for SSA while mobile money account penetration in Kenya was 58.4% against 11.5% for SSA. A 2016 report by the Brookings Institution comparing 26 countries in terms of M-money adoption ranked Kenya on top of the sample countries1. The high rating of
the country has been attributed to the financial innovation of M-PESA2, which has drastically
altered the way people save, borrow and transact. Significantly lowering many barriers that discourage poor people from accessing banking services, M-PESA has also had an impact on access to microcredit following its explosion in the last few years. After addressing endogeneity concerns via instrumental variables (IV 2SLS and IV Probit), the results in Chapter 4 show that the probability of using MFI credit is lower among those using M-banking and M-credit as well as among males and married persons. However, higher income, education level, household size and being located in a rural cluster is associated with a higher probability to use MFI credit. Furthermore, the analysis shows evidence of a U-shaped relationship between the probability of using MFI credit and age.
The findings in this thesis have important policy implications for both practitioners and regulators of microfinance in SSA. The finding that loan growth and credit risk are negatively correlated implies that modest loan growth is not a source of instability in the MFI sector. Rather, excessive loan growth is potentially harmful to the instability of MFIs. Therefore, these institutions should be encouraged to identify the threshold at which loan growth becomes harmful to their stability. Another pivotal finding is that dynamics predict lending growth and credit risk. This implies that lending methodologies, such as credit scoring and credit modelling, that incorporate past lending and loan defaults are likely to be more effective.
1 Refer to Villasenor et al. (2016)
2 Introduced into the Kenyan market in 2007 by Safaricom, M-PESA consists of two words. “M” stands for “mobile” and “PESA” is a Kiswahili word that means “Money”. Put together, “M-PESA” means “Mobile Money” which is a mobile phone platform that allows users to exchange cash for an “float” on their phones, to send e-float to other cellular phone users and to exchange e-e-float back to cash (Mbiti and Weil, 2011).
7
Regarding the negative correlation between the use of microcredit, on one hand, and the use of M-banking and M-credit, on the other hand, the results imply that the introduction of MFS has heightened competition in the traditional microfinance sector. Hence, MFS should be designed in ways that do not harm access to microcredit.
1.2 Why Focus on Sub-Saharan Africa?
There are two main reasons why this thesis is centred on this particular region of Africa. Firstly, SSA has the highest poverty levels in the world and the highest levels of financial exclusion (Begle et al., 2016; World Development Indicators, 2017). Secondly, indicators of performance show a significant difference between SSA and non-SSA MFIs (See Appendix Table A2). At the global level, SSA has both high poverty and low financial deepening. About 43% of the population in SSA lives on less than USD 1.90 a day compared to 11% in developing countries (Begle et al., 2016). Between 2004 and 2014, the share of domestic credit to the private sector by banks in GDP was 17% for SSA and 34% for developing countries3. These statistics suggest
a bigger role for microfinance to promote financial inclusion and poverty reduction in SSA than elsewhere. In spite of this evidence, SSA remains the least researched area in terms of microfinance; studies seeking to understand the implications of the fast growth in microfinance markets and the associated risks are few.
Furthermore, this thesis focuses on SSA because the indicators in Appendix Table A2 provide several reasons to believe that there is a significant difference in the performance of MFIs in SSA as compared to their counterparts in other developing regions. Using several MFI performance indicators, the t-test for equality of means confirms this conjecture. These
3 Author’s computation using World Development Indicators
8
indicators include institutional characteristics, outreach, sustainability, revenue mobilization, spending levels, efficiency, productivity and risk exposure. On the basis of outreach, SSA lags behind in terms of number of active borrowers, gross loan portfolio and the share of women in the total number of active borrowers. There is a difference in gross loan portfolio of USD 12.4 million between an average MFI in SSA and an MFI elsewhere. This difference is significant at 1%. In terms of overall financial performance, MFIs in SSA are generally less operationally self-sustainable than MFIs elsewhere. Two indicators on revenues, namely financial revenue ratio and yield on gross portfolio, confirm that average loan interest rates charged by MFIs are relatively higher in SSA MFIs compared to rates charged on loans in other developing regions. The analysis also shows that MFIs in SSA are relatively inefficient and less productive on the basis of the following ratios: operating expense ratio, personnel expense ratio, borrowers per staff member and depositors per staff member. A comparison between the two groups in terms of loan write-offs and non-earning liquid assets as percentage of total assets shows that MFIs in SSA are not only more liquid but they are also riskier compared to their counterparts in other regions.
1.3 Structure of the Thesis
The rest of the thesis is presented as follows. Chapter 2 identifies the factors that explain variations in loan growth in SSA MFIs while Chapter 3 examines their exposure to credit risk. The next chapter explores the impact of mobile-based financial services on microfinance and explains why access to MFI credit differs among households in Kenya. Concluding the thesis, Chapter 5 provides some policy recommendations, limitations and suggestions for further research in the microcredit sector.
9
Chapter 2
Determinants of Loan Growth in Microfinance Institutions: The Case of
Sub-Saharan Africa and Comparisons with other Regions of the World
2.1 Introduction
Between 2000 and 2014, lending in microfinance markets in Sub-Saharan Africa (SSA) rose sharply. The number of borrowers increased from 854,692 in 2000 to about 4.3 million in 2014. Gross loan portfolio, which stood at US$250 million in 2000 rose to about US$5.9 billion in 2014. The stock of microfinance assets rose from US$360 million in 2000 to US$9.9 billion in 2014. Between 2000 and 2008, credit expanded at about 36.8% annually and the cross-MFI variability in the loan growth was also high (Appendix Figure A1). However, there was a decline in both the loan growth rate and variability during the 2009-2014 period implying that outreach gains that were experienced before 2009 were beginning to level out. High variability during the 2004-2008 period meant that the sharp rise in lending was far from uniform across MFIs.
Mean loan growth in SSA was 28% between 2004 and 2014 (Appendix Table A4). In financial markets, this is considered rather high. But the percentage masks huge country and cross-MFI disparities. For individual countries, loan growth ranged from 87.3% in Guinea-Bissau to 11.1% in Central African Republic and Niger, although some countries such as Comoros and Zimbabwe witnessed negative loan growth rates. At the MFI level4, the fastest loan growth
rates of 530% and 440% were recorded by Reliance (located in Gambia) and Abidjan Credit
10
(located in Ivory Coast), respectively. The lowest loan growth rates of -440% and -390% were recorded by CANARI (located in Ivory Coast) and Faching (located in Zimbabwe), respectively.
From a policy perspective, sceptics are wondering whether this growth in microcredit markets is too fast (Gonzalez, 2010). In fact, it has been feared that such loan growth rates may pose significant stability risks in the MFI sector via a deterioration in portfolio quality (Yimga, 2016; Chen et al., 2010; Lutzenkirchen and Weistroffer, 2012). These concerns are consistent with real business cycle theory which associates credit booms with growing financial crises
(Elekdag and Wu, 2011). In fact, evidence indicates that many bank crises were preceded by rapid credit growth including the recent global recession of 2007-2009 (Amri et al., 2012). Therefore, policies to promote the growth of MFIs in SSA need to be based on a good understanding of the drivers of loan growth.
Whereas the above disparities and concerns have been evident for some time, extant evidence at the global level on what explains the variations in the loan growth rate in microfinance markets is now emerging, though knowledge is still limited and inconclusive. For example, studies have begun to question whether microfinance (which was initially cushioned from systemic shocks) has become vulnerable to such shocks as is the case in the banking sector (Wagner and Winkler, 2013). Evidence seems to be in the affirmative. There is also focus on whether the macro-institutional environment affects the performance of MFIs (Ahlin et al., 2011)5. Again, evidence seems to be in the affirmative. But these studies have paid little
attention to dynamic aspects of loan growth and therefore use static regressions applying either
5 The main question was whether the macro-institutional environment influences the success of microfinance using various measures including operational self-sustainability, interest mark-up, loan loss expense rate, risk, cost per dollar loaned, cost per borrower, MFI growth, loan growth, loan size growth and borrower growth.
11
random effects and fixed effects estimators which are limited in dealing with panel endogeneity bias. They fail to address endogeneity issues that arise from omitted variables, measurement errors and reverse causality. Although mean tests confirm that MFIs in SSA are different from their counterparts elsewhere, there is not yet evidence on factors that determine loan growth in SSA6. In addition, very few studies have explored the issue at the disaggregate level yet such
an analysis unmasks important differences in the effects of regional-specific idiosyncratic factors. Undertaking international comparisons is useful because it allows one to test whether factors that turn out statistically significant in SSA are also important elsewhere. Given these knowledge gaps, this paper aims to identify the factors that determine loan growth differences in SSA and distinguish the various ways such factors affect loan growth in other geographical regions.
This chapter contributes to microfinance literature in two ways. Firstly, it extends knowledge in this area by providing evidence from SSA, a region that has been neglected in the relevant literature despite the important role that MFIs role in the region. Secondly, it expands the models that have been employed in the past by considering the dynamic aspects of microfinance as well as the specific and idiosyncratic factors of the SSA region. The chapter applies panel generalised method of moments (GMM) estimators, which are versatile in dealing with endogeneity biases that are pervasive in socio-economic data.
Empirical findings reveal that micro-level, macroeconomic and institutional factors are significant predictors of loan growth in SSA. Four main findings stand out. First: loan growth is faster among MFIs that were already having high loan growth, which reflects persistence in
6 Mean tests in Table 1 also reveal that the macro-institutional environment in SSA is significantly different
12
loan growth. Second: loan growth is higher in MFIs facing lower risk exposure, that are well capitalised and those that are located in countries with high GDP growth rates and sound private sector policies and regulations. The third notable finding, contrary to expectations, is that loan growth is faster in countries with poor legal rights of borrowers and lenders. Finally, variables that are statistically significant in the SSA regressions do not necessarily remain significant in the regressions for the other regions (Eastern Asia and the Pacific, Eastern Europe and Central Asia, Latin America and the Caribbean and South Asia).
The next section of this chapter reviews the relevant literature and identifies some knowledge gaps. Section 2.3 presents the empirical model and discusses the data while Section 2.4 reports the results. Section 2.5 concludes the discussion and draws some policy implications.
2.2 Literature Review
2.2.1 Theoretical Literature
The economic theory suggests that the amount of credit extended by a financial institution is mainly determined by the business cycle (Bernanke et al., 1994), information (Stiglitz and Weiss, 1981), institutions (North, 1990) and monetary policy stance (Mishkin, 2013). The business cycle view is based on the interconnectedness of credit markets and the macroeconomy (Plosser, 1989). In these markets, optimizing decisions of lenders and borrowers interact to generate economy-wide cyclical patterns. An offshoot of this reasoning is the financial accelerator theory, which was pioneered by Bernanke et al. (1994). This theory explains how small adverse changes to the net worth of firms are amplified to propagate huge adverse financial and macroeconomic shocks, which in turn set in motion credit cycles. When
13
the net worth of firms falls in the presence of financial frictions, agency costs of lending to such firms rise (Mishkin, 2013). Lenders become suspicious of such firms and are less willing to grant them credit because a decline in the firms’ net worth gives them a higher incentive to invest in risky investment projects arising from the fact that they stand to lose less if the project fails. The firms respond by downscaling their investment plans which lowers economic activity. This has adverse knock-on effects on asset prices and the net worth of firms, perpetuating recurring cycles and feedback loops.
Business cycle theory predicts procyclicality between loan growth and economic upswings (Clair, 1992; Keeton, 1999; Quagliariello, 2007). In addition, it predicts countercyclicality between credit risk and economic upswings. When lending is excessive during an economic upswing, it ends up as a “credit crunch” during subsequent downturns (Berger and Udell, 2004). An economic boom is associated with higher profits, higher asset values and optimistic customer expectations (Quagliariello, 2007). Because aggregate demand will also be higher during an economic boom, demand for loans goes up because the loan servicing capacity of borrowers is enhanced. Banks take in more risk by giving new loans at lower interest rates and relaxed credit standards resulting in higher indebtedness among borrowers. There is a reversal of events during an economic downturn because loan performance problems appear – loan defaults will rise and growth in loans will be low. As such, phases of high loan losses tend to be preceded by phases of high loan growth. Similarly, macroeconomic variables may follow either a pro-cyclical or counter-cyclical pattern in the presence of economic upwings. For example, aggregate demand and inflation tend to be procyclical while unemployment and interest rates tend to be counter-cyclical.
Credit cycles are usually characterised by accelerated lending during business cycle expansions, with sharp reversals in lending during subsequent downturns. Keeton (1999) argues that the reversals do not always hold. Faster loan growth may not be followed with
14
higher loan losses if there exist either demand or productivity shifts. An increased demand for credit unrelated to borrower’s underlying creditworthiness will tend to boost loan growth and raise credit standards, reducing the likelihood of future loan losses. A productivity shock that could result from improved technology or lower oil prices has the effect of increasing the chances that a borrower of given characteristics can repay the loan, allowing banks to relax their collateral requirements or accept borrowers with poorer credit histories.
The second view identifies information as a key determinant of the lending decision because the parties contracting are imperfectly informed about each other (Stiglitz and Weiss, 1981). Before making the decision to lend, the creditor needs information about the borrower’s risk attitude, goals and credit history; the viability of borrowers’ projects as well as the borrower’s other lenders (Djakov et al., 2007). When these are not satisfied, the creditor remains exposed to agency costs arising from adverse selection and moral hazard (Stiglitz and Weiss, 1981). With the prospect of uncertainty and the likelihood of loan default, the lender tends to incur extra costs to monitor the loans, screen the loan applicants and obtain sufficient collateral as an incentive to repay the loan. The higher the agency costs, the higher the probability of loan default, which reduces the willingness of the lender to extend new loans and renew old loans. Information asymmetry problem is usually more acute among SMEs who are the main clients to MFIs. These enterprises (SMEs) tend to be informationally opaque – they do not have a culture of maintaining up-to-date records and developing business plans (De la Torre et al., 2010).
The third determinant of lending by MFIs has been termed “the power of creditors” (Djakov et al., 2007). It is based on the idea that creditors are more willing to lend if they can easily enforce the loan contract. Contract enforcement guarantees property rights, lowers transaction costs and reduces opportunistic behaviour in lending (McMullen et al., 2008; North, 1990). A case
15
in point is the finding that the prevalence of corruption resulted in taxing the operations of micro-enterprises, consequently constraining their expansion, reducing their demand for loans as well as the quality of microloans (Ahlin et al., 2011). Good institutions may also constrain lending by financial institutions. When a large proportion of the MFI loan portfolio is held by informal sector operators, a shrinking informal sector (caused by strengthening institutions) will imply lower loan demand. Udry (1990) finds that MFI loans by informal sector players are used for risk pooling. Therefore, the expectation is a negative relationship between stronger institutions and growth in lending.
The last view is the government’s monetary policy stance. As explained by Mishkin (2013) and Hofmann (2004), there are several channels through which monetary policy is transmitted. Only four channels are highlighted here: traditional interest rate, bank lending, balance sheet and cash flow. According to the traditional Keynesian view, a contractionary monetary policy is associated with higher interest rate, which increases the cost of credit and lowers supply of loans. In the bank lending channel, the quantity of bank loans will fall in response to a contractionary monetary policy which lowers bank reserves and bank deposits. The balance sheet channel works via a fall in adverse selection and moral hazard which accompany a fall in the net worth of firms as a result of falling stock prices. Stock prices fall in response to a contractionary monetary policy. The cash flow channel also works through firm’s balance sheet. Contractionary monetary policy has the effect of lowering firms’ cash flow, which worsens the firms’ balance sheet. When the balance worsens, the liquidity of the firm falls – curtailing its capacity to pay bills. When the firm’s creditworthiness deteriorates, the lemons problem sets in resulting in a lower supply of loans.
16 2.2.2 Empirical Literature
The empirical literature on the determinants of credit growth in microfinance is scarce. During the financial crises of the 1980’s and 1990s7, microfinance exhibited two interesting features
that later became the focus of research. The first one was the observation that MFIs emerged unscathed after the crises, even though the banking sector faced a lot of distress (Wagner and Winkler, 2013). It was puzzling that despite the fact that financial crises affected the banking sector (crisis prone), microfinance remained unaffected and “crisis free’. The second is the fact that accumulation of non-performing assets in MFIs did not result in loan write-offs because non-performing assets were always settled (Gonzales, 2010). These two features were attributed to high levels of discipline in lending, more productive use of loans by MSEs and insulation of MFIs from the global financial system (Wagner and Winkler, 2013).
The question of whether microfinance was significantly correlated to developments in international financial markets remained empirically untested until the study by Krauss and Walter (2009). The study used 1998-2006 cross country data to conclude that MFI growth and global market indicators were independent. This finding can be contrasted against Wagner and Winkler (2013) who found a significant and negative relationship between MFI real credit growth and the global financial crisis - the results being sustained even when the data is analysed by legal status of the MFI (except credit unions where the effect was insignificant) and regions (except South Asia). These findings are interpreted as evidence of exposure of microcredit to boom-bust cycles that characterise the traditional banking sector, thus pointing to the idea that rapid increases in lending by MFIs should be viewed as an indicator of either financial inclusion or financial distress. Ahlin et al. (2011) address the question: Does MFI
7 During the 1980s, banking crises were experienced in the United Sates, Argentina, Chile, Czech Republic and
Norway and during the 1990s in Indonesia, Thailand, South Korea, Malaysia, Venezuela, Mexico, Japan, Finland, Hungary, Brazil, Russia and Sweden (Mishkin, 2013)
17
success depend on the macro-institutional environment? Among other dependent variables, they considered extensive loan growth (number of borrowers) and intensive growth (average loan size). They find that the significant predictors of borrower growth include labor force participation, manufacturing value added and age of MFI. Predictors of loan-size growth were labor force participation, manufacturing value added and real GDP per capita. It is concluded that microeconomic factors as well as the macro-institutional environment do influence microfinance loan growth.
Whereas Krauss and Walter (2009) and Wagner and Winkler (2013) focused on the correlations between financial crises and microfinance, Gonzales (2010) was more concerned with thresholds in loan growth – by seeking to determine how much growth would be considered too much. Using quadratic relationships, the study identifies the turning points along the credit curves and provides evidence to suggest that the growth of loans in microfinance was not very high during the 2003 – 2008 period. This was implicitly taken to mean that the rapid growth in microfinance markets was more of a “catch-up effect” (movement towards an equilibrium) rather than a shift towards disequilibrium.
Some of the significant predictors of loan growth at the MFI-level as identified by Wagner and Winkler (2014) and Ahlin et al. (2011) include funding growth, credit risk, GDP growth, inflation, global financial crisis, current account balance, remittances, competition, size, political stability, corruption, labour force, age and manufacturing value added. Despite this evidence, there is yet no consensus as to which factors are most relevant in explaining credit expansion. The statistical significance of individual factors, as well as their signs and magnitudes vary across studies, thus, producing conflicting results. Moreover, an understanding of the drivers of credit growth in microfinance institutions is just an emerging area of research while the effect of some of these significant factors in SSA remains unknown.
18
Unlike MFIs, banks have been extensively researched partly because financial systems in many countries are bank-based (Mishkin, 2013) and partly because they face more exposure to international financial crises. In fact, early analyses of the rapid growth in credit were done in response to the credit market cycles of booms and busts in developed countries during the late 1980’s and early 1990’s (Hofmann, 2001). Such studies examined bank credit booms and their drivers8 as well as the procyclicality of bank performance and the business cycle9. Credit booms
have been defined as episodes of rapid credit growth (Dell’Ariccia et al., 2012) especially when the annual growth rate of the bank credit to the private sector as a share of GDP exceeds 20 per cent (Barajas et al., 2007). With credit booms defined in this way, it was shown that not all of them were bad – there were “bad booms” and “good booms’’. Good booms were associated with economies movement towards the equilibrium, defined as a “catch-up effect”, but bad credit booms always fuelled economic crises.
In order to test the hypothesis that credit growth was procyclical, the approach has been to regress credit to private sector as a share of GDP against an economic activity variable (such as GDP growth, GDP per capita, industrial production) and other control variables. A positive and significant coefficient on GDP is usually taken to imply that credit growth is dependent on GDP growth and the former is procyclical. In theory, favourable economic conditions boost spending by households and firms. This enhanced spending activity stimulates demand of credit (Hofmann, 2001). In line with theoretical expectations, there has been overwhelming evidence of bank credit growth being procyclical (Hofmann, 2004; Calza et al., 2003; Njoroge and Kamau, 2010). This finding is important for bank regulators because it suggests the need for countercyclical stabilization measures especially when credit booms can be predicted
8See, for instance, Barajas et al., (2007); Bakker and Gulde (2010); Ali and Daly (2010); Kiss et al. (2006);
Hofmann (2004); Aisen and Franken (2010); Coricelli et al., (2006); Mendoza et al., (2008); Ahmad and Ariff (2007) and many others
9See, for instance, Albertazzi and Gambacorta (2009), Bikker and Hu (2002), Bouvatier and Lepetit (2012),
19
beforehand. There is also a possibility of an inverse relationship between credit growth and GDP (Hofmann, 2001). This happens when firms switch from external to internal borrowing during an economic upswing which improves their cashflow position. A shift towards internal funds lowers demand for bank credit.
Apart from GDP growth, other common regressors appearing in loan growth regression are inflation rate, interest rates and public debt (Hofmann, 2001; Calza et al., 2003; Brzoza-Brzezina, 2005; Cottarelli et al., 2005). The GDP growth is usually included in the loan growth regressions to capture business cycle effects while the interest rate proxies the cost of credit in the economy. Inflation is used to capture macroeconomic instability. Public debt is usually used to proxy sovereign risk since high levels of debt may increase the risk that an economy will experience capital flight (Ali and Daly, 2010). A government can always deal with its debt by simply defaulting. The higher the government debt, the greater the temptation of default. External debt tends to be inversely correlated with loan growth. From theory, the effect of inflation on loan growth is indeterminate – it is either positive or negative (Wagner and Winkler, 2013; Chaibi and Ftiti, 2015). The positive effect depends on whether inflation works via the labour market by reducing unemployment as hypothesized by Phillips curve or through an increase in loan servicing capacity due to a fall in the real value of the loan. The negative effect works through a fall in real incomes, which reduces the loan servicing capacity. Interest rate is included in the regressions to capture the cost of credit (Hofmann, 2001). A tight monetary policy evidenced by high interest rates, reduces bank liquidity and the capacity of banks to lend, hence reducing credit supply. Similarly, when the Central bank controls money via open market operations, the lowers reserves and loanable funds which decreases credit supply.
20
Bank loan growth regressions have also included institutional factors as predictors. Such factors include governance indicators and business environment indicators (Boutriga et al., 2010; Breuer, 2006; Hermes et al., 2011). A few studies have made attempts to capture financial sector reforms, accounting standards, banking sector entry barriers and the origin of the legal system (Cotarelli et al., 2005). Following predictions of new institutional economics theory, it is expected that institutional variables will be positively and significantly correlated with loan growth.
Regarding SSA, banking sector evidence indicates that the market structure of banks, their financial strength and regulatory capital are the broad determinants of lending behaviour (Amidu, 2014) whereas country-level evidence shows that the macroeconomic environment is a significant predictor of lending by banks (Njoroge and Kamau, 2010). Even though there are stark differences between microfinance and banking sectors, evidence from the microfinance markets in this region is lacking.
In terms of modelling, previous microfinance studies (Wagner and Winkler, 2013; Ahlin et al., 2011) on credit growth have assumed static relationships and ignored the dynamics of lending behaviour. They have used static models along with either random-effects or fixed-effects estimators that do not allow one to use observable information of previous periods in the model. Similarly, such estimators are limited in dealing with endogeneity biases that are common in social economic data. Using banking data, authors like Lane and McQuade (2014), Kiss et al., (2006), Amidu (2014), Gambacorta and Mistrulli (2004) and Bouvatier and Lepetit (2012) have captured dynamics in their models. However, most of these studies used a one-way error components model. Bouvatier and Lepetit (2012) expanded these models by using a two-way
21
error components model in which MFI-specific factors and country heterogeneities were controlled for.
This study extends existing knowledge in microfinance in two ways. First, the study uses a dynamic model where loan growth is modelled to depend on its past realizations. The model is estimated using system GMM, which is an estimator that is versatile in dealing with panel endogeneity biases that arise from reverse causality, omitted variables and measurement errors. In addition, the study controls for idiosyncratic factors of the SSA region and provides evidence for a region that has been largely neglected in the relevant literature.
2.3 Methodology and Data
2.3.1 Model Specification
Since this study is using panel data, loan growth, 𝑔𝑖𝑡, is observed over time, opening up the
possibility of estimating parameters of dynamic models that specify the loan growth to depend in part on 𝑔𝑖,𝑡−1, … … … 𝑔𝑖,𝑡−𝑝, which are its values in previous periods (Cameron and Trivedi, 2010). Given this fact, some studies such as Kiss et al. (2006) as well as Lane and McQuade (2014) specify a one-way error components dynamic model which is an autoregressive model of order 1 in 𝑔𝑖𝑡 [an AR (1) model] with 𝑔𝑖,𝑡−1 as a regressor and X and W, as vectors. This
specification is shown in equation (1).
𝑔𝑖𝑡 = 𝛼1𝑔𝑖,𝑡−1+ 𝑿𝑖𝑡′ 𝛽 + 𝑾𝑡′𝜌 + 𝜀
𝑖𝑡 (1)
𝜀𝑖𝑡 = 𝜇𝑖 + 𝑢𝑖𝑡 (2)
22
Although panel data contains both cross sectional and time dimensions, equation (1) does not control for time-specific effects. In the studies reviewed in section 2, only Bouvatier and Lepetit (2012) accommodated time-specific effects in their models. Taking this into account, equation (1) is modified by incorporating time-specific effects to give equation (3), which is a two-way error components model.
𝑔𝑖𝑡 = 𝛼1𝑔𝑖,𝑡−1+ 𝑿𝑖𝑡′ 𝛽 + 𝑾𝑡′𝜌 + 𝜀𝑖𝑡 (3)
𝜀𝑖𝑡 = 𝜇𝑖 + 𝜆𝑡+ 𝑢𝑖𝑡 (4)
𝑤ℎ𝑒𝑟𝑒 𝑖 = 1 … . 𝑁; 𝑡 = 1 … . 𝑇
The regressand 𝑔𝑖𝑡 is loan growth of MFI i in year t.Loan growth (𝑔𝑖𝑡) is the log difference in year-end gross loan portfolio. Vector 𝑿𝑖𝑡 contains MFI-level variables, which include credit risk, Herfindahl-Hirschman index, capital asset ratio and return on equity. Macro-institutional variables are contained in the vector 𝑾𝑡 . These variables include GDP growth, inflation, money supply, regulatory quality and ease of getting credit. MFI-specific and time-specific fixed effects are captured by 𝜇𝑖 and 𝜆𝑡 respectively while 𝑢𝑖𝑡 is white noise.
In equation (3), 𝑔𝑖𝑡 is correlated over time directly through (i) 𝑔𝑖,𝑡−1 in preceding periods which is termed true state dependence; (ii) through observables 𝑿𝑖𝑡 and 𝑾𝑡, which is termed observable heterogeneity and (iii) indirectly through time invariant individual effect 𝜇𝑖 and
time variant effect 𝜆𝑡, which are collectively termed unobserved heterogeneity. These correlations generate the problem of “dynamic panel bias” (Roodman, 2009). To consistently estimate 𝛼, 𝛽 and ρ, for time varying regressors, 𝜇𝑖 can be eliminated by appropriate differencing transformation10.
10∆𝑔
23
First differencing transformations are not enough to deal with endogeneity biases and an application of OLS on equation (3) will produce inconsistent parameter estimates because the lagged term [𝛥𝑔𝑖,𝑡−1] is correlated with the error ∆𝑢𝑖𝑡, even if 𝑢𝑖𝑡 is serially uncorrelated. This correlation provides justification for the use of instrumental variable estimation where lagged dependent variables and exogenous variables enter as instruments as proposed by Anderson and Hsiao (1981). However, more efficient instrumental variable estimators termed Arellano-Bond estimators can be obtained by using more lags of the dependent variable as instruments (Holtz-Eakin et al., 1988). According to Cameron and Trivedi (2010), the Arellano-Bond estimator assumes that 𝐸(𝑔𝑖𝑡∆𝑢𝑖𝑡) = 0 for s≤t-2 so that the lags 𝑔𝑖,𝑡−2, 𝑔𝑖,𝑡−3, … … can be used
as instruments in the first differenced model.
According to Arellano and Bover (1995) and Blundell and Bond (1998), it is possible to obtain another estimator which is more precise and which exhibits better finite sample properties. This can be implemented by imposing an additional condition 𝐸(∆𝑔𝑖,𝑡−1𝑢𝑖𝑡) = 0 so that the levels (equation 3) can be incorporated and ∆𝑔𝑖,𝑡−1 can serve as instruments. This builds a system of
two equations where the equation in levels applies lagged first differences as instruments while the equation in first differences applies lagged levels as instruments. Adapting this approach, this study will apply the two-step GMM version of the Arellano and Bover (1995) and Blundell and Bond (1998) extensions which accommodate unobserved heterogeneity as well as endogeneity.
2.3.2 Data Description and Sources
Data was assembled from four sources – MIX dataset of the Microfinance Information eXchange (www.mixmarket.org) and World Development Indicators, World Governance Indicators and Doing Business Indicators datasets of the World Bank. The MIX data is merged
24
with country-level data from the World Development Indicators, Doing Business Indicators and World Governance Indicators. The data used for this study covers the period 2004-2014.
The MIX dataset is a global unbalanced MFI-level panel. The number of MFIs in the sample over the 2004-2014 period is 2687 for the global sample but 745 for SSA, 393 for East Asia and the Pacific (EAP), 483 for Eastern Europe and Central Asia (EECA), 562 for Latin America and the Caribbean (LAC), 423 for South Asia (SA) and 80 for Middle East and North Africa (MENA). Regarding the number of observations, the total sample has 16,383 observations distributed regionally as follows: SSA (3122), SA (2379), LAC (3898), EECA (2592), EAP (1833) and MENA (559). The sample covers 120 countries, which are listed in Appendix Table A3. The sample includes 37 countries from SSA, 16 from EAP, 24 from EECA, 26 from LAC, 10 from MENA and 7 from SA.
2.3.3 Definition and Measurement of Variables
The dependent variable, loan growth is the log difference in year-end gross loan portfolio (gross loan portfolio represents total amount of all loans outstanding). All MFI-specific variables are drawn from the MIX dataset. Four MFI-level variables are used: lagged loan growth, credit risk, capital asset ratio and return on equity. In addition, the level of market concentration in the MFI sector is proxied by the Herfindahl-Hirschman index (Basega-Pascual et al., 2015; Wagner and Winkler, 2013). It is computed using the following formula; 𝐻𝐻𝐼 = ∑𝑛𝑖=1𝑆𝑖2 where 𝑆𝑖 is the market share of firm i in total n firms in the country being considered.
The effect of competition on loan growth is mixed. High competition in a saturated market adversely affects loan growth. However, higher competition can also mean higher efficiency in the delivery of loans.
25
Lagged loan growth is used to capture persistence in loan growth over time or conditional convergence. Ideally, loan growth at time t contains some information from its previous values
(𝑔𝑡−1, … . 𝑔𝑡−𝑝). Due to persistence in loan growth, the value of loan growth in previous periods
is expected to predict the current level of loan growth (Lane and McQuade, 2014). The coefficient on lagged loan growth indicates the speed at which the loan growth reverts to the long-run equilibrium (Chikalipah, 2018). Literature on conditional convergence (see Fung, 2009; Asongu, 2013; Asongu and Nwachukwu, 2016) suggests that convergence is established when two criteria are met. Firstly, 𝛼1 should be statistically significant. Secondly, the absolute
value of the estimated coefficient on the lagged dependent variable should be within the interval of zero and one (0<|𝛼1|<1). However, the speed of convergence can be derived by subtracting 1 from the estimated coefficient on the lagged dependent variable (𝛼1− 1).
Credit risk is measuredas the sum of portfolio at risk and the write-off ratio (Gonzalez, 2011; Wagner and Winkler, 2013; Sinkey and Greenwalt, 1991). Portfolio at risk is the proportion of loans in the gross loan portfolio of an MFI that has been overdue for more than 30 days while the write-off ratio is the share of loans in the portfolio that are written off. Credit risk
measures the quality of an MFI’s loan portfolio and gives the probability that the MFI loan assets will suffer from default. The relationship between credit risk and loan growth is embedded in the real business cycle theory which postulates that MFIs will suffer a high default risk due to reduced household and firm earnings during a recession. In response to increased risk exposure, MFIs tend to reduce lending by raising the credit standards and lending rates of interest in order to minimize further likelihood of default. Thus, it is expected that there will be a negative relationship between credit risk and loan growth.
Capital asset ratio is the proportion of total equity in total assets.It isused to account for an MFI’sstability (Amidu, 2014). A higher capital asset ratio boosts an MFI’s solvency, meaning
26
that it holds a sufficient capital buffer to support its assets. According to Mishkin (2013), a highly capitalised firm faces less risk exposure because the owners have an incentive to pursue less risky ventures. It does this by becoming more stringent in underwriting loans and monitoring them, which reduces lending growth but minimizes loan default. Therefore, it is expected that there will be an inverse relationship between the capital asset ratio and loan growth.
Return on equity is a proxy for management efficiency (Love and Ariss, 2014). It is expected that correlation between loan growth and return on equity will be either positive or negative. Efficiency in lending may lead to a decrease in loan growth in view of the lemons problem.
Return on equity can also be associated with an increase in lending if profitability is associated with an economic upswing combined with an increase in demand for credit.
This study considers three macroeconomic variables, which are drawn from the World Development Indicators database of the World Bank. These variables are GDP growth,
inflation and money supply. Following Ahlin et al. (2011) and Wagner and Winkler (2013), this study controls for GDP growth, which is measured as the annual percentage change in real GDP per capita. GDP growth captures business cycle effects. Both business cycle theory and evidence support procyclicality between economic expansion and lending growth (Hofmann, 2001; Calza et al., 2003; Njoroge and Kamau, 2010; Ahlin et al., 2011).
Inflation is measured by the annual percentage change in the consumer price index (CPI). The effect of inflation on loan growth is ambiguous. The positive effect works via two channels. The first channel is based on the Phillip curve hypothesis, which postulates an inverse relationship between inflation and unemployment. Higher inflation is associated with lower unemployment and higher capacity to service loans. The second channel works through the effect of inflation on the real value of the loan. The real value of the loan tends to fall when