The role of Linked Data and the Semantic Web in Building
Operation
Edward J. Corry Researcher, Informatics Research Unit for
Sustainable Engineering, NUI, Galway, Galway, Ireland Daniel Coakley Researcher, Informatics Research Unit for
Sustainable Engineering, NUI, Galway, Galway, Ireland James O’Donnell Lecturer, Dept of Mechanical Engineering, University College Dublin, Dublin, Ireland Pieter Pauwels Researcher, Institute for Logic,
Language and Computation, University of Amsterdam, Amsterdam (NL) Marcus M. Keane Lecturer, Informatics Research Unit for
Sustainable Engineering, NUI, Galway, Galway, Ireland
ABSTRACT
Effective Decision Support Systems (DSS) for building service managers require adequate performance data from many building data silos in order to deliver a more complete view of building performance. Current performance analysis techniques tend to focus on a limited number of data sources, such as data measured in a Building Management Systems (BMS) (temperature, humidity, CO2), excluding a wealth of other data sources increasingly available in the modern building, including weather data, occupant feedback, mobile sensors & feedback systems, schedule information, equipment usage information.
As part of a wider decision support framework for key building stakeholders, the paper presents a data driven approach to the structured performance assessment of buildings, utilising semantic web technologies and performance metrics.
Taking an existing 14000m2 naturally-ventilated university building, we illustrate how diverse building data streams might be exposed and used to drive decision support for building operators, in the area of occupant satisfaction and performance optimisation.
INTRODUCTION
The manner in which buildings are envisaged, designed, constructed and operated is changing, with ever increasing demands placed on the industry of architecture, engineering and construction (AEC) to satisfy legislative, design and energy performance requirements. In particular, buildings are required to meet increasingly stringent environmental and performance legislations [1,2].
Buildings now contain a wide range of complex and expensive interdependent monitoring systems, many of which were unheard of 30 years ago.
These systems, specified at design stage, are usually standalone in nature and are controlled by a building management system (BMS).
Although building owners invest large sums of money in the design and construction of buildings, it is clear that many buildings do not operate as intended. Even buildings which were designed to operate optimally are often not even meeting the baseline of the design codes [3]. Operating in the absence of clear and unambiguous performance data, building managers tend to manage facilities intuitively and rely on experience [4]. There is also a significant reactive component to the position, with alarm systems forming part of the management infrastructure.
Information is often muddled, disjointed or inaccessible and the performance drift from ideal performance, over time, is pronounced. Building operators lack access to reliable performance information, delivered in a structured, systematic and contextual manner.
The holistic management and maintenance of facilities is a multi-domain problem encompassing financial accounting, building maintenance, facility management, human resources, asset management and code compliance, affecting different stakeholders in different ways [5]. The manner in which a building is created and managed is still routinely beset by issues surrounding data management and interoperability.
We feel that the nature of the problem is two-fold: the large interoperability issues encountered when attempting to integrate diverse sources of building data and the absence of a more holistic performance assessment framework providing accurate and reliable performance information in a precise and clear manner.
We illustrate how building related data can be transformed into a homogeneous format using semantic web technologies, allowing greater levels of information access and cross-domain
interoperability. Using these technologies, we describe how a structured performance measurement platform can be enhanced to provide a more holistic interpretation of building performance.
The paper further describes some of the difficulties encountered in organising disparate data sources into a coherent framework and describes some work underway to overcome these issues, utilising semantic web technologies and linked data. The Semantic Web is an extension of the current web in which information is given well-defined meaning, better enabling computers and people to work in cooperation [6] enabling data to be shared and reused more easily.
SEMANTIC WEB TECHNOLOGIES
Originally, the web consisted of a web of documents, linked together using hyperlinks. In this way, all manner of data formats such as PDFs, Word documents, spread-sheets and HTML pages could be linked together. Over time, people started to link actual pieces of data together using Resource Description Framework (RDF) triples [7], creating a web of data. Links can be made in this semantic web of data using uniform resource indicators (URIs) and the hypertext transfer protocol (HTTP). By following the four listed principles of linked data, semantic web technologies can be used to expose, share and connect various types of data in a cloud of linked data:
Use URIs as names for things;
Use HTTP URIs so that people can look up those names (dereferencing);
When someone looks up a URI, provide useful information, using the standards (RDF, SPARQL) [8];
Include links to other URIs.
Taking the case of the typical modern facility, all manner of data is captured, stored, accessed and dumped throughout the lifecycle of the building. Very little of this data is shared across domains and is often just used for a specific purpose and then discarded. Capturing many of these domains in a BIM infrastructure is impractical, but these domains can be relatively easily described and
exposed using the Resource Description Framework.
For example, a space in a building is referenced in several different data domains. For example, as a researcher, I occupy the Post-Grad Researcher space in my building. This relationship can be described using the subject-object-predicate triple framework of RDF.
Subject=’Post-Grad Research Room’ Predicate=’isOccupiedBy’
Object=’Edward Corry’
This type of information might be generated by the human resources domain and describe a particular space in terms of its occupants. The building management domain may also describe the same space in terms of the HVAC equipment servicing the space.
Subject=’Post-Grad Research Room’ Predicate=’isServedBy’
Object=’AHU1”
Similarly, the information technology (IT) service in the organisation might describe the space in terms of the IT equipment in the room.
Subject=’Post-Grad Research Room’ Predicate=’Contains’ Object=’ServerXXXX’
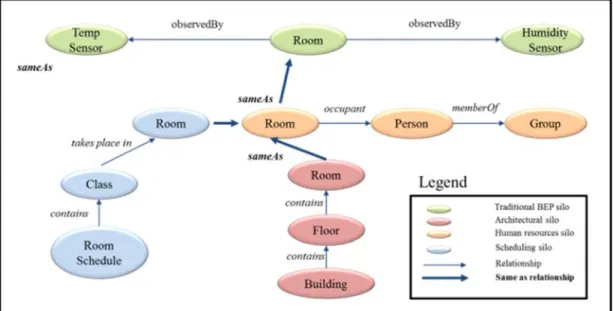
Three distinct domains in an organisation are describing the same space in three different ways. By exposing the data from each domain using RDF, we can create a data structure where links can be made between similar sources of data. Figure 2 is a representation of RDF triples from a number of different data silos, each relating to a specific room. By exposing such data in the RDF format, we can create links between otherwise unconnected pieces of data.
Semantic web technologies can be accommodated with minimal disruption to existing information infrastructure, as a complementary technology for data sharing, and should not be seen as a replacement for current IT infrastructure (e.g., relational databases, data warehouses). The objective is to expose the data within existing
Figure 1: RDF representation of data from various silos describing a room space systems, but only link the data when it needs to be
shared [9].
As part of a wider decision support framework for key building stakeholders, the paper describes a structured performance assessment of thermal comfort, utilising a variety of building data sources, including a calibrated Building Environmental Systems (BES) model, real-time BMS data and softer building data, including scheduling data and occupant feedback. Taking an existing 14000m2 naturally-ventilated university building, we illustrate how diverse building data streams might be exposed and used to drive decision support for building operators, in the area of occupant satisfaction and performance optimisation.
The paper goes on to describe some of the difficulties encountered in organising disparate data sources into a coherent framework and describes some work underway to overcome these issues, utilising semantic web technologies.
INFORMATION DEFICIT
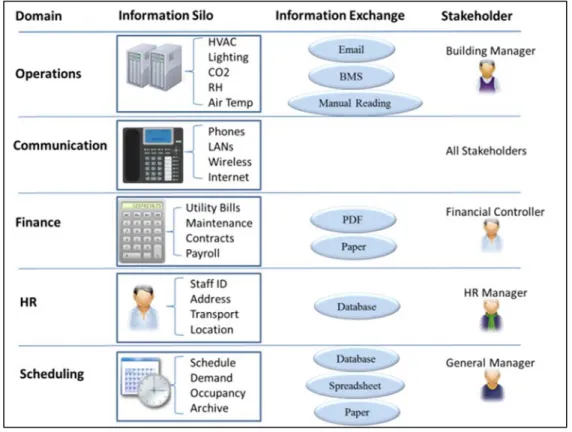
Modern buildings contain a diverse range of information domains and an acknowledged interoperability deficit exists between these domains as illustrated in Figure 2. This list of
building related data is far from exhaustive, but illustrates how the various domains independently retain an array of building related data that is mostly not integrated with the building management structure or made available on a cross domain basis.
We propose that these data sources can serve a purpose in the optimisation of building performance when incorporated into a comprehensive performance management platform [10].
There is a wide spectrum of data sources available throughout a building, even when just considering the narrow area of scheduling and occupancy patterns. Some of these sources are readily accessible and exist in a format that lends itself to analysis, whilst others require a greater degree of assessment and interpretation before they can be used to drive performance optimisation efforts. There are many examples of how cross domain data might be used in the building area [4]. Currently, human resource allocation is often carried out without reference to building operation. Building scheduling software is routinely divorced from scheduling of heating, ventilation and air conditioning (HVAC) systems. Building data tends to be created and retained within specific domains, with little interaction across other domains [11].
Figure 2: Some of the disconnected data silos across AEC domains resulting in incomplete representations of building performance
Energy Intelligence platforms pose significant technical challenges in terms of information management, cross-domain data integration, and real-time processing of sensor streams and events [5]. The emerging field of energy informatics, which applies information systems thinking and skills to increase energy efficiency [12] has a key role to play in the reduction of energy usage in a broad sense and specifically in the area of information interoperability in the AEC area. Several studies point to the significant savings available to operators of inefficient buildings by adopting performance optimisation methodologies [13,14]. Many of these approaches focus on the capture and analysis of performance data and the presentation of performance information to building operators. One such methodology is the Performance Framework Tool (PFT) [10], which allows the interpretation of whole-lifecycle building performance and simulation data in a structured manner, tailored to a variety of end user skillsets and needs.
Figure 3: Traditional information capture and
maintenance sequence in the AEC industry [15]
THE PERFORMANCE FRAMEWORK
There is a lack of focused performance information tailored to key building stakeholders. Against this backdrop, in an era of rising energy prices and more onerous legislative requirements, there is a need to do more with less energy.
One possible solution is to introduce a robust measurement framework that breaks performance measurement down to its constituent part.
Standardised performance metrics are a powerful way of quantifying building performance objectives, identifying and measuring key variables that impact on the particular performance objectives for a building [16–19].
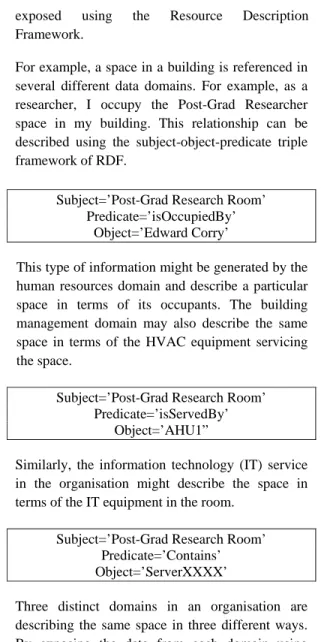
Figure 4: Scenario Modelling Framework, illustrating
performance assessment criteria for an office space The Scenario Modelling technique [20] builds on the performance metric concept by defining performance in terms of constituent performance indicators or performance objectives. These objectives identify specific performance attributes and are measureable, with performance metrics. Performance metrics, either stand-alone or processed through an algorithm, are then evaluated against an objective.
Combining these performance metrics into a robust performance assessment framework provides a drill-down capability to performance assessment, allowing building managers and owners to easily monitor the building throughout the lifecycle. The Scenario Modelling technique allows specific scenarios to be modelled, creating a combination of performance objectives, based around particular key Performance Aspects of interest to the building manager: Building Function; Thermal Loads; Energy Consumption; System Performance; Legislation.
Enabling key building stakeholders to clearly visualise key performance data at a granular level and relate this data to design intent allows the building manager to ensure building performance closely tracks design intent over time.
The scenario modelling technique is a means of organising and aggregating existing building data into a robust and usable system of metrics, which can be tailored to meet the skillset of existing staff. The successful implementation of this technique is dependent on access to key building data streams and the ability to generate cost efficient scenario models of new and existing buildings in a fast and reusable manner.
IMPLEMENTING THE PFT USING RDF
Due to the nature of the AEC industry and the manner in which buildings are envisaged, designed, constructed and operated, the industry has been slow to adopt many of the lessons learned in other heavy manufacturing industries, including modular construction, simulation modelling, integrated project delivery and building information modelling.
Throughout the building lifecycle, islands of building information are created [15,21], used and destroyed with little cross-domain sharing of this information. In recent times, the growth of Building Information Modelling (BIM) has seen a specific focus on the definition, creation and capture of building data, using proprietary and open data models [22,23]. Significant gains have been acknowledged in projects which have embraced BIM [24,25] and the BuildingSMART alliance have a clear pathway to describe the evolution of the Industry Foundation Classes (IFC). These models allow the integration of various sources of building data and considerable success has been achieved in the design and construction phases of the building life-cycle (BLC), where rapid prototyping and the use of full 3-D parameterised models allows for an agile development and construction environment with rapid and complete data sharing possibilities.
Ultimately, it is impossible to create a model which will accurately describe everything completely. The best that can be achieved is a model that describes a
particular domain from a particular perspective. Significant gains have been made in the definition of various AEC domains in IFC. Model View Definitions (MVD) are being developed to cover a multitude of areas including the various Concept Design BIM MVDs, championed by the General Services Administration (GSA) in the US [26–28]. In particular, the GSA BIM and Facility Management Guide 08 describe how the various pieces of information required during the operational phase of the lifecycle can be described using BIM.
In the case of building data, BIM was never intended to model all the relationships between data sources in the AEC domain. The rigid and extensive framework of tasks required in order to extend the IFC data model to encompass new domain information is both necessary and restrictive. Rather than viewing BIM as the complete data silo of information relating to a building, a BIM repository can be seen as one very important silo of several available in the modern facility.
With the vast quantity of data available in the modern building, it does not make sense to try to model all of this in one particular model. Instead, it is far more feasible and worthwhile to expose this data in a format that is readily accessible and utilise this information as required. The sematic web approach describes collections of web based data which can be linked together to provide a cloud of interconnected data.
PFP AND THE SEMANTIC WEB
The ultimate goal of this research is to create a performance assessment framework which incorporates diverse data streams.
The authors feel the best approach to this question is to build on the semantic web principles outlined earlier and use linked data and RDF to firstly expose building related data and secondly, to build a performance framework platform on top of this.
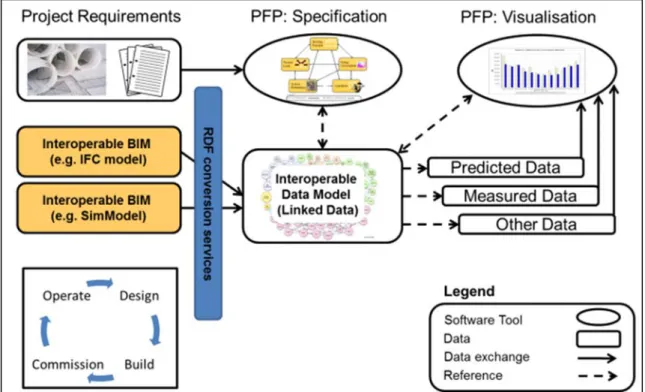
Figure 5 illustrates how a Performance Framework Platform may sit on top of several other data sources, providing a means of integration.
The platform does not modify the underlying domain but instead utilises the data available in the various silos. The data is exposed using RDF and it can then be analysed using semantic web applications, providing decision support to key building stakeholders as required.
There are a number of steps required to complete this process. Firstly, each silo of data needs to be exposed in RDF and made accessible to future semantic web applications. Once this data is available in RDF, it can be said to be in a data-space. Links can then be made between entities in this space.
Some conversion tools and ontologies already exist which allow the conversion of specific data formats to RDF. For example, the IFCtoRDF converter [29] converts building information models in the IFC format to RDF, iCal to RDF is a means of converting calendar and schedule data to RDF and the Semantic Sensor Network (SSN) ontology [30] describes sensor structures using as OWL ontology. In the case of simulation data, work is underway to describe an ontology to convert SimModel data to RDF.
Some research effort has already gone into the area of creating a linked energy cloud or dataspace [9] to describe this collection of energy related data available in RDF format, and utilises a complex event processing engine to make sense of this data in real time.
PFT ONTOLOGY
An ontology is a specification of a
conceptualization
[31]
and is used to formallydescribe the concepts and relationships inherent in a particular domain. The W3C OWL 2 Web Ontology Language (OWL) is a Semantic Web language designed to represent rich and complex knowledge about things, groups of things, and relations between things
[32]
.Figure 5: PFP: A life cycle specification, acquisition & communication suite for building performance Figure 5 illustrates how a linked data-space might
be created by transforming various data sources into RDF. In order for this interoperable data model to be utilised accurately, a sematic web based tool is needed to interpret the various RDF triples found in the data-space.
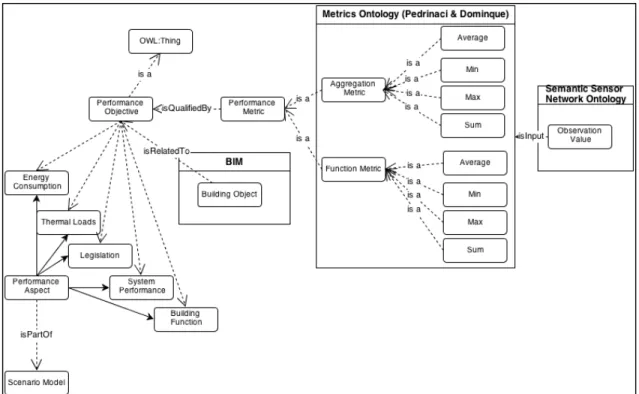
An ontology is needed to describe the overall domain in which the PFT resides. This ontology can then be related to other existing, formal ontologies. For instance, the Semantic Sensor Network is an ontology that describes describe sensors in terms of capabilities, measurement processes, observations and deployments
[30]
. The IFCtoRDF conversion service is a tool developed to convert IFC format building information models into RDF format [29], whilst the Ontology-based metrics computation for business process analysis [33] details a comprehensive ontology for the assessment of business processes.All of these ontologies and others are at varying degrees of development, but one of the key cornerstones of the semantic web is the reuse of information. In this way, domains previously described can be reused again in a separate project. The authors are currently in the process of describing an ontology which frames the
performance framework concept in semantic terms. Figure 7 is an illustration of a simplified performance framework ontology and the interaction with other, existing ontologies.
Running in parallel with this work is the development of a toolkit to access semantic data using the performance framework ontology.
ILLUSTRATION OF CONCEPT
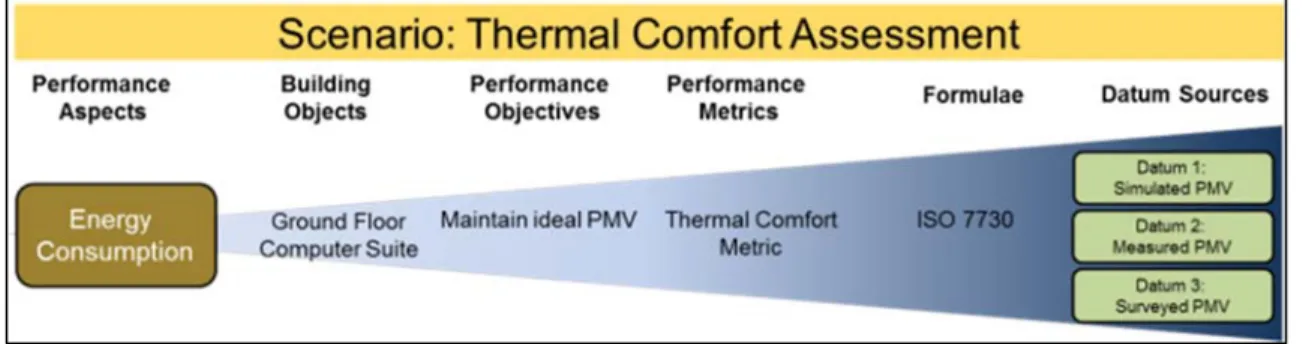
We now illustrate the concept the concept of scenario modelling, by describing how a thermal comfort assessment of a zone might form part of an overall performance assessment framework.
Figure 6: New Engineering Building (NEB) at the
Figure 7: Simplified PFT ontology and relationship with other existing ontologies The building in question is a 14,000 m2 engineering
faculty building at the National University of Ireland, Galway. A brand new building, it was designed with a strong focus on sustainability and has number of complex HVAC systems in place. The building is largely naturally ventilated and benefits from large climate façade to the south and is designed to use mechanical ventilation less than 10% of the time.
Although the building is operational for over 2 years, there are a number of occupant complaints about the environmental conditions in the building, particularly relating to thermal comfort. The building is remotely managed and this process relies on BMS data such as CO2 level, room temperature and relative humidity. The building has a building manager who fields complaints and comments on building performance.
Some spaces in the building are deemed to be uncomfortably hot at various times and the natural ventilation system does not seem to take this into account and cause the air handing units to take effect.
We carried out an extensive thermal comfort assessment in the ground floor computer suite to try to understand how this space was performing and if
we could describe this performance in terms of a performance metric and then publish this metric in RDF.
The 80 space computer suite at the southeast corner of the building has long been a source of complaint in the building Figure 8.
Figure 8: Ground floor computer suite
We carried out three types of assessment on the space to ascertain the thermal comfort levels:
A measurement based PMV, based on the EN ISO 7730 standard;
A survey-based PMV assessment;
A simulation based PMV.
Each of these assessments of thermal comfort generated a PMV figure for the space and the methodology used is described in detail in [34]
Figure 9: Thermal Comfort Performance Metric
Using, these data streams, it is possible to create a performance metric relating to thermal comfort for the space.
THERMAL COMFORT
PERFORMANCE METRIC
The three streams of data each give an indication of thermal comfort and in the case of the measured result, are based on a host of contributory parameters, including air velocity, radiant temperature, air temperature, relative humidity, clothing level and metabolic level.
We can design a performance metric to capture this information and illustrate it to the building manager stakeholder.
Figure 9 illustrates how a thermal comfort performance metric might look for the space. The building manager is able to visualise three sets of data from the space in a structured manner and can quickly identify if a there is cause for concern or not. [34]has illustrated clearly how each of these data streams are produced and calculated, according to the relevant standards.
If an issue is evident from the thermal comfort metric, the building manager can then drill down through the other building metrics to check the various other performance indicators in the space and if they are outside tolerance with the design data for the space.
One of the key deliverables of the PFP is the ability to visualise data in context [35]. For instance, it is not particularly helpful to just see a temperature reading for a particular space or an energy usage intensity (EUI) figure for a system in the building, in isolation. These pieces of data take on greater meaning when they can be viewed in the context of other data relating to the same issue. In the case of
the thermal comfort case study, the PFT is able to graphically visualise similar data streams, allowing for greater interpretation and fault detection. In order for the PFT to achieve this transformation of data, the separate data sources need to be available and accessible. By the same token, existing technologies can be leveraged to allow the transformation of building information models and simulation models to RDF. With this information available in the semantic web, the PFP can be used to query this interoperable information through the scenario modelling framework.
CONCLUSION AND FURTHER WORK
This paper outlines a case for the use of semantic web and linked data technologies to overcome long recognised interoperability issues with cross domain data sharing in the AEC industry.
The paper goes on to explain how building performance could be assessed using a structured performance assessment framework and how this framework could be driven by semantic web technologies.
The concept is illustrated by means of a thermal comfort study of a building space which is used to create a performance objective.
Currently, the research effort is focussing on the generation of an OWL ontology to describe the PFP and the reconfiguration of an existing PFP tool to utilise this ontology as an internal data model.
ACKNOWLEDGEMENTS
REFERENCES
[1] European Union. European Union, 2002. European Performance of Buildings Directive, Available at:
http://europa.eu/legislation_summaries/other/ l27042_en.htm [Accessed Feb 21 2011]. 2002.
[2] USGBC. LEED 2009.
[3] Turner C, Frankel M. Energy Performance of LEED for New Construction Buildings. New Buildings Institute; 2008.
[4] O’Donnell J, Corry E, Hasan S, Keane M, Curry E. Building Performance Optimization Using Cross-Domain Scenario Modeling, Linked Data, and Complex Event Processing. Build Environ 2013.
[5] Curry E, O’Donnell J, Corry E, Hasan S, Keane M, O’Riain S. Linking building data in the cloud: Integrating cross-domain building data using linked data. Adv Eng Informatics 2013;27:206–19.
[6] Berners-Lee T, Hendler J, Lassila O. The Semantic Web. Sci Am 2001:29–37. [7] Berners-Lee T, Fielding R, Masinter L.
Uniform resource identifiers (URI): generic syntax 1998.
[8] Prud’Hommeaux E, Seaborne A. SPARQL query language for RDF, W3C Working Draft 4 2008.
[9] Curry E, Hasan S, O’Riain S. Enterprise energy management using a linked dataspace for Energy Intelligence. Sustain Internet ICT Sustain Sustain 2012 4:1–6.
[10] O’Donnell J. Specification of Optimum Holistic Building Environmental and Energy Performance Information to Support Informed Decision Making. Doctorate. Department of Civil and Environmental Engineering, University College Cork, Ireland, 2009.
[11] BuildingSMART. National BIM Standard - United States. 2012.
[12] Watson RT, Boudreau M-C, Chen AJ. Information systems and environmentally sustainable development: energy informatics and new directions for the IS community. MIS Q 2010;34:23–38.
[13] Liu M, Claridge DE, Turner WD. Continuous Commissioning of Building Energy Systems. J Sol Energy Eng 2003;125:275.
[14] Neumann C, Jacob D. Building EQ- WP3“Requirements for Data and
Measurement Equipment.” Fraunhofer ISE; 2007.
[15] Corry E, Keane M, O’Donnell J, Costa A. Systematic development of an operational BIM utilising simulation and performance
data in building operation. IBPSA Build. Simul. 2011, Sydney: IBPSA 2011; 2011. [16] Fowler KM, Solana AE, Spees K. Building
Cost and Performance Metrics:Data Collection Protocol. Pacific Northwest National Laboratory; 2005.
[17] O’Sullivan D, Keane M, Kelliher D, Hitchcock RJ. Improving Building Performance by Tracking Performance Metrics throughout the Building Life Cycle (BLC). Energy Build 2004;36 (11):1075–90. [18] Deru M, Torcellini P. Performance Metrics
Research Project – Final Report. NREL; 2005.
[19] Hitchcock RJ. Standardized Building Performance Metrics. Berkeley, California: Lawrence Berkeley National Laboratory; 2003.
[20] O’Donnell J, Keane M, Morrissey E, Bazjanac V. Scenario modelling: A holistic environmental and energy management method for building operation optimisation. Energy Build 2013;62:146–57.
[21] BuildSMART. buildingSMART alliance | The National Institute of Building Sciences. buildingSMARTalliance 2011.
[22] Bentley. Does the Building Industry Really Need to Start Over - A response from Bentley to Autodesk’s BIM/Revit Proposal for the Future. Bentley, available online at http://www.bentley.com/files/industry_group s/building/BIM_white_paper.pdf; 2003. [23] IAI. buildingSMART. IFC2x Edition 3. final
documentation available at http://www.iai-international.org/Model/R2x3_final/index.ht m; 2006.
[24] Jones S. Building Information Modelling (BIM). Penn Plaza, New Yok: McGraw-Hill Construction; 2008.
[25] Jones SA. The Business Value of BIM in Europe. Bedford, MA: McGraw-Hill Construction; 2010.
[26] GSA. 3D-4D Building Information Modeling 2010.
[27] See R. Concept Design BIM 2010. IFC Solutions Factory; 2010.
[28] See R. Building Information Models and Model Views. J Build Inf Model 2007;Fall 2007.
[29] Pauwels P, Van Deursen D, Verstraeten R, De Roo J, De Meyer R, Van de Walle R, et al. A semantic rule checking environment for building performance checking. Autom Constr 2011;20:506–18.
[30] Compton M, Barnaghi P, Bermudez L, García-Castro R, Corcho O, Cox S, et al. The SSN ontology of the W3C semantic sensor network incubator group. Web Semant Sci Serv Agents World Wide Web 2012;17:25– 32.
[31] Gruber TR. A Translation Approach to Portable Ontology Specifications. Knowl Acquis 1993;5:199–220.
[32] Hitzler P, Krotzsch M, Parsia B, Patel-Schneider P, Rudolph S. OWL 2 Web Ontology Language Primer (Second Edition). W3C: W3C; 2012.
[33] Pedrinaci C, Domingue J. Ontology-based metrics computation for business process analysis. Proc. 4th Int. Work. Semantic Bus. Process Manag., Crete, Greece: 2009.
[34] Coakley D, Corry E, Keane M. Validation of Simulated Thermal Comfort using a
Calibrated Building Energy Simulation (BES) model in the context of Building Performance Evaluation & Optimisation, Montreal Canada: 2013.
[35] O’Donnell J, Maile T, Haves P. A Visualization Environment for Analysis of Measured and Simulated Building
![Figure 4: Scenario Modelling Framework, illustrating performance assessment criteria for an office space The Scenario Modelling technique [20] builds on the performance metric concept by defining performance in terms of constituent performance indica](https://thumb-us.123doks.com/thumbv2/123dok_us/698990.2586249/5.918.144.432.278.515/modelling-framework-illustrating-performance-performance-performance-constituent-performance.webp)