A Hands on Guide to Google Data
Hal Varian
Seth Stephens-Davidowitz
Google,Inc.
Three Google tools for social science research
Google Correlate Shows the queries that are most correlated with
cross-section (state) or time series (weekly/monthly) data.
Google Trends Shows an index of activity for specific queries or
categories of queries.
Google Consumer Survey Lightweight, quick and inexpensive
Correlate: predict house sales over time
• Go to FRED
• Download “New One Family Houses Sold” from 2004 to present
• Clean up CSV file, upload to Google Correlate
• Examine plots
Find best predictors using BSTS
In-sample fit with BSTS
Out-of-sample prediction using regression
• AR1 regression with contemporaneous query data
yt =yt−1+xt+et one-step ahead prediction
House price declines by state (cross section)
• Use Google Correlate as before, but now by state
• Here is comparison of price declines and query [short sale process]
Find predictors using spike-slab
pool.heater short.sale.process harp.3.0 toontown.invasion toontown.invasion.tracker underwater.mortgage Inclusion Probability 0.0 0.2 0.4 0.6 0.8 1.0Apply some judgment
twilight.zone.tower.of.terror pool.heater harp.3.0 short.sale.process Inclusion Probability 0.0 0.2 0.4 0.6 0.8 1.0What queries are predictive of short lifespan?
3/17/2014 negative life expectancy - Google Correlate
https://www.google.com/trends/correlate/search?e=id:vs1wQ1crZMx&t=all#default,90 1/4 Correlated with negative life expectancy 0.9092blood pressure medicine 0.8985obama a 0.8978major payne 0.8975against obama 0.8936king james bible online 0.8935about obama 0.8928prescription medicine 0.892040 caliber 0.8919.38 revolver 0.8916reprobate 0.8911performance track 0.8910lost books of the bible 0.8905glock 40 cal 0.8898lost books 0.8896the mark of the beast 0.8892obama says 0.8891obama said 0.8882sodom and 0.8882the antichrist 0.8865globe life 0.8858the judge 0.8834hair pics 0.8833medicine side effects 0.8829momma 0.8828james david 0.8823flexeril Compare US states Compare weekly time series Compare monthly time series Documentation Comic Book FAQ Tutorial Whitepaper Correlate Algorithm Correlate Labs Search by Drawing Search correlations Edit this data
[email protected] | Manage my Correlate data | Sign out
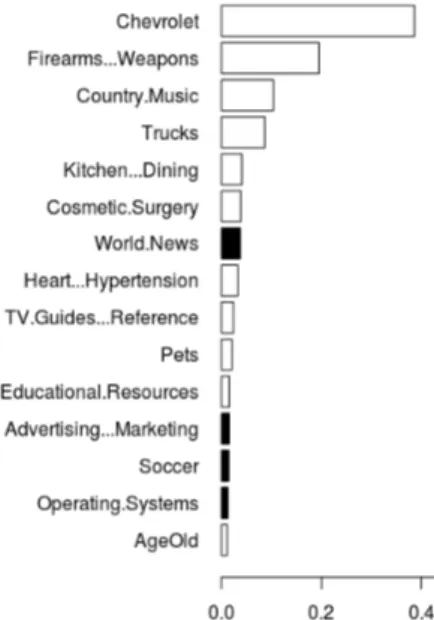
Predictors of short lifespan?
X40.caliber gunshot.wounds blood.pressure.medicine full.figured.women obama.says Inclusion Probability 0.0 0.2 0.4 0.6 0.8 1.0Question about hangovers
What day of the week has the most queries for [hangover]?
• Monday • Tuesday • Wednesday • Thursday • Friday • Saturday • Sunday
Initial claims for Unemployment Benefits
• One-week ahead forecast using query [filing for unemployment]
• Baseline is AR(1) model
2004 2006 2008 2010 2012 −1 0 1 2 3 4 5 Index z actual base trends
How does unemployment insurance affect job search?
• Scott Baker and Andrey Fradkin, SSRN 2251548
• Measure job search intensity using Google searches for [jobs -steve]
• Individuals on UI search 30% less than unemployed not on UI
• Searches close to UI exhaustion search twice as much as those with 30 weeks remaining
How many votes did Obama lose due to racism?
• Looks at Democratic votes in 2004 compared to 2008
• Looks at racist queries by location using Google Trends
• “The higher the racially charged search rate in an area, the worse Mr. Obama did.”
Example surveys
• If you were asked to use one of these commonly used names for social classes, which would you say you belong in?
• Do you support Obama or Romney in the upcoming election?
• I prefer to buy products that are assembled in America. [Agree or disagree]
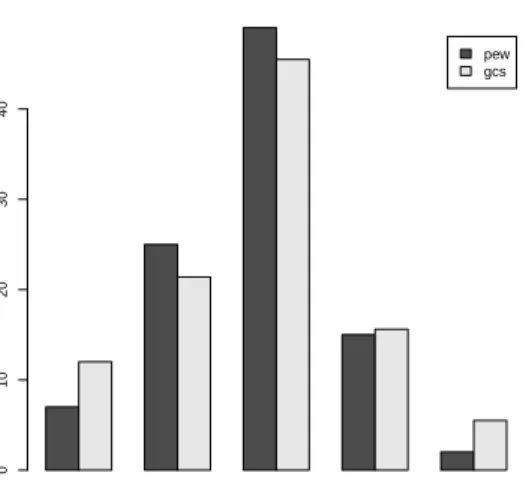
Social class Pew Foundation and GCS
lower lower.middle middle upper.middle upper
pew gcs 0 10 20 30 40
Survey amplification
1. Run a GCS asking “Do you support Obama in the upcoming election?”
2. Associate each (yes,no) response in the survey data to the city associated with the respondent.
3. Build a predictive model for the responses using the Trends category data described above.
4. The resulting regression can be used to extrapolate survey responses to any other geographic region using the Google Trends categories associated with that city.
“I prefer to buy products that are assembled in America”
Where is this message predicted to resonate?
Most in favor Kernshaw, SC; Summersville, WV; Grundy, VA;
Chesnee, SC; Duffield, VA; Norton, VA; Jonesville, VA; Walnut Cove, NC; Weston, WV; Ennice, NC . . .
Least in favor Calipatria, CA; Fremont, CA; Mountain View, CA;
San Jose, CA; Berkeley, CA; Redmond, WA; Glendale, CA; Cupertino, CA; Palo Alto, CA; Daggett, CA . . .