Performance of Hybrid Sentiment
Classification Model on Online Product
Reviews
G.Vinodhini a, RM.Chandrasekaran b a
Assistant Professor, Department of Computer Science and Engineering, Annamalai University, Annamalai Nagar-608002, India.
b
Professor, Department of Computer Science and Engineering, Annamalai University, Annamalai Nagar-608002, India. Abstract
Sentiment classification attempts to identify the sentiment polarity of a given text as either positive or negative. Much of the work has been focused on Sentiment classification using machine learning methods in last decades. Analyzing and predicting the polarity of the sentiment plays an important role in decision making. Related work about hybrid methods contributing to sentiment classification are still limited and more extensive experimental work is needed in this area. In this study sentiment classification is done using hybrid method with support vector machine (SVM) as base classifier. The results show that hybrid model performs better in terms of error rate and receiver operating characteristics curve (ROC) for various sampling methods.
Keywords: sentiment, classifier, opinion, learning ,reviews.
1. NTRODUCTION
With the rapid growth of e-commerce and huge number of online reviews in digital form, the need to organize them arises. The sentiment expressed in product reviews provides valuable information to consumers as well as major online retailers (Kim and Hovy, 2006; Pang et al.,2002). Prior research has also found that consumers find the user generated reviews more trustworthy to make their purchasing decision (Pang et.al., 2002). Sentiment analysis is often conducted at one of the three levels: the document level, sentence level, or attribute level. A document opinionated as positive or negative on a particular object does not mean that the document has positive opinions or negative opinion only on all aspects or features of the object. In typical case, the document has both positive and negative aspects of the object, although the general sentiment on the object may be positive or negative. Document-level and sentence-level classification does not provide such information. (Liu, 2009) Thus, our focus is on feature-based sentence level sentiment classification.
Various machine learning classifiers have been used in sentiment classification. Many works in machine learning communities have shown that combining individual classifiers is an effective technique for improving classification accuracy (Melville et al., 2009; Rui Xia, 2011). There are different ways in which classifier can be combined to classify new instances. In this work, we introduce a hybrid classifier based sentiment classification for online product reviews using the product attributes as features. The results are compared with individual statistical model i.e. Support vector machine (SVM). To analyze the relationship a word vector models is developed (Model I) using only unigram product attributes as feature for classification.
This paper is outlined as follows. Section 2 narrates the related work. The data source used is reported in Section 3. Section 4 discusses the methodology used to develop the models. Section 5 presents the various methods used for evaluation and classification. Section 6 summarizes the results and Section 7 concludes our work.
2. REVIEW OF LITERATURE
Much research exists on sentiment analysis of user opinion data, which mainly judges the polarities of user reviews. The machine learning approach applicable to sentiment analysis mostly belongs to supervised learning. Machine learning techniques like Naive Bayes (NB) and support vector machines (SVM) have achieved great success in text classification. The other most well-known machine learning methods in the natural language processing area are K-Nearest neighbourhood, ID3, C5, centroid classifier, maximum entropy and winnow classifier(Songho tan, 2008 and Rudy Prabowo, 2009) .Naive Bayes is a simple but effective classification algorithm. The Naive Bayes algorithm is widely used algorithm for text sentiment classification (Melville et al., 2009; Rui Xia, 2011; Ziqiong, 2011; Songho tan, 2008 and Qiang Ye, 2009). Support vector machines (SVM), a discriminative classifier is considered the best text classification method (Rui Xia, 2011; Ziqiong, 2011; Songho tan, 2008 and Rudy Prabowo, 2009). Multiple variants of SVM have been developed in which Multi class SVM is used for Sentiment classification (Kaiquan Xu, 2011). Previous work, however, ignores an efficient integration of multiple classifier methods to improve the sentiment classification
performance. The performance of classification algorithms is also domain-dependent (B. Pang, L. Lee, S. Vaithyanathan,2002; H. Cui, V. Mittal, M. Datar,2006).Among different classification algorithms, which one performs consistently better than the others remains a matter of some debate.
There are some existing studies on mining customer opinions on product reviews (M. Chau, J. Xu,2007; H. Chen,2006; B. Pang, L. Lee,2008; T.S. Raghu, H. Chen,2007).However, these studies mainly focus on identifying customer’s sentiment polarities toward products using single classifier. We therefore intuitively seek to integrate classification algorithms in an efficient way in order to overcome their individual drawbacks and to increase the accuracy, and finally enhance the sentiment classification performance (Rudy Prabowo, 2009). In this paper, we aim to make an intensive study of the effectiveness of hybrid classifier technique for sentiment classification tasks.
3. DATA SOURCE
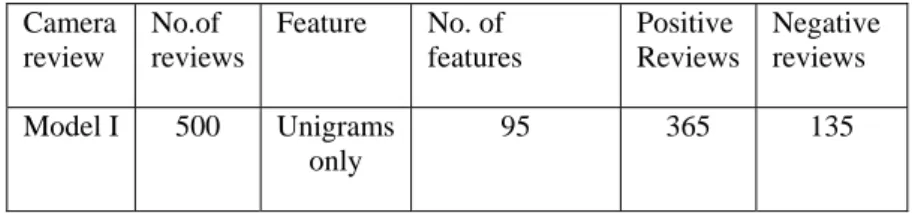
The data set used contains product reviews sentences which were labeled as positive, negative or neutral. We collected the review sentences from the publicly available customer review dataset. This data set can be downloaded from http://www.cs.uic.edu/~liub/FBS/FBS.html. This dataset contains annotated customer reviews of 5 different products. From those five products we have selected reviews of two different digital cameras (Canon G3 and Nikon coolpix 4300). There are 988 annotated reviews and the data is presented in plain text format. This data set has been employed to analyze the performance of sentiment classification [Hu, and Liu, 2005; Hu, and Liu,2006] . For our binary classification problem, we have considered only 365 positive reviews and 135 negative reviews. The product attribute discussed in the review sentences are collected for each of the positive and negative review sentences. Unique unigram product features alone are grouped, which results in a final list of product attributes (features) of size 95. In terms of these, the descriptions of review dataset model (Model I) to be used in the experiment are given in Table
Table 1. Description of dataset (Model I)
4. METHODOLOGY
We used the following methodology to develop the prediction models with unigram word features. The following is the summary of our methodology for developing and validating the prediction models.
i.Perform pre-processing and segregate unigram features (product attributes) as bag of words (mentioned in Section 3).
ii.Develop word vector for Model using pre-processed reviews and unigram product features (Model I). iii.Develop the classification models
a. Develop the Support vector machine model.
b. Develop the hybrid classifier model using SVM and Naive Bayes.
iv.Predict the class (positive or negative) of each review in the test data set using various evaluation methods for (Model I).
a. Linear sampling b. Random sampling c. Bootstrap sampling v.Compare the prediction results with actual values.
vi.Compute the quality parameters – Type I error, Type II error & error rate Compare the performance of the two methods for various evaluation methods for Model I.
A word vector representation of review sentences is created for Model I using the unigram features. The word vector set can then be reused and applied for various classifications. To create the word vector list, the review sentences are pre-processed. The following are the steps done in data pre-processing. Tokenize to split the texts of a review sentence. Transform the upper case letters to lower case to reduce ambiguity. Then stop words are filtered to removes common English words. Porter stemmer is the used for stemming to reduce words to their base or stem.
After pre-processing, the reviews are represented as unordered collections of words and the features (Unigram) are modeled as a bag of words. A word vector is created for Model I using the respective features
Camera review No.of reviews Feature No. of features Positive Reviews Negative reviews Model I 500 Unigrams only 95 365 135
5. METHODS 5.1. Classification Methods
This section discusses the methods used in this work to develop the prediction system. The statistical approach based SVM and proposed hybrid classifier approach are employed using weka tool.
a. SVM
Support Vector Machines are powerful classifiers arising from statistical learning theory that have proven to be efficient for various classification tasks in text categorization. Support vector machine belong to a family of generalized linear classifiers. It is a supervised machine learning approach used for classification to find the hyper plane maximizing the minimum distance between the plane and the training points. An important property of SVMs is that they simultaneously minimize the empirical classification error and maximize the geometric margin; hence known as maximum margin classifiers. The SVM model is employed using Weka tool. The kernel type chosen is polynomial kernel with default values for other parameters.
b. Proposed Hybrid Classifier
In proposed hybrid scheme, there are two level models which are set of base models are called level-0, and the meta-model level-1. The level-0 models are constructed from samples of a dataset, and then their outputs on a hold-out dataset are used as input to a level-1model. The task of the level-1 model is to combine the set of outputs so as to correctly classify the target, thereby correcting any mistakes made by the level-0 models. The hybrid algorithm is shown in Fig 1.
Fig1. Hybrid Algorithm
The model proposed is employed using Weka tool. SVM is used a level 1 classifier and SVM , NB are used as level 0 classifier. Other parameters for classifier use the default values available in the tool. Ten fold cross validation is used.
5.2. Evaluation Methods
Evaluating the performance of data mining technique is a major fundamental aspect of machine learning. Evaluation method determines the efficiency and performance of any model. The Evaluation methods used in our work are discussed below. A cross-validation is performed in order to estimate the statistical performance of a learning operator. It is mainly used to estimate how accurately a model will perform in practice. The input dataset is partitioned into k subsets of equal size. Of the k subsets, a single subset is retained as the testing data set, and the remaining k − 1 subsets are used as training data set. The cross-validation process is then repeated k times, with each of the k subsets used exactly once as the testing data. The k results from the k iterations then can be averaged to produce a single estimation. The proposed hybrid classifier approach is cross validated using several types of sampling for building the subsets.
Input : Data set D=
; 2 2 1 1,y , x ,y , , xm,ym x First-level learning algorithms A1,,AT; // SVM, NB Second-level learning algorithms A. //SVM
Process: for i 1,,T:
D
A
h
i
i /* Train a first-level individual leaner hi by applying thefirst-level */
end; // learning algorithm Ai to the original data set D ;
'
D // Generate a new data set
for j1,,m:
ji ji
h
x
z
/*Use hi to classify the training example xj*/end;
Zj Zi ZjT yj
U D D' ' 1, 2, , end.
'. ' ADh /* Train the second-level learner h'by applying the second-level learning algorithm A to the new set D */ '
Output : h x h x h x O( ) ' 1 ,, T
a. Linear sampling: The Linear sampling simply divides the input dataset into partitions without changing the order of the examples i.e. subsets with consecutive examples are created.
b. Random sampling: The random sampling builds random subsets of the input dataset. Samples are chosen randomly for making subsets.
c. Bootstrap sampling: The bootstrap sampling builds random subsets and ensures that the class distribution in the subsets is the same as in the whole input dataset. In the case of a binominal classification, bootstrap sampling builds random subsets such that each subset contains the same proportions of the two values of class labels.
5.3. Evaluating the accuracy of the model
The validity of the prediction models varies greatly. Many approaches for evaluating the quality of the prediction models are used. One among them is cross validation. In this work the results obtained for the test data set are evaluated using the following parameters.
a. Misclassification rate
Misclassification rate is defined as the ratio of number of wrongly classified modules to the total number of modules classified by the prediction system. The wrong classifications fall into two categories. If negative reviews are classified as positive (C1), it is named as Type I error. If positive are classified as negative (C2), it is named as Type II error.
1 . 2 . 1 2 .
b. Receiver Operating characteristics Curve (ROC)
ROC curves are very popular for performance evaluation. The ROC curve plots the false positive rate (FPR) on the x-axis and true positive rate (TPR) on the y-axis. The FPR measures the fraction of negative examples that are misclassified as positive. The TPR measures the fraction of positive examples that are correctly labeled. TPR and FPR are calculated with the following formulas:
True Positive Rate TruePositive
TruePositive FalseNegative 100
False Positive Rate FalsePositive
FalsePositive TrueNegative 100
The diagonal divides the ROC space. Points above the diagonal represent good classification result and points below the diagonal line represent poor results. The closer the ROC curve is to the upper left corner, the higher the overall accuracy of the test.
6. Results & Discussion
The prediction systems are developed using each of the methods discussed in Section 5 for the Model I. The results are compared to the actual opinion and the error parameters are computed using tenfold cross validation. Tables 2 shows the classification results of positive and negative review. Tables 2 summarize the misclassification results i.e Type I error, Type II error and overall error rate.
Model Sampling Method SVM Hybrid classifier SVM
Type I Error (%) Type II Error(%) Error rate(%) Type I Error(% ) Type II Error(%) Error rate(%) Model I Linear Sampling 22 27.2 24.6 20.7 25.3 23.0 Random Sampling 21.6 26.3 23.9 19.9 23.1 21.5 Bootstrap Sampling 19.7 23.7 21.7 17.8 20.6 19.2
Table 2. Results of 10-fold Cross validation
Table 2 presents the results obtained by tenfold cross validation of SVM and hybrid classifier model with various sampling methods . Among Type I error and Type II error, Type I error is very less for all classifier with various sampling methods. This shows that the classifiers perform better in identifying the positive reviews. Even though the Type I errors are lesser, (which is advantageous) the error rate is high due to the high values of Type II error. The overall misclassification rate and Type I & II error is reduced considerably for both models
sampling is used. Among classification methods used, the hybrid classifier approach performs better than SVM in terms of error rate,Type I and II error.
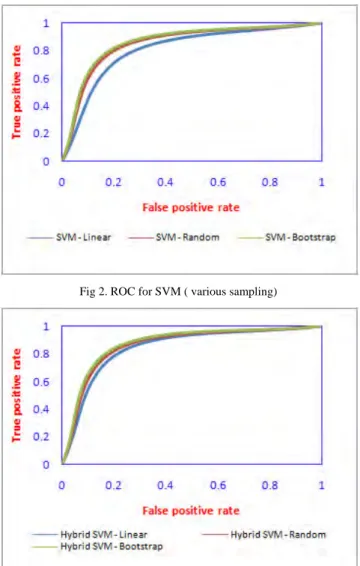
Receiver Operator Characteristic (ROC) curves are also used as an alternative metric to compare the performance of SVM and hybrid classifier models with bootstrap sampling. ROC curves are commonly used to present results for binary decision problems in machine learning. Fig 2 and Fig 3 compares the performance of classifiers with various sampling methods for svm and hybrid model using ROC curves respectively.ROC space point of bootstrap sampling is closer to prefect point (0,1) for SVM model and hybrid model.
Fig 2. ROC for SVM ( various sampling)
Fig 3. ROC for Hybrid model ( various sampling)
7. Conclusion
In the development of prediction models to classify the reviews, reliable approaches are expected to reduce the misclassifications. In this paper, a hybrid classifier with bootstrap sampling based approach, which perform better than the statistical approaches is introduced. Among the classification methods used, the hybrid classifier method was highly robust in nature for model which was studied through the error parameters and ROC curves. It could happen that a large number of negative reviews were classified into positive category because the dataset slightly was positively skewed. The accuracy of hybrid classifier methods can be increased by increasing the number of classifiers. Further work needs to be done to improve the classification accuracy of negative opinion and the inclusion of n-gram attributes may also be considered.
References
[1] Ahmed, A., Chen, H., & Salem, A. (2008). Sentiment analysis in multiple languages: feature selection for opinion classification in web
forums. ACM Transactions on Information Systems, 26(3).
[2] Aue, A., & Gamon, M. (2005). Customizing sentiment classifiers to new domains: A case study. In Proceedings of RANLP.
[3] B. Liu, M. Hu, J. Cheng, Opinion observer: analyzing and comparing opinions on the Web, in: A. Ellis, T. Hagino (Eds.), Proceedings
of the 14th International World Wide Web Conference, Chiba, Japan, 2005, pp. 342–351.
[4] Beineke, P., Hastie, T., Vaithyanathan, & S. (2004). The sentimental factor: Improving review classification via
human-provided information. In Proceedings of the 42nd ACL conference.
[5] B. Pang, L. Lee, Opinion mining and sentiment analysis, in: J. Callan, F. Sebastiani (Eds.), Foundations and Trends in Information
Retrieval, 2, Now Publishers, 2008.
[6] G.B. Tabachnick, S.F. Linda, Using Multivariate Statistics, fourth ed., Boston, 2001.
[7] H. Chen, Intelligence and security informatics: information systems perspective,Decision Support Systems 41 (3) (2006).
[8] H. Cui, V. Mittal, M. Datar, Comparative experiments on sentiment classification for online product reviews, in: Proceedings of the
Twenty-First National Conference on Artificial Intelligence (AAAI), 2006.
[9] Hu, and Liu, “Opinion extraction and summarization on the web”, AAAI., (2006), pp. 1621-1624.Hu, and Liu, “Mining and
summarizing customer reviews”, Proceedings of the tenth ACM SIGKDD International Conference on Knowledge Discovery and Data Mining, Seattle, WA, USA, 2005,pp. 168–177.
[10] Hu, Liu and Junsheng Cheng, “Opinionobserver: analyzing and comparing opinions on theWeb”, Proceedings of 14th international
Conference onWorldWideWeb, pp. 342-351, Chiba, Japan, 2005.
[11] J. Kittler, Combining classifiers: a theoretical framework, Pattern Analysis and Applications 1 (1998) 18–27.
[12] Kennedy, A., & Inkpen, D. (2006). Sentiment classification of movie reviews using contextual valence shifters. Computational
Intelligence, 22(2), 110–125.
[13] Kim and E. Hovy 2006. Automatic identification of pro and con reasons in online reviews, in Proceedings of the COLING/ACL Main
Conference Poster Sessions, pp. 483–490.
[14] L. Briand, J. Wust, J. Daly, D. Victor Poter, Exploring the relationships between design measures and software quality in
object-oriented systems, Journal of Systems and Software 51 (2000) 245–273.
[15] Liu. 2009. Sentiment Analysis and Subjecivity, To appear in Handbook of Natural Language processing,Second Edition, (editors: N.
Indurkhya and F. J.Dameerau), 2009 or 2010
[16] M. Chau, J. Xu, Mining communities and their relationships in blogs: a study of online hate groups, International Journal of Human–
Computer Studies 65 (1) (2007).
[17] M. Whitehead, L. Yaeger, Sentiment mining using ensemble classification models, in: International Conference on Systems,
Computing Sciences and Software Engineering (SCSS 08), Springer, 2008.
[18] Melville, Wojciech Gryc, “Sentiment Analysis of Blogs by Combining Lexical Knowledge with Text Classification”, KDD’09, June
28–July 1, 2009, Paris, France.Copyright 2009 ACM 978-1-60558-495-9/09/06.
[19] Mullen, T., & Collier, N. (2004). Sentiment analysis using support vector machines with diverse information sources. In Proceedings
of EMNLP-2004, Barcelona,Spain (pp. 412–418).
[20] Pang, Bo., & Lee, L. (2004). A sentimental education: Sentiment analysis using subjectivity summarization based on minimum cuts. In
Proceedings 42nd ACL,
[21] Pang, Bo., Lee, & L., Vaithyanathan, S. (2002). Thumbs up? Sentiment classification using machine learning techniques. In
Proceedings of the 2002 conference on empirical methods in natural language processing (EMNLP) (pp. 79–86).
[22] Rudy Prabowo, Mike T Barcelona, Spain (pp. 271–278).helwall, “Sentiment analysis: A combined approach .”, Journal of Informetrics
3 (2009) 143–157.
[23] Rui Xia , Chengqing Zong, Shoushan Li, “Ensemble of feature sets and classification algorithms for sentiment classification”,
Information Sciences 181 (2011) 1138–1152.
[24] Salvetti, F., Lewis, S., & Reichenbach, C. (2004). Automatic opinion polarity classification of movie reviews. Colorado research in
linguistics (Vol. 17, no. 1),Boulder: University of Colorado.
[25] Songbo Tan , Jin Zhang, “An empirical study of sentiment analysis for chinese documents ”, Expert Systems with Applications 34
(2008) 2622–2629.
[26] T. Ho, J. Hull, S. Srihari, Decision combination in multiple classifier systems, IEEE Transactions on Pattern Analysis and Machine
Intelligence 16 (1994) 66–75.
[27] T.M. Khoshgoftaar, E.B. Allen, J.P. Hudepohl, S.J. Aud, Application of neural networks to software quality modeling of a very large
telecommunications systems, IEEE Transactions on Neural Networks 8 (4) (1997) 902–909.
[28] T.S. Raghu, H. Chen, Cyberinfrastructure for homeland security: advances ininformation sharing, data mining, and collaboration
systems, Decision Support Systems 43 (4) (2007).
[29] Tan, S. B., & Zhang, J. (2008). An Empirical study of sentiment analysis for Chinese documents. Expert Systems with Application,
34(4), 2622–2629.
[30] Wang, S. G., Wei, Y. J., Zhang, W., Li, D. Y., & Li, W. (2007). A hybrid method of feature selection for chinese text sentiment
classification [C]. In Proceedings of the 4th International Conference on Fuzzy Systems and Knowledge Discovery (pp. 435–439).
IEEE Computer Society.
[31] Whitelaw, C., Garg, N., & Argamon, S. (2005). Using appraisal groups for sentiment analysis. In Proceedings of CIKM-05, 14th ACM
international conference on information and knowledge management, Bremen, DE (pp. 625–631).
[32] X. Yuan, T.M. Khoshgoftaar, E.B. Allen, K. Ganesan, An application of fuzzy clustering to software quality prediction. Proceedings
of 3rd IEEE Symposium on ASSET’00, March 24–25, 2000, pp. 85–91.
[33] Ziqiong Zhang, Qiang Ye, Zili Zhang, Yijun Li, “Sentiment classification of Internet restaurant reviews written in Cantonese”, Expert