June 2015
ASSESSMENT OF THE
FEASIBILITY OF CASH
TRANSFER IN SELECTED
REFUGEE SETTLEMENTS
IN UGANDA
Koboko, Kyangwali, Kyaka II and Rwamwanja
ANALYSIS, MONITORING AND EVALUATION (AME) UNIT
WORLD FOOD PROGRAMME (UGANDA)
1 ACKNOWLEDGEMENTS
This report is the outcome of a collaborative process and would not have been possible without the contribution of many individuals.
The World Food Programme (WFP) is grateful for the support of the Government of Uganda.
In particular, the WFP Analysis, Monitoring & Evaluation (AME) unit would like to thank the WFP Sub – Office staff, district enumerators, translators and district and community leaders in Koboko, Kyangwali, Kyaka II and Rwamwanja settlements for their contributions to the assessment.
We would also like to thank the United States Agency for International Development (USAID) for enabling the AME unit of WFP Uganda to conduct this exercise.
For more information related to analysis, data collection, tools and analysis software, please contact the AME Unit, WFP Uganda:
Siddharth KRISHNASWAMY (Head, AME unit) [email protected] Edgar WABYONA (Programme officer, AME) [email protected]
For other information, please contact:
2
TABLE OF CONTENTS
EXECUTIVE SUMMARY ... 5
1.0 BACKGROUND ... 14
2.0 METHODOLOGY ... 15
3.0 DEMAND SIDE FACTORS ... 16
3.1 HOUSEHOLD SOCIO-DEMOGRAPHIC CHARACTERISTICS ... 16
3.2 EFFECTIVE MARKET DEMAND AMONG HOUSEHOLDS ... 17
3.3 SAFETY AND SECURITY ISSUES IN HOUSEHOLD ACCESS TO MARKETS ... 22
4.0 SUPPLY SIDE FACTORS... 23
4.1 TRADER AND MARKET CHARACTERISTICS ... 23
4.2 SUPPLY CHAIN FOR KEY FOOD COMMODITIES IN THE REFUGEE SETTLEMENTS ... 23
4.3 CURRENT AVAILABILITY OF FOOD PRODUCE IN THE SETTLEMENT ... 24
4.4 MARKET ENVIRONMENT ... 25
4.5 MARKET STRUCTURE ... 26
4.6 MARKET CONDUCT ... 27
4.7 MARKET PERFORMANCE ... 27
4.8 TRADER RESPONSE CAPACITY AND CONSTRAINTS ... 29
5.0 FEASIBILITY OF MOBILE MONEY TRANSFER ... 32
5.1 MOBILE PHONE OWNERSHIP AND SUBSCRIPTION TO MOBILE MONEY AT HOUSEHOLD LEVEL ... 32
5.2 DISTANCE TO NEAREST MOBILE MONEY VENDOR ... 32
5.3 CHALLENGES IN USE OF MOBILE MONEY SERVICES ... 33
5.4 MOBILE MONEY VENDORS IN THE SETTLEMENTS... 33
6.0 SUMMARY ... 36
6.1 SUMMARY FINDINGS BY GENDER OF HOUSEHOLD HEAD ... 36
6.2 SUMMARY FINDINGS ON YOUTHS IN THE SETTLEMENTS ... 36
6.3 SUMMARY FINDINGS ON EXTREMELY VULNERABLE INDIVIDUALS (EVIS) IN THE SETTLEMENTS ... 37
6.4 SUMMARY FINDINGS BY SETTLEMENT ... 38
ANNEXES ... 42
ANNEX 1: KEY MARKETS IN THE REFUGEE SETTLEMENTS ... 42
3
LIST OF TABLES
TABLE 1: SUMMARY OF KEY FINDINGS BY SETTLEMENT ... 10
TABLE 2: NUMBER OF HOUSEHOLDS AND TRADERS SELECTED FOR THE ASSESSMENT ... 15
TABLE 3: HOUSEHOLD RATION SIZES BY LENGTH OF STAY ... 16
TABLE 4: FOOD PRODUCTS SOLD BY HOUSEHOLDS ... 19
TABLE 5: NEAREST FOOD MARKETS WITHIN THE SETTLEMENTS ... 20
TABLE 6: MAIN SOURCES OF FREQUENTLY TRADED FOOD COMMODITIES (PERCENTAGE OF TRADERS CITING SOURCE) ... 24
TABLE 7: MAIN REASONS FOR TRADERS' INABILITY TO INCREASE SUPPLY ... 30
TABLE 8: TRADER CONSTRAINTS IN THE REFUGEE SETTLEMENTS ... 31
TABLE 9: TURNOVER RATE FOR MOBILE MONEY AGENTS IN THE SETTLEMENTS... 34
TABLE 10: FREQUENCY WITH WHICH KEY CHALLENGES WERE IDENTIFIED BY MOBILE MONEY VENDORS ACROSS THE SETTLEMENTS ... 35
TABLE 11: COMPARISON BETWEEN MALE AND FEMALE HEADED HOUSEHOLDS ... 36
TABLE 12: COMPARISON BETWEEN EVIS AND NON EVIS ... 37
LIST OF FIGURES
FIGURE 1: HOUSEHOLD ACCESS TO LAND AND SIZES OF LAND OWNED ... 17FIGURE 2: HOUSEHOLDS THAT BOUGHT FOOD IN THE 7 DAYS PRECEDING THE SURVEY AND FREQUENCY OF MARKET VISITS ... 18
FIGURE 3: MAIN SOURCE OF MAIZE GRAIN AND BEANS ... 18
FIGURE 4: DISTANCE TO MARKETS ... 20
FIGURE 5: INCOME EARNERS IN THE HOUSEHOLDS ... 21
FIGURE 6: FOOD EXPENDITURE SHARE (FES) ... 22
FIGURE 7: TYPICAL SUPPLY CHAIN FOR MAIZE AND BEANS IN THE REFUGEE SETTLEMENTS ... 23
FIGURE 8: STOCK LEVELS FOR MAIZE AND BEANS IN THE REFUGEE SETTLEMENTS ... 25
FIGURE 9: DISTANCE TRAVELLED TO GET COMMODITIES ... 26
FIGURE 10: WHO DETERMINES COMMODITY PRICES IN THE MARKETS? ... 27
FIGURE 11: COMPARISON OF PRICE LEVELS IN REFUGEE & PROXIMAL NATIONAL MARKETS FOR MAIZE GRAIN (A) AND BEANS (B) ... 28
FIGURE 12: PRICE SEASONALITY IN THE SETTLEMENTS ... 29
FIGURE 13: ACCESS TO STORAGE FACILITIES ... 30
FIGURE 14: POTENTIAL TO INCREASE SUPPLY IN CASE OF INCREASED DEMAND ... 30
FIGURE 15: MOBILE PHONE OWNERSHIP AND SUBSCRIPTION TO MOBILE MONEY SERVICE ... 32
4
Glossary of terms
Float: The amount of money/capital that mobile money vendors have on account
National farmers: Farmers that are Ugandan Nationals, typically in the vicinity of the refugee settlements National traders: Traders that are Ugandan nationals, often going to the settlements to buy produce Refugee farmers: Refugee households that practice agriculture
5
EXECUTIVE SUMMARY
BACKGROUND
The main objective of this market assessment was to determine market functionality and the feasibility of cash transfer modality (and use of mobile money) among refugee settlements (Kyangwali, Kyaka II, Rwamwanja and Koboko) proposed for the cash transfer scale up in 2016. Survey households were randomly selected from a zone list obtained from the refugee settlement, while traders were randomly selected from key markets identified through key informant interviews. Data was collected using tablets with Open Data Kit (ODK) software.
KEY FINDINGS ON FEASIBILITY OF CASH TRANSFERS Household effective demand
Dependence on markets
Refugee households depend on markets, buying and selling food and other commodities; about 22% of households reported having sold food on the markets, while 60% bought food in the 7 days preceding the survey (amongst this group, 76% went to the market two or more times in the same period). Reliance on markets is highest in Koboko and Rwamwanja settlements with proportionately more households buying/selling food and/or reporting a higher frequency of market visits.
Access to markets
Overall market access conditions are conducive for the introduction of cash in all settlements. Distance to markets was not an issue for most households with up to 87% indicating distances of less than 1km to the nearest food market. However, in Kyaka II, relatively longer distances (1-5Km) were found and households highlighted this as a challenge in contrast to other settlements.
Purchasing power
More than three-quarters (76%) of households reported having at least one income earning member. Main income sources were food crop production/sales and agricultural wage labour. While this would
indicate purchasing power, the Food Security and Nutrition Assessment, FSNA (Jan 2015) indicated that many households had sold less food this year compared to last year, and nearly all respondents (98%) felt that price levels of key commodities had increased either slightly or greatly in the 3-6 months prior to the market assessment. Furthermore, households spend the greatest share of their expenditure (60%) on food. Findings therefore show low economic access to food (reduced purchasing power) among households. Cash transfers may thus have a positive impact on access to food as a result augmented household incomes.
Reliance on markets among refugee households is high – both for food and income Market access conditions are generally conducive for households
There is low purchasing power among households; added income through cash transfers could potentially have positive impact on household food access The security environment is largely conducive in the settlements
Difficulties in access to markets and security concerns noted in Kyaka II.
6 Safety/Security of households
The security environment– as experienced by households – is conducive for cash transfers; approximately 93% of households reported no safety/security incidents while going to/from the market, and more so in Koboko (100%). However, 12% (twenty-four households) in Kyaka II reported safety problems, particularly robbery without violence, which mostly occurred while going to/from the market. This is possible indication of vulnerability and protection concerns.
Commodity supply chain
Commodity supply chains within the settlements are well established with flows in and out of the refugee
settlements, and with linkages to the wider national economy. Traders1 are well established with 53%
running business for 1-5 years and majority (80%) open daily (5-7 times a week), implying households would not have problems with purchases. These findings underline the feasibility of cash transfers in the settlements.
Current availability of food on markets
Across the settlements, food stocks were reportedly low among traders as a result of the lean season, especially for beans. The strong influence of seasonal changes on food availability in markets will have implications on the cash transfer value as the reduction in food quantity/diversity leads to price rises in the lean season hence affecting purchasing power.
Market environment
The market environment is generally conducive for cash transfers based on findings that
Majority (80%) of traders expressed no safety/security concerns
(except in Koboko where 46% had safety issues).
None of the traders cited regulatory interference from
government or other institutions
Transport conditions are conducive, and majority of traders travel short distances (less than 1Km) for supplies
However, a security review is required in Koboko to ascertain the risks faced by traders prior to implementation of cash transfers. Also, transport conditions are unfavourable for traders in Kyaka II with the majority (68%) travelling long distances (12-30Km) for commodity supplies, potentially affecting stock replenishment.
1 Reference to traders selling food stuff and agricultural commodities
Commodity flows are well established for trade in the settlements
There is strong influence of seasons on market
availability and prices of food
The market environment (security, transport
conditions and regulations) is conducive for cash transfers
The high number of markets (and traders) in the
settlements, and the ability for traders to determine individual prices provides for competitiveness
Majority of traders can only cope with gradual increases in demand due to capital and supply constraints
7 Market structure
There exist many markets in the settlements, sometimes supplemented by markets outside the settlement. The total number of traders in the markets varies, and so does the type of commodities available. In general, there were more maize grain than beans traders in the markets. Overall, there were multiple traders dealing in a host of other commodities. This indicates competition in the markets that is ideal for buyers and for market based interventions. This is however less true in Kyaka II where a smaller number of traders/markets was found.
Market conduct and performance
Market conduct is ideal for cash transfers in most settlements given findings that weights and measures used are uniform and there is competition in the markets with most traders setting their own prices (except for Kyaka II).
Prevailing prices in the refugee settlements are largely less or equal to prices in proximal national markets, indicating that refugees are not faced with exorbitant prices, which is suitable for cash transfers. However, fluctuation of prices with the seasons indicates periods of low food availability and reduced food access for households and would require regular/timely cash distributions in the period of high prices (April/May).
Trader response capacity and constraints
The majority of traders have access to storage facilities (60-94%) with good capacity (>5 Tonnes) except in Kyaka II, and would therefore be able to buy in bulk and store. Ability to respond to sudden increases in demand is constrained by the limited availability of capital/credit and timeliness of supply delivery among most traders. This highlights the critical aspect of the need to introduce cash transfers gradually so that traders can cope with the increase in demand.
SUMMARY ON FEMALE HEADED HOUSEHOLDS
Female headed households are less able to produce sufficient food through agriculture, and comparatively disadvantaged in terms of access to food with fewer households having income earners. A lower dependence on markets was observed and this is linked to limited income available to female headed households and the constraint of long distances (cited more often by female headed households). However, considering the limited ability to cultivate enough food due to the limited land ownership, and low dependence on markets; findings suggest a food acquisition gap among female headed households. Moreover, the Food Security and Nutrition Assessment in refugee areas (Jan 2015) indicated that female headed households had poorer food consumption score compared to male headed households and attributed this to the high absence of income earners from most female headed households. These households might therefore benefit from cash transfers through which they would have additional income, helping to fill the food acquisition gap.
8 SUMMARY ON YOUTHS
Findings show no significant difference between the youth and the rest of the refugee population in terms of dependence and access to markets. It is therefore expected that the impact of cash transfers on this group will be similar, helping to provide for flexible acquisition of food. However, given the global tendency of youths to shift from agriculture to other livelihoods due to its laborious nature, the potential for cash transfers to incentivize this shift is highest among youth headed refugee households. These should therefore be a focus for pre-cash sensitization campaigns to prevent any negative impact.
SUMMARY ON EXTREMELY VULNERABLE INDIVIDUALS (EVIs)
Approximately 16% of respondents at household level were EVIs. Findings show no significant difference between EVIs and Non-EVIs in terms of dependence on, and access to markets. However, salient differences with respect to planned cash transfers are:
i) Much higher proportion of EVIs (50%) with no income earners compared to non-EVIs (19%) and,
ii) More households with FES > 65% among EVIs (56%) compared to non-EVIs (42%)
This suggests that the purchasing power is much less among EVIs than non EVIs. Cash transfers to this group would therefore help improve access to food. However, given relatively limited ability to produce food, the risk that EVIs opting for cash would suffer setbacks in food security/nutrition status is greater because cash distributed may be used for other non-food expenditure – thereby compromising food purchases and consumption. This necessitates that EVIs who opt for cash should be monitored frequently to ensure that their food consumption and nutrition status does not deteriorate.
KEY FINDINGS ON FEASIBILITY OF MOBILE MONEY
More than half own mobile phones (58%) and some refugees are utilizing mobile money across the settlements. The number of mobile money agents per settlement is small (ranging from one in Kyangwali to five in Koboko) and is inelastic due to the stiff entry requirements.
Besides capital constraint, withdrawals exceeding deposits was a challenge as it necessitates long distance travel to the banks to top up float, which in itself increases operational costs. In general, the total amount float/capital available to mobile money agents per settlement is limited and would necessitate gradual introduction of the service not to overwhelm the agents.
9
WFP Uganda – Cash assessment in refugee areas
SUMMARY BY SETTLEMENT Koboko
There is effective demand among households, with considerable dependence on markets. The highest percentage of households that bought/sold food in 7 days prior to the survey, and reported good access to markets was found in this settlement. Trading conditions are appropriate for cash transfers with good market environment, competitiveness among traders, and ability to respond to increased demand. However, proportionately more traders expressed safety concerns that require additional inquiry prior to implementation of cash transfers. Also, whereas the highest number of mobile money agents is found, long distances of over 12-30Km to mobile money agents do not favor this transfer modality.
10 Kyangwali
There is high dependence on markets but low purchasing power amidst increasing prices and high Food Expenditure Share, hence a food access gap. While the trading environment is conducive for cash transfers;
Impact of seasons on food availability/prices is profound and will require regular and timely cash transfers
Gradual introduction of cash would be necessary given inability to respond to sudden increases in
demand
With regard to implementation of mobile money transfers, only one agent exists in the settlement and it is therefore not recommended. Alternative means of money transfer like use of post bank (already piloted in other settlements) should explored.
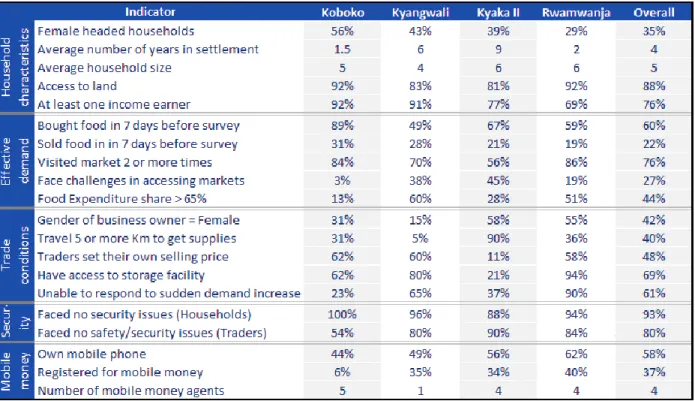
Table 1: Summary of key findings by settlement
Note: Rwamwanja had bigger sample due to its high population, while Koboko had a smaller sample as it is a relatively smaller settlement. Kyaka II
There is relatively low dependence on markets with fewer households buying/selling food in the 7 days prior to the survey, and lowest frequency of market visits. Also, proportionately more households reported security incidents in Kyaka II. While food prices are lowest, there is limited competition with fewer markets/traders, and trader response capacity is lowest with limited storage capacity. Given these and other findings, cash transfer is not feasible in this settlement at present.
11 Rwamwanja
High level of dependence on markets with considerably more households buying food; access to markets is good and majority of households mentioned no security concerns. Relatively higher levels of food stocks found on the market, and indication of competition among traders, making cash transfer a feasible modality. The highest percentage of households own mobile phones and subscribe to mobile money. In addition, agents have relatively higher capital levels. Therefore, use of mobile money is feasible on a pilot basis2.
RECOMMENDATIONS (CASH TRANSFER)
1. Based on the assessment findings, introduction of the cash transfer modality is recommended for Rwamwanja and Kyangwali settlements and, subject to further security inquiry, in Koboko.
2. Key challenges noted in Kyaka II include;
Constrained access to markets by households
Higher percentage of households reporting safety/security concerns
Relatively lower availability of food stock on the markets
Relatively lower number of traders on the markets, of which prices are largely determined collectively – suggesting limited competition
Lower ability of traders to respond to increased demand given low storage capacity and longer distance moved to replenish stocks by traders
It is therefore recommended that any cash transfer programme in Kyaka II be only initiated following the successful establishment of the programme in other settlements to enable the replication good practices and lessons learnt.
3. Given the diversity in household conditions such as in access to markets, preferences (food vs. cash) and others, it is recommended to make subscription to cash voluntary for households in the settlements where cash transfers are feasible. This will offer households flexibility to choose the most suitable assistance modality for them.
4. Findings show that there is limited agricultural productivity in the settlements, and plot sizes are small. The Food Security and Nutrition Assessment, FSNA (Jan, 2015) refugees also indicated that the majority of refugees had harvested less food in the previous season. Findings also suggest that there are more households that buy food from the market than those that sell. This is a basis to give cash because of the flexibility in food acquisition that enables households benefit from diversity in the markets.
5. Findings showed that the main sources of maize and beans were WFP food assistance and household production. However, the possibility that cash transfers could act as a disincentive to own production among refugees that switch to cash cannot be overlooked, especially given that agriculture is typically laborious. This is even more likely among youth headed households. Therefore, introduction of cash
2 It is noteworthy that all mobile money agents in Rwamwanja are located in one place (Kataryeba trading center).
12
in these settlements should be preceded by sensitization to, among others, encourage continued household agricultural production among beneficiaries.
6. Relatedly, it is noted that maize grain and beans are not the most commonly purchased commodities – but are consumed at home – because they are supplied by partners (WFP) and locally produced. This dynamic might, however, change as the two commodities become less available locally in light of substitution of in-kind transfers with cash. This further underlines the importance of pre-cash sensitization programmes to; i) encourage sustained household production of these and other commodities and, ii) highlight the potential economic benefits that continued household production could have for households.
7. Findings have established seasonal variations in market availability of food on markets and corresponding variations in prices. Peak prices for maize and beans are in April and May. Therefore programming for cash transfers should ensure there are no pipeline breaks in this period as this would have a profound impact on households that switch to cash.
8. Due to expected variation of prices with seasons, it is recommended to regularly monitor food prices in the key markets identified in the settlements selected for cash transfers. This will help inform adjustments to the cash transfer value as necessary.
9. Furthermore, it is recommended to implement interventions related to post-harvest handling/storage and bulking in the settlements to manage the seasonal fluctuations on commodity availability and prices. Such an intervention would: i) encourage refugee farmers not to sell at low prices during the harvests and buy back at high prices during the lean season; ii) help to maintain steady supply of commodities in the settlements during the lean season and; iii) improve incomes for refugee farmers. 10. While reports of protection (safety & security) incidences were low in these settlements, collaboration with government/OPM to increase security presence especially during periods of cash distribution will serve an important preventive role. In Koboko, security concerns expressed by the traders were highlighted and would necessitate further inquiry prior to any implementation of cash transfers. 11. Findings show that the majority of traders would be unable to respond to sudden increases in demand
due to limited capital and access credit as well as infrequent supply delivery. The implication is that introduction of cash transfers should necessarily be slow/gradual in scale to allow traders time to accumulate capital and re-adjust supply schedules as need arises.
12. Half (50%) of the EVI’s enumerated had no income earners which is far higher than non EVIs (19%). Cash transfers to this group may therefore help to improve economic access to food. However, more frequent monitoring will be necessary for EVI cash beneficiaries to ensure that their food security/nutrition status is not undermined by the change on transfer modality.
13. From the findings, it is clear that cash transfers can especially be relevant to youth, women and EVIs in terms of improving access to food. This should therefore be highlighted during the pre-cash sensitization programmes conducted in each settlement.
13
RECOMMENDATIONS (MOBILE MONEY)
14. Given the findings, use of the mobile money cash transfer modality is only recommended in Rwamwanja settlement. Implementation should be on pilot basis and gradual, and households should be allowed to opt for this modality on voluntary basis. Use of mobile money in the remaining settlements is not recommended for the following reasons:
Limited mobile phone ownership and subscription to mobile money Long distances to the mobile money agents
Limited number of agents
High barriers to entry, implying the inability of other traders to provide the service in the medium term
Limited levels of capital available and the inability to cope with sudden demand increases
15. As stated above, there exist entry barriers to provision of the mobile money service. Therefore the present number of mobile money agents in each settlement would, in the medium term, have to cope with increased demand for the service should beneficiaries opt for this modality. It is therefore recommended to establish a ceiling on the number of voluntary subscriptions per quarter so as not to overwhelm existing service providers and as a way to ensure that all that subscribe will have no issues in withdrawing their entitlements.
16. Given that use of mobile money has been tried by Oxfam Uganda in the Rwamwanja refugee settlement, a consultative meeting is recommended to share lessons learnt and further inform programme planning.
14
1.0 BACKGROUND
Cash and food are two modalities WFP uses in transferring resources to beneficiaries. Introduction of cash transfers in WFP Uganda’s programming was an outcome of a 2013 agreement between WFP, UNHCR and the Office of the Prime Minister (OPM) that cash transfers were appropriate and should be implemented on a pilot basis. The same would be monitored closely to gain a clear understanding of advantages and impact of this intervention
The purpose of providing cash to refugees is to give them choice and flexibility to decide on how to satisfy their basic food needs with more dignity. It is envisaged that with cash assistance, refugees will be able to obtain more preferred foods as well as diversify their diets and livelihoods, both of which are critical aspects of ensuring food security.
Cash transfers are currently being provided to nearly 1500 refugees in three settlements in West Nile region, and there are plans to scale up these transfers to four other settlements in 2016 (Koboko, Kyangwali, Kyaka II, and Rwamwanja) based on lessons learned from the initial pilot.
However, prior to implementation of cash assistance, it is a prerequisite to assess market dynamics and other related factors such as safety/security and beneficiary access to markets to ascertain whether the environment is conducive for cash assistance and would effectively meet the food needs of refugees. Furthermore, cash transfer being a relatively new modality in the context necessitates frequent monitoring to ensure that beneficiaries receive their entitlements and that key food security/nutrition and market functionality indicators do not deteriorate.
Overall objective
To determine market functionality and the feasibility of cash transfer modality among the refugees in four refugee settlements (Kyangwali, Kyaka II, Rwamwanja and Koboko).
Specific objectives:
To evaluate access to markets among refugee households
To determine the degree of dependence on markets among refugee households
To evaluate key aspects related to safety and security in the markets and for households
To identify key food markets in the refugee settlements
To assess current availability of food on local markets and related prices
To assess current food prices and the outlook for the next 6 months
To evaluate traders’ response capacity in a situation of increased demand
To assess the feasibility of use of mobile money transfer services in the refugee settlements
15
2.0 METHODOLOGY
Survey areas
Four refugee settlements that have been proposed for introduction of cash transfers viz. Koboko, Kyangwali, Kyaka II and Rwamwanja were covered during the assessment.
Selection of households
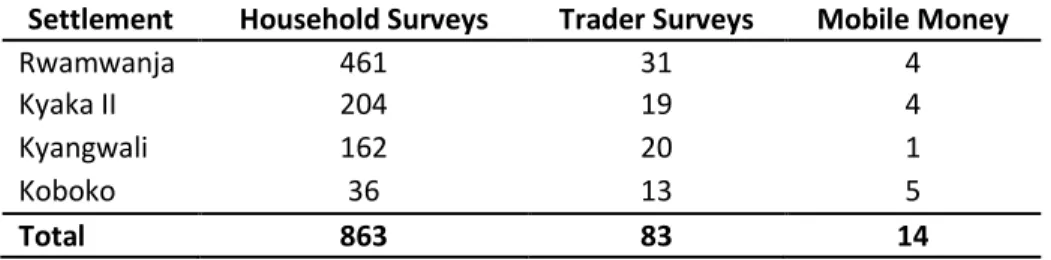
A cross sectional design was adopted for the survey. A total of 862 households were reached across the four settlements as shown in Table 2. A predetermined number of households per settlement was selected, distributed across the blocks/zones/villages (herein after referred to as zones) from the settlement. A list of households from each zone was obtained from the refugee settlement, and systematic random sampling was used to identify each household.
Selection of markets and traders
In each settlement, key informant interviews were held with officials from the Office of the Prime Minister (OPM) and partners to identify key markets in the settlements or used by the refugees. Traders were randomly selected from within these markets for interviews, price data on specified commodities collected, and general observations about the market made. A total of 83 traders were interviewed. Selection of mobile money vendors
A combination of key informant interviews and the snow-ball method were used to identify mobile money vendors within the settlements. Officials from OPM helped identify the location of known mobile money vendors who were then visited for interviews. These mobile money vendors were then asked to identify other vendors in the settlement who were also visited. A total of 14 mobile money vendors were interviewed3 across the settlements
Table 2: Number of households and Traders selected for the assessment
Settlement Household Surveys Trader Surveys Mobile Money
Rwamwanja 461 31 4 Kyaka II 204 19 4 Kyangwali 162 20 1 Koboko 36 13 5 Total 863 83 14 Data collection
Data collection for the household and traders was done using tablets with Open Data Kit (ODK) software, while interviews with mobile money vendors and market observations were semi-structured and paper based.
16
3.0 DEMAND SIDE FACTORS
3.1 Household socio-demographic characteristics
Gender of the household headsFemale headed households constituted 35% of the sample. The highest of this proportion was found in Koboko at 56% while the lowest of 29% was found in Rwamwanja.
Country of origin
The majority of households enumerated were of Congolese origin (96%). Some South Sudanese were found in Kyangwali (8%) and Rwandese in Kyaka II (8%). The settlements of focus in the assessment have predominantly hosted Congolese nationals
Length of stay in settlements and ration size
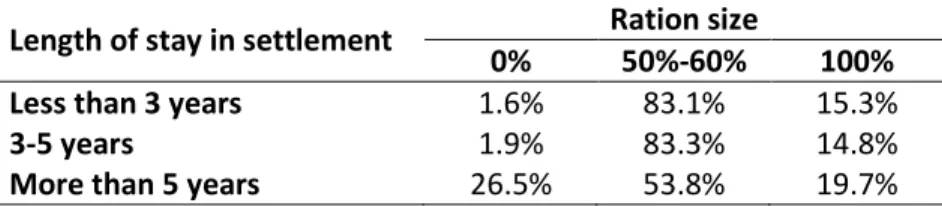
On average, households had been in the settlements for 4 years, but this was widely varied; Koboko had new caseload with average length of stay in the settlement as 1.5 years followed by Rwamwanja (2 years). On the other hand, refugees in Kyangwali and Kyaka II had stayed longer (6 and 9 years respectively). Overall, three-quarters (75%) of the households were on 50-60% ration. Findings show that there was no difference in ration size between households that had newly arrived (less than 3 years) and those that had stayed 3-5 years in the settlements (Table 3). However, Kyaka II had a high percentage of households (32%) that were on no ration while all households in Koboko were on 100% ration. Households are gradually phased off food rations the longer they stay in settlements on the assumption of self-reliance.
Table 3: Household ration sizes by length of stay Length of stay in settlement Ration size
0% 50%-60% 100%
Less than 3 years 1.6% 83.1% 15.3%
3-5 years 1.9% 83.3% 14.8%
More than 5 years 26.5% 53.8% 19.7%
Extremely Vulnerable Individuals
Among the three settlements of Kyangwali, Rwamwanja and Kyaka II, EVI’s made up 12%-19% of households that were visited. Exercise to classify EVIs has not yet been conducted in Koboko settlement. Access to land
The majority (87%) of households visited had access to land, of which the highest level was in Rwamwanja and Koboko (92%), and the lowest in Kyaka II (81%). There was no significant difference in access to land
between male and female headed households, and between EVI and non EVI households (Figure 1).
On average, 91% of households had plot sizes less than one acre (Figure 1). Plot sizes were smallest in Koboko where up to 88% of households had access to plots of less than 0.5 acres.
17 Access to land by refugees enables them to practice agriculture, the proceeds of which complement food assistance rations and any surplus may be sold off for income. However, given that the average household size was 5 members, these plot sizes may only be sufficient for subsistence production and may not favour crop diversity.
Figure 1: Household access to land and sizes of land owned
3.2 Effective market demand among households
3.2.1 Dependence on markets
Food purchasesApproximately 60% of households across settlements bought food in the 7 days preceding the survey. This ratio was lowest Kyangwali (49%) and highest in Koboko (89%) (Figure 2). Fewer female headed households (54%) reported having bought food in this period compared to male headed households (63%). Expectedly, a lower percentage (52%) of Extremely Vulnerable Individuals (EVIs) had bought food in this period compared to non-EVIs (62%).
Among the households that bought food, up to 76% went to the market two or more times during the week. This proportion was highest in Rwamwanja (86%) and lowest in Kyaka II (55%) (Figure 2).
The most frequently purchased food commodities were roots/tubers such as cassava (50%), cassava flour (40%), beans (37%), meat/fish (33%) and greens/vegetables (25%). The predominant source of food purchased for these households was local markets within the settlements (80%), while nearly equal proportions (10%) did so from neighbors/friends and markets outside the settlement. The exception was in Koboko where the majority of the households (72%) frequent markets outside the settlement. Even so, distances to the nearest food market for most households were less than 1Km indicating easy access to markets. Overall, findings illustrate the importance of markets to household food provisioning and diets.
18
Figure 2: Households that bought food in the 7 days preceding the survey and frequency of market visits
Main source of maize and beans
Relatedly it is worth noting that maize grain and beans are not the most commonly purchased commodities from traders – but are consumed at home – because they are supplied by partners (WFP) and locally produced (Figure 3). In Koboko for example, food assistance was nearly the only source for these commodities. The implication is that if cash is introduced, this dynamic might change as the two commodities become less available locally given reduction (total quantity) of food assistance. There is therefore need for pre-cash sensitization programmes to encourage household production of these and other commodities, and the economic benefits that this could have for households.
However, considering that access to land is high (Refer to Figure 1); that maize and beans are the most commonly cultivated crops in Rwamwanja, Kyangwali and Kyaka II (See FSNA4 Jan 2015); and the fact that
agriculture contributes less as a source of maize/beans, particularly in Rwamwanja (22%) underlines low productivity and the complementary role played by markets in bridging the gap between quantities produced and consumed.
Figure 3: Main source of maize grain and beans
19 Opportunities for households to sell products
Across settlements, only 22% of households reported having sold any food on the markets, but this was higher in Koboko (31%) and lowest in Rwamwanja (19%). This finding is not surprising given the low agricultural productivity in the settlements and the fact that the survey was conducted in the lean season. Among households that sold food, the most commonly sold items were as in Table 4. Findings also suggest that there are more households that buy food from the market than those that sell.
Table 4: Food products sold by households Settlement Food items sold
Koboko Beans, maize flour, greens/vegetables
Kyaka II Maize grain, Meat/Fish, Cassava flour
Kyangwali Maize grain, beans, roots/tubers
Rwamwanja Maize grain, beans, maize flour
The high percentage of households buying food underscores the role of markets in refugee livelihoods and nutrition, supplementing agricultural production and food assistance. It is noted, for example, that maize and beans do not feature among the most purchased food commodities as they are obtained though food assistance and own production.
In sum, there is a clear dependence on markets among refugee households for food and income. This dependence is highest in Koboko and Rwamwanja settlements with proportionately more households buying/selling food and with higher frequency of market visits. Market based interventions for food assistance such as cash transfers are therefore suitable.
3.2.2 Access to markets
Distance to marketsFor the majority of households enumerated, distance to markets was not an issue with up to 87% indicating distances of less than 1km to the nearest food market (Figure 4). This is not surprising as it was observed that there often exist smaller markets in the settlements at zone level. Longer distances of 1-5Km were however reported in Kyaka II. The nearest food markets most commonly identified by households are as shown in Table 5.
20 Constraints to market access
An average of 73% of the households across the settlements reported no challenges in accessing the markets, particularly in Koboko (97%). The highest percentage of households that reported challenges in access to markets was in Kyaka II (45%). Among these, 75% (about 46 households) indicated that long distance to markets was an issue. Overall, long distance to markets was more emphasized by female headed households (62%) than male headed households (48%). Hence, findings show that except in Kyaka II where long distance to markets is a problem, market access
conditions by households are
conducive for introduction of cash. This implies that for the majority of households, going to and from the market is convenient.
3.2.3 Household purchasing power
Household income earnersSimilar to findings of the FSNA (Jan 2015), more than three-quarters (76%) of the households visited reported having at least one income earner in the households. As shown in Figure 5, this was highest in Koboko (92%) and Kyangwali (91%) but lowest in Rwamwanja (69%). Food crop production/sales and agricultural wage labour were the two main income sources for households across the settlements. The former was more common in Kyangwali and Kyaka II while the latter was more common in Koboko and Rwamwanja.
Half (50%) of the EVI’s enumerated had no income earners which is far higher than non EVIs (19%). Also, there were slightly more female headed households without an income earner (28%) compared to male headed households (23%). These groups might therefore benefit from cash transfers, enabling them access diverse foods of their preferences in the markets.
Table 5: Nearest food markets within the settlements
21 Figure 5: Income earners in the households
Household incomes, food prices and impact on purchasing power
While purchasing power would expectedly be high given the high percentage of households with income earners, it is noted that:
i) According to the FSNA (Jan 2015), more than half of households (51% - 64%) produced less food
in the previous season, and over 70% either did not sell any food or sold less quantities compared to other seasons. Therefore, given the prominence of food crop production/sales as an income source, it is postulated that income levels are low among the households.
ii) When asked about their perception on price levels in the last 3 to 6 months, only 2% of respondents thought prices had remained the same in that period. The remaining percentage said prices had increased either slightly (56%) or greatly (42%). High prices were particularly felt in Koboko where up to 86% suggested great increases in prices, but less so in Kyaka II were 75% indicated that prices had increased slightly in the same period5.
Findings show that purchasing power of households is low. Given the established dependence on markets, cash transfers present an opportunity to improve food access among refugee households.
Food expenditure share6 (FES)
Food expenditure share across settlements, averaging 60% is not surprising. This was lowest in Koboko (41%) and highest in Kyangwali and Rwamwanja (65%). Households with FES greater than 65% are considered food insecure. As shown in Figure 6, about 60% of households in Kyangwali, and nearly half of those in Rwamwanja had FES >65%. This further indicates issues in economic access to food (low purchasing power) for households. These settlements should therefore be given priority in implementation of cash transfers.
5 It is recognized that the timing of the survey (during the lean season) may have influenced the perception of high
prices
6 Food Expenditure Share (FES) is a measure of the proportion of total household expenditure that goes to food.
The higher the FES, the higher the likelihood that a household is Food Insecure, based on the observation (Engel’s law) that as income rises, the proportion of income spent on food falls, even if actual expenditure on food rises.
22 Figure 6: Food Expenditure Share (FES)
3.3 Safety and security issues in household access to markets
Approximately 93% of households reported no safety/security incidents while going to/from the market. All households enumerated in Koboko reported no safety/security incidents, but the lowest was in Kyaka II at 88%. Robbery without violence was the most commonly mentioned among those that experienced safety problems in Kyaka II and other settlements. These incidences happened mostly while going to/from the shops/stalls (62%) while the others happened at the shop/stall and, in isolated cases, at home. When asked about possible solutions to these security threats, introducing security personnel in the area was the most common solution advanced by the households. Therefore the security environment in the settlements – as experienced by households – is conducive for cash transfers.
Key points on household effective demand and the security environment for households 1. Market dependence is high among households, underlining the suitability of market based
interventions for food assistance. This dependence is typified by:
High level of purchases (and to a lesser extent sales) of food, and frequent visits to the market among households, indicating dependence on markets
Good access to markets with majority of households living within short distances to the nearest food market, and majority reporting no constraints in access to markets, thus introduction of cash unlikely to introduce an additional burden for households
2. However, there is a gap in the food acquisition ability of households indicated by increasing prices (household perception) and high Food Expenditure Share – therefore an opportunity to fill this gap through cash transfers
3. Safety and security conditions as experienced by households are conducive for introduction of cash in the settlements
23
4.0 SUPPLY SIDE FACTORS
4.1 Trader and market characteristics
In addition to the nearest food markets identified by households (Refer to Table 4), additional markets, including the main markets in each settlement were visited to establish price and trader characteristics on the guidance of the OPM. Details of the markets visited are presented in Annex 1.
Majority of the traders interviewed in the markets visited were male (58%) especially in Kyangwali (85%) and Koboko (69%). The highest percentage of female traders was in Kyaka II (58%) and Rwamwanja (55%). Across the board, 53% of traders had been running their businesses for between 1 to 5 years while an average of 29% of these had been started less than a year back. Also, approximately 80% of traders open daily (5-7 days a week) while another 11% open two to five times a week. This suggests stability of traders, and of access to commodities by households.
4.2 Supply chain for key food commodities in the refugee settlements
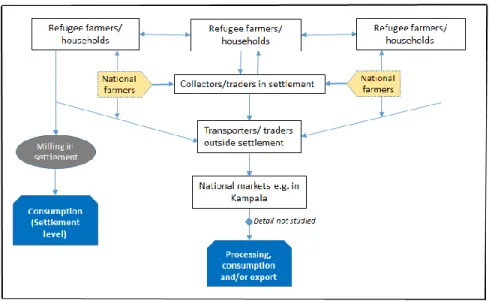
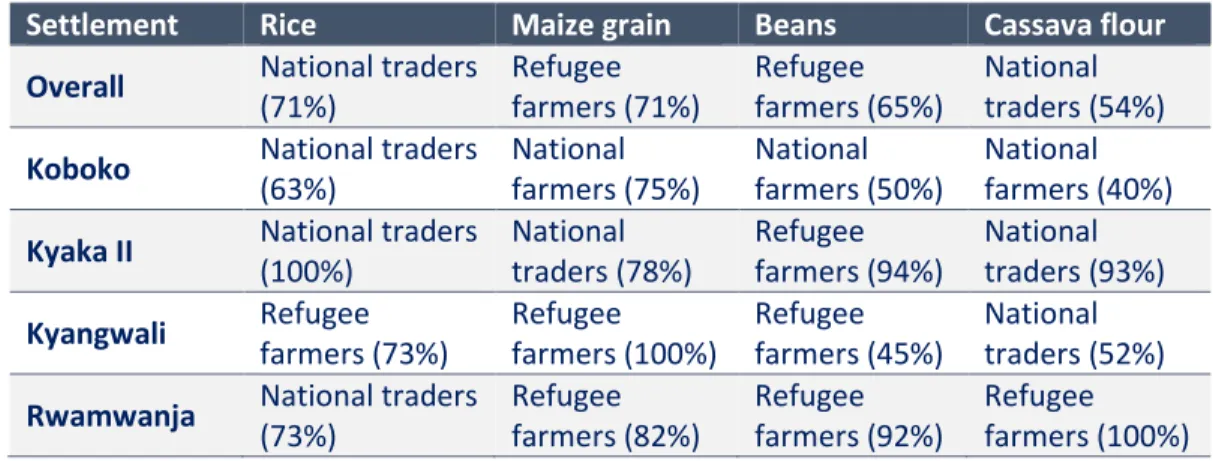
Within the refugee settlements, two types of commodities can generically be distinguished; agricultural produce and nationally marketed commodities/groceries. Refugee traders obtain the latter from markets outside the settlement and/or are delivered to their shops by suppliers on a predetermined schedule. On the other hand, the typical flow of agricultural produce (focus on maize and beans) is as illustrated in Figure 7 below.
The two main sources of these commodities are through production at household level and food assistance received (Refer to Figure 3). There exists inter-household trading (cash, barter) of these commodities to the extent that refugee households often do not buy these commodities from traders. On the contrary, these households sell to traders/collectors within the settlements and, in some cases, directly to external traders.
Collectors within the settlements are typically refugees establishing a vital connection between refugee farmers and external markets by buying small quantities and bulking for sale to other traders.
24 Some variations exist with commodities like rice that are largely produced externally and therefore mostly obtained from national traders. Table 6 below attempts to quantify the flows through each stream.
Table 6: Main sources of frequently traded food commodities (Percentage of traders citing source)
Settlement Rice Maize grain Beans Cassava flour
Overall National traders
(71%) Refugee farmers (71%) Refugee farmers (65%) National traders (54%)
Koboko National traders
(63%) National farmers (75%) National farmers (50%) National farmers (40%)
Kyaka II National traders
(100%) National traders (78%) Refugee farmers (94%) National traders (93%) Kyangwali Refugee farmers (73%) Refugee farmers (100%) Refugee farmers (45%) National traders (52%)
Rwamwanja National traders
(73%) Refugee farmers (82%) Refugee farmers (92%) Refugee farmers (100%)
These findings further illustrate the notion that refugees are linked to the general national economy. However, considering that households derive income from sale of maize and beans, some caution should be exercised in the introduction of cash transfers, if at all, in order not to undermine production as refugees switch to direct cash that may indirectly incentivize a shift from labour intensive agriculture.
Key points on commodity supply chain in the refugee settlements
1. Findings indicate the feasibility of cash transfers in the settlements given the following;
Commodity supply chains are well established with flows into and out of the refugee settlements
with linkages to the wider national economy
Traders are well established with 53% running business for 1-5 years and,
Majority of traders (80%) open daily (5-7 times a week), implying households would not have
problems with purchases.
4.3 Current availability of food produce in the settlement
4.3.1 Level of stocks in the market
Among the traders interviewed across the settlements, the most commonly traded food commodities were beans (75%), rice (70%), maize grain (68%) and cassava flour (63%). However, food stocks were reportedly low among traders as a result of the lean season. Food stocks were particularly low for beans across the settlements, and for both beans and maize in Kyaka II (Figure 8). The availability of food on the market (quantity and diversity) is highest during the harvest season.
25 Figure 8: Stock levels for maize and beans in the refugee settlements
It is noteworthy that food flow patterns are such that local produce (particularly maize and beans) flow out of the settlement while groceries flow into the settlements. This has the implication that when agricultural commodities are out of season, prices are likely to rise higher and market availability/diversity to diminish. In the event that some refugees switch to cash instead of food, prices in the lean season may even go higher, further affecting household food entitlements. These issues need to be programmed into the cash transfers for example to ensure that cash distributions take place timely during the lean season to avert potentially negative impact on household food security. Furthermore, it is recommended to implement household storage/warehousing initiatives that would allow refugees to store produce and sell during the low season at favorable prices, therefore simultaneously stabilizing supply and improving incomes.
4.4 Market environment
4.4.1 Safety and security
Up to 80% of traders interviewed expressed that they had not experienced any safety/security incidences. This was highest in Kyaka II (90%) and lowest in Koboko (54%). The most commonly reported safety concerns were robbery without violence among 3 traders (23%) as well as verbal abuse and threats among another 3 traders (23%).
Majority of the safety incidents were reported to have happened at the shops/stalls (88%) and on the way to/from home (6%) or while transporting goods to the shop (6%). Increasing security presence in the markets and/or its enforcement were the key solutions advanced to improve safety among the traders.
4.4.2 Regulations
The regulatory environment was perceived as conducive; none of the traders interviewed cited any interference from government/OPM officials. Traders did not mention any taxes imposed that are restrictive of their business or that inhibit expansion, entry or exit from the business. It is however noted that refugee traders are subject to the same tax regime operational country wide implying that they pay traders’ licenses.
26
4.4.3 Transport conditions
Road conditions were noted as fair but often deteriorate during the rainy seasons7. As shown in the Figure 9, majority of traders have to travel some distance to get the food supplies. However, in Kyaka II, up to 68% of traders travel considerably longer distances (12-30km) to get their food supplies compared to the other settlements. On the other hand, 95% of traders in Kyangwali have their food stocks delivered to them by the suppliers or at most travel less than 1 km to get the food.
Figure 9: Distance travelled to get commodities
Key points on the market environment in refugee settlements
1. The market environment is generally conducive for cash transfers based on the following findings:
Majority (80%) of traders expressed no safety/security concerns
None of the traders cited regulatory interference from government or other institutions
Transport conditions are conducive, and majority of traders travel short distances for supplies 2. Additional security review is required in Koboko to ascertain the risks faced by traders prior to
implementation of cash transfers
3. Transport conditions are unfavourable for traders in Kyaka II with majority (68%) travelling long distances for commodity supplies, potentially affecting stock replenishment time.
4.5 Market structure
4.5.1 Markets and number of traders in the settlements
There exist many markets in the settlements, sometimes supplemented by markets outside the settlement – particularly so in Koboko. In each settlement, there exists a main market, as well as other subsidiary markets. Details of the markets visited in each settlement are as described in Annex 1. The total number of traders in the markets varies, and so does the type of commodities available. In general, there were more maize grain than beans traders in the markets. As seen in Annex 1, the highest total number of maize and beans traders was observed in Rwamwanja and Kyangwali but was lowest in Kyaka II. Overall, however, there were multiple traders dealing in a host of other commodities.
7 The refugee settlements are located in bimodal rainfall areas that typically receive rain from March to May and
27 The existence of many markets/traders in the settlements is ideal for market based interventions such as cash transfers as it makes competition among traders more likely (and therefore inability of a single trader or group of traders to influence prices of commodities) as well as potentially diverse commodities available for households. This was however less true in Kyaka II where a smaller number of traders/markets was found.
4.6 Market conduct
4.6.1 Weights and measures
For the majority of traders, standard units of measurement are used in day-to-day transactions. Weights were measured in Kilograms, particularly for maize grain, rice and flour. However, units are varied for fresh produce e.g. a heap (for cassava, potatoes), bunch (bananas), a cup for beans etc. These units are however widely understood among traders and households.
4.6.2 Price setting behavior
Traders were asked about the price setting behavior in the markets to which it was found that in the majority of cases, each trader sets his/her own price (Figure 10). This was particularly so in Koboko (62%) and Kyangwali (60%). In Kyaka II however, 53% of traders noted that prices were determined collectively by traders in the market. Influence of bigger traders outside the market is noted in price setting particularly with regard to groceries supplied from outside the settlement, in which case suppliers recommend a retail price. This was especially the case in Kyangwali (30%).
Figure 10: Who determines commodity prices in the markets?
Findings further suggest competitive behavior among traders in the settlements, a situation ideal for postulated increase in demand for commodities in case cash transfers are implemented. However, concerns remain in Kyaka II and would need to be further investigated prior to any such interventions.
4.7 Market performance
4.7.1 Price levels
The prices for maize grain and beans were captured as shown in Figure 11 and Annex 2. Maize grain prices were highest in Koboko at UgX 1200 per Kg and lowest in Kyaka II with the average cost at UgX 550 per
28 Kg. On the other hand, beans prices were highest in Kyangwali with a Kilogram going for UgX 2689 against Kyaka’s UgX 1500 per Kg.
In comparison with key regional markets for which data is available as per WFP’s March 2015 monthly market monitor, and that are in proximity with these refugee settlements, it is found that;
Maize grain prices are lower in the refugee settlements than in key national markets, except for Koboko
Beans prices are less or nearly equal to prices in national markets except in Kyangwali where this is much higher
Figure 11: Comparison of price levels in refugee & proximal national markets for maize grain (A) and beans (B)
4.7.2 Price trends and seasonality
While price data has not historically been collected in these refugee settlements, an attempt was made to establish price trends by seeking the perception of the traders on the likely evolution of prices in the next 3 to 6 months from the time of the assessment. It was found that on average, only 4% of respondents expected prices to remain unchanged during this period while the remaining 96% expected prices to increase either moderately (36%) or substantially (60%). Reduced food access is therefore expected in the near future and, while this indicates the suitability of cash transfers for beneficiaries, it also has implications on the cash transfer value and on the need to continuously monitor prices to ensure that food access among refugees that switch to cash is not undermined by price rises.
The main reason given by most traders (72%) for this expected upward price movement was the lean season/poor harvest that has led to a reduction in supply of food commodities against steady or increasing demand. This is consistent with the experiences expressed by households on increased prices of food commodities.
Traders were also asked to give information on the months during which prices for maize and beans were typically highest and lowest. A representation of the months most frequently cited for high and low maize and beans prices is as in Figure 12. It could be seen that the survey was conducted during the period of high prices for both commodities attributed to scarcity of supply (also reflected in the stocks available at trader level).
29 Figure 12: Price seasonality in the settlements
While price series data for these refugee settlements is unavailable to facilitate conclusions on market integration, findings suggest that refugees depending on markets are not faced with exorbitant or exploitative prices (compared to other markets in the country) that would strip them of incomes received through cash transfers.
Key points on the market conduct and performance in the refugee settlements
1. Market conduct is ideal for cash transfers given that;
Weights and measures are uniform and generally understood by traders and households and,
There is competition in the markets as most traders set their own prices (except for Kyaka II) 2. Prevailing prices in the refugee settlements are largely less or equal to prices in proximal national
markets, indicating that refugees are not faced with exhorbitant prices, which is ideal for cash transfers
3. Fluctuation of prices with the seasons indicates periods of low food availability and reduced food access for households and would require regular/timely cash distributions in the period of high prices (April/May).
4.8 Trader response capacity and constraints
4.8.1 Access to storage facilities
While nearly 70% of traders had access to stores across the settlements (Figure 13), disparities were found; Rwamwanja and Kyangwali had the highest proportion of traders with storage facilities (94% and 80% respectively) while Kyaka II had the least (21%).
Overall, the majority (51%) of traders could accommodate more than 5 tonnes. This was true in all settlements visited except in Kyaka II where the majority of stores were of 500 to 1000Kg size. Considering that traders in Kyaka II would presumably take longer to replenish their stocks (due to long distances), the fact that there is low access to storage and limited capacity further suggest limited ability of traders to respond to sudden increases in demand.
30 Figure 13: Access to storage facilities
4.8.2 Potential to respond to sudden increase in demand
In response to questions on ability to respond to sudden increases in demand, majority of traders (over 60%) cited their inability to do so, especially in Rwamwanja and Kyangwali (Figure 14).
Figure 14: Potential to increase supply in case of increased demand
The two main reasons cited by traders for the inability to respond to sudden increases in demand were the lack of capital/credit and delays in supply/delivery of commodities as summarize in Table 7 below:
Table 7: Main reasons for traders' inability to increase supply Settlement First main reason Second reason
All settlements Lack of capital/credit Delayed supply delivery
Koboko Lack of capital/credit Commodities difficult to find
Kyaka II Lack of capital/credit Lack of storage capacity
Rwamwanja Delayed supply delivery Lack of capital/credit
Kyangwali Commodities difficult to find Lack of capital/credit
4.8.3 Credit provision
Findings further showed that the majority of traders (77%) were able to provide credit sales to their customers, but to a limited extent in Kyangwali. It is noteworthy though that majority of the grain traders in Kyangwali were collectors, buying from farmers and selling to traders from outside the settlement. Where credit is provided, the repayment period was indicated as 1-2 weeks for most (72%) of traders.
31
4.8.4 Challenges faced by traders
The outstanding challenge faced by traders was the fact that majority of the customers were buying food and other commodities on credit and the fact that there was delayed and/or non-repayment. Other challenges are as shown in Table 8.
Table 8: Trader constraints in the refugee settlements
Settlement First Second Third
All settlements Everybody buying on credit/delayed and/or non-payment (25%) Supply problems (17%) Lack of customers (13%)
Koboko Everybody buying on credit/delayed
and/or non-payment (23%) Lack of customers (23%)
Too many sellers in the market (15%)
Kyaka II Everybody buying on credit/delayed
and/or non-payment (37%)
Too many sellers in the market (21%)
Forced to sell at lower prices (21%)
Rwamwanja Everybody buying on credit/delayed
and/or non-payment (32%) Supply problems (26%) Limited capital (23%)
Kyangwali Forced to sell at lower prices (30%) Supply problems (25%) Lack of customers
(15%)
Key points on trader response capacity in the refugee settlements
1. Majority of traders have access to storage facilities with good capacity (except in Kyaka II), and would therefore be able to buy in bulk and store.
2. Ability to respond to sudden increases in demand is constrained by the limited availability of capital/credit and timeliness of supply delivery
3. Implication is for the need to introduce cash transfers slowly so there is a gradual increase in demand that traders can respond to. This would allow traders time to accumulate capital and re-adjust supply schedules as need arises.
32
5.0 FEASIBILITY OF MOBILE MONEY TRANSFER
5.1 Mobile phone ownership and subscription to mobile money at household level
On average, only 58% of the households enumerated owned a mobile phone (Figure 15). Highest mobile
phone ownership was observed in Rwamwanja (62%) and the lowest in Koboko (44%). Among those that own mobile phones, the most common service provider is MTN (85%) followed by Airtel (11%) and Africell (4%). Africell was most common in Koboko with 50% of households subscribing to it, while Airtel was most common in Kyangwali with 18% subscribers. Among the households that owned mobile phones, 37% were registered mobile money users.
Figure 15: Mobile phone ownership and subscription to mobile money service
5.2 Distance to nearest mobile money vendor
Overall, the distance to the nearest mobile money vendors (MMVs) for registered mobile money users8
was short (less than 1Km), particularly so in Kyangwali and Kyaka II (Figure 16). The exception to this was in Koboko where all registered mobile money users were at relatively longer distances of 1-5km to the agents. Findings suggest an association between the proximal presences of MMVs and the likelihood of households to register for the service. Implication is that where mobile money modality is implemented, it should be on a voluntary basis so households are in position to select it only if suitable.
33 Figure 16: Distance to the nearest mobile money vendor (among registered mobile money users)
5.3 Challenges in use of mobile money services
About 13% of households mentioned no challenges in using mobile money. The four most commonly mentioned challenges among the remaining 87% were;
Unreliable network (33%),
MMVs running out of money (16%),
High cost of the service (14%) and,
Not knowing how the system works (14%).
The highest percentage of respondents reporting network problems was in Rwamwanja (37%) and Kyaka II (36%), while the percentage that reported the agent running out of money was highest in Kyangwali (39%).
5.4 Mobile money vendors in the settlements
A total of 14 mobile money vendors (MMVs) were interviewed across the 4 settlements9 as follows;
Koboko (5), Kyaka II (4), Rwamwanja (4) and Kyangwali (1). Only 3 of these vendors were female (21%) and nearly all (with one exception) were connected to one mobile network (MTN).
5.4.1 Ease of becoming a vendor
Across the settlements, vendors indicated that the process to become an MMV was rather long and complicated with stiff requirements from the service providers. Vendors cited the requirement to have a company that has been registered for at least 3 months, and high initial capital as the main entry barriers. In effect, vendors reported periods ranging from 3 months to 2 years as the time it took to become operational.
34
5.4.2 Customers per week
The vendors serve a moderate number of customers per week with some busier than others as shown in Table 9. The average amounts each agent could handle for a single transaction varied but the averages are shown in the table below. While Koboko had the highest number of vendors, the amount that each could handle in a transaction was much lower compared to the levels in the other 3 settlements. The relatively high number of vendors (and high level of float) in Rwamwanja could be due to past efforts by Oxfam Uganda which used mobile money to pay beneficiaries of a cash for work intervention in the settlement10.
When asked about whether they would be in position to meet increased demand, if at all, majority (79%) responded positively while the other 21% advanced limited capital/float as the key constraint.
Table 9: Turnover rate for mobile money agents in the settlements Settlement No. of
MMVs
Customers/ week
Highest withdrawal amt. (Average)
Highest deposit amt. (Average)
Koboko 5 117 950000 948000
Kyaka II 4 116 3375000 3375000
Rwamwanja 4 100 3750000 3750000
Kyangwali 1 180 3000000 3000000
In theory, findings show that the highest amount of capital/float collectively available to mobile money agents in a settlement is UgX 15,000,000 and is relatively inelastic given the entry barriers to the trade, though some indicated possibilities of increasing their float. This amount can serve up to 200 households of size 5 and on 50% ration11. Therefore, incase mobile money is used as modality in some settlements, it
will be necessary to establish a ceiling on the number of households that can opt for this modality for a given time period e.g. on quarterly basis.
5.4.3 Mobile money vendor constraints
Agents were asked to identify challenges related to operating mobile money businesses in the settlements. Withdrawals exceeding deposits was a key issue because it necessitates agents to travel long distances to the banks to top up their float (therefore increasing operational costs) and inadequate capital as key constraints. This translates into low levels of float, and therefore inability to serve many customers. This is further aggravated by the low number of vendors per settlement. The following were the key challenges resonating across the respondents (Table 10):
10 Drawn from the peer review exercise on the draft version of this report 11 Current transfer value per person on 50% ration is UgX 15,000
35 Table 10: Frequency with which key challenges were identified by mobile money vendors across the settlements
Challenges Overall
frequency Kyangwali
Kyaka
II Rwamwanja Koboko Fraud/conmen, theft and
uncertainty on security 8 1 3 3 1
Network problems 6 0 1 1 3
Limited capital base 5 0 1 1 3
Withdrawals exceed
deposits 3 0 1 1 1
Further to the above, there exist entry barriers to provision of the mobile money service. Key among these are the minimum capital requirements and the requirement to have a registered company. This means that the present number of mobile money agents in each settlement would, in the medium term, have to cope with increased demand for the service should beneficiaries opt for this modality.
Key points on feasibility of mobile money
1. There is limited mobile phone ownership (and hence subscription to mobile money) across the
settlements
2. The number of mobile money agents per settlement is small (ranging from one in Kyangwali to
five in Koboko) and is inelastic due to the stiff entry requirements.
3. Distance to mobile money agents is not an issue with short distances of less than 1Km reported
for majority of households (except in Koboko).
4. The total amount float/capital available to mobile money agents per settlement is limited and would necessitate gradual introduction of the service not to overwhelm the agents.
5. The use of alternative money transfer mechanisms like Post Bank (currently used in West Nile and
Kiryandongo settlements) should be further explored.
6. Use of mobile money has been tried by Oxfam Uganda in the Rwamwanja refugee settlement; a
36
6.0 SUMMARY
6.1 Summary findings by gender of household head
Among the households visited, about 35% were female headed, highest in Koboko (56%) and lowest in Rwamwanja (29%). A summary compariso