Laboratory 3
Type I, II Error, Sample Size, Statistical Power
Calculating the Probability of a Type I Error
Get two samples (n1=10, and n2=10) from a normal distribution population, N (5,1), with population mean=5, and population variance=1, by random sampling. Perform the independent t-test Procedure. Please repeat 10 times, and fill in Table 1.
SAS program
title1 '*******************************************************';
title2 'Probability of type 1 error by Henian Chen 2002-08-22';
title3 '*******************************************************'; data type1error; do j=1 to 2; do i=1 to 10; x=rannor(0)+5; output; end; end; proc ttest; class j; var x; run;
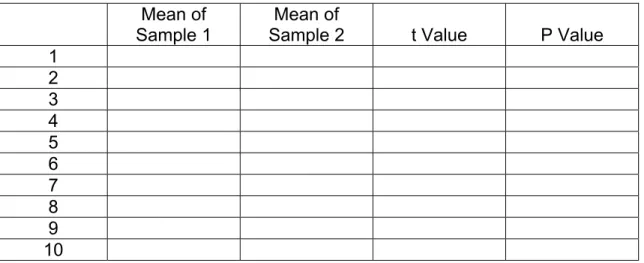
Table 1. Results of 10 independent t-tests
Mean of
Sample 1
Mean of
Sample 2 t Value P Value 1 2 3 4 5 6 7 8 9 10
What is a Type I error? Did you get any P value less than 0.05 (type 1 error)? Please calculate the probability of a Type I error based on all the results of t-tests your classmates did in your laboratory. Why did we get a P value less than 0.05 from the same population?
Get one sample (n1=10) from a normal distribution population, N (6,1), and another sample (n2=10) from another normal distribution population, N (8,1), by random sampling. Perform the independent t-test Procedure. Please repeat 10 times, and fill in Table 2.
SAS program
title1 '********************************************************';
title2 ''Probability of type 2 error by Henian Chen 2002-08-22';
title3 '********************************************************'; data type2error; do i=1 to 10; j=1; x=rannor(0)+6; output; end; do i=1 to 10; j=2; x=rannor(0)+8; output; end; proc ttest; class j; var x; run;
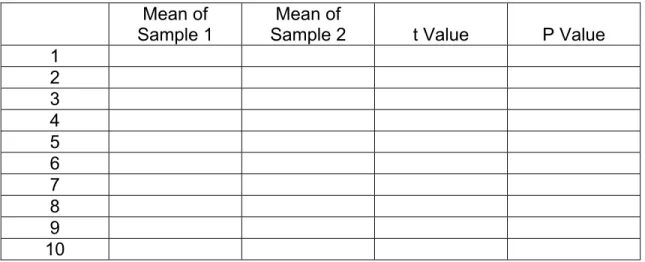
Table 2. Results of 10 independent t-tests
Mean of
Sample 1 Sample 2 Mean of t Value P Value 1 2 3 4 5 6 7 8 9 10
What is a Type II error? Did you get any P value greater than 0.05 (type 2 error)? Please calculate the probability of a Type II error based on all the results of t-tests your classmates did in your laboratory. Why did we get a P value big than 0.05 from the two different populations? What is the relationship between sample size and the probability of a Type II error? Would you like to rerun this program by using a bigger sample, say n=50 or 100?
Power Calculations
1. For the Esophageal Cancer Study there are 200 cases and 778 controls. As the study has already been conducted, this sample size is fixed. What we can compute, however, is the range of statistical power we expect based on different scenarios.
Assume the following: 1) Sample size as given 2) Type 1 error of .05
3) Range of exposure prevalences in controls as listed in table 4) Range of detectable odds ratios
a. Fill in the Table 3 by putting in the estimate of statistical power for each cell by using the following SAS program.
title ' Statistical Power Calculations';
data power; c=3.89; n=200; do p0=0.05 to 0.50 by 0.05; do or=1.5 to 3.0 by 0.5; q0=1-p0; p1=(p0*or)/(1+p0*(or-1)); q1=1-p1; pbar=(p1+c*p0)/(1+c); qbar=1-pbar; zbeta=(sqrt(n*(p1-p0)**2)-1.96*sqrt((1+1/c)*pbar*qbar)) / sqrt((p1*q1)+p0*q0/c); power=probnorm(zbeta); output; end; end; run;
proc print data=power;
var p0 or zbeta power;
Table 3: Calculate power with varying exposure prevalence & OR Exposure Prevalence Detectable Difference (ORs) 5% 10% 20% 25% 50% 1.5 .27 .60 .65 2.0 .86 .98 .99 2.5 .88 .99 >.99 >.99 3.0 .97 .99 >.99 >.99 >.99
b. Using the information in Table 3, how much statistical power do we have for the parent study?
2. Estimate the statistical power for a study with the following parameters: (i) Range of sample sizes (50 to 300), case:control ratio=1
(ii) Type 1 error of .05
(iii) Range of exposure prevalence in controls is fixed at 30% (iv) Range of detectable odds ratios (1.5 to 4.0)
a. Fill in the Table 4 with estimates of statistical power for each cell (Refer to the SAS program for Table 3).
Table 4: Calculate power with varying sample size & OR Sample size Detectable Difference (ORs) 0 50 100 200 300 1.0 .025 .025 .025 .025 1.5 .024 .16 .27 2.0 .023 .65 .92 .98 3.0 .021 .76 >.99 >.99 4.0 .019 .93 .99 >.99 >.99
b. Using the following commands, plot five power curves which are associated with different odds ratios (ORs from 1 to 4) and different sample sizes (n from 50 to 300) when the prevalence of exposed among controls is 30%, type I error (α) =.05, and equal number of cases and controls.
data powercurves; input or n power; cards; 1.0 00 .025 1.5 00 .024 2.0 00 .023 3.0 00 .021 4.0 00 .019 1.0 50 .025 1.5 50 .157
. . . enter data here
. . . . . . . . . . . . . . . 4.0 300 1.000 ; run;
procgplotdata=powercurves;
plot power*n=or; symbolline=1width=5 interpol=join;
title'Figure 1. Power curve with varying sample size & OR';
run;
quit;
c. Examine the plot and answer the following questions.
i. Describe the relationships between statistical power, sample size and detectable differences.
ii. Which parameter (n or OR) is relatively more important in terms of increasing the statistical power?
3. An investigator is applying for a NIH grant and wants to show to his/her
reviewers that the proposed study has at least 80% statistical power to detect an association of 2.0 (i.e., OR=2.0) when the exposure prevalence among controls is 30%, type I error=.05. The cost of recruiting cases is much more expensive than controls. Facing a budget constraint, the investigator has to limit the recruitment of cases to 100.
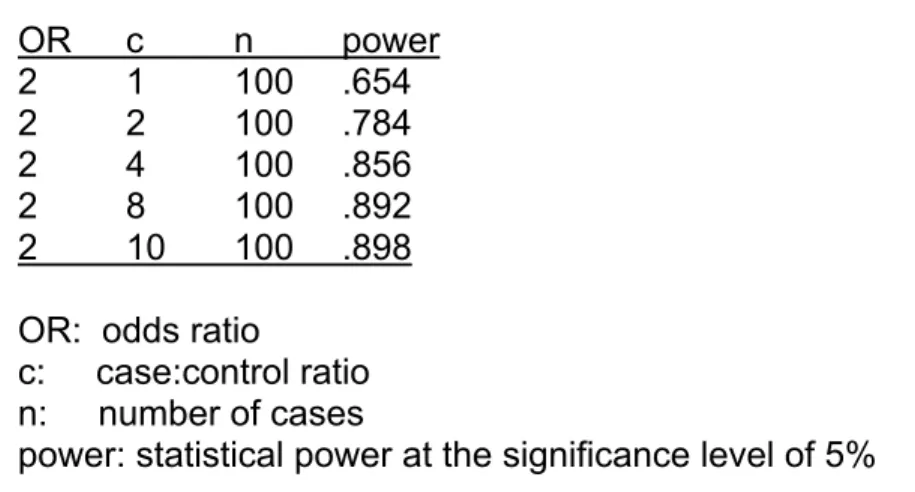
a) Based on the information in Table 5 below, plot a power curve with varying case:control ratios for this particular study (Refer to the SAS program for Table 4) and suggest ways to increase the statistical power.
Table 5. Statistical power with varying case:control ratio scenarios OR c n power 2 1 100 .654 2 2 100 .784 2 4 100 .856 2 8 100 .892 2 10 100 .898 OR: odds ratio
c: case:control ratio n: number of cases
power: statistical power at the significance level of 5% b) Referring to the power curve, how many cases and controls would this investigator need in order to have at least 80% power?
c) Beyond which case:control ratio (c) that you would not recommend to increase the statistical power? Why?
We will practice Multiple Regression in the next week’s laboratory. Please bring the dataset ‘life-satisfaction751.txt’.