Computer support of effective peer assessment
in an undergraduate programming class
J. Sitthiworachart* & M. Joy†
*Faculty of Information Technology, King Mongkut’s Institute of Technology North Bangkok, Bangsue, Bangkok, Thailand †Department of Computer Science, University of Warwick, Coventry, UK
Abstract Active learning is considered by many academics as an important and effective learning strategy. Assessment is integrated in learning as a tool for learning, but traditional assessment methods often encourage surface learning (passive learning) rather than deep learning (active learning). Peer assessment is a method of motivating students, involving students discussing, marking and providing feedback on other students’ work, and is one of the successful approaches which can be used to enhance deep learning. Students are required to think criti-cally about what they are learning during the peer assessment process. Tutors’ marking is usually accepted as reliable, but student peers’ marking in a peer assessment process is suspect. As part of a study investigating whether peer assessment can be an accurate assessment method in a computer programming course, a novel web-based peer assessment tool has been developed. In this paper, we describe the tool and report the results of evaluating the tool through experiments involving large programming classes. The results suggest that computer-mediated peer assessment is a valuable assessment approach which promotes active learning and is an accurate assessment method in a programming course.
Keywords assessment tool, deep learning, peer assessment, programming language, technology assess-ment, web-based education.
Introduction
Learning is increasing knowledge and understanding. Some students see learning as a matter of memorizing and comprehending knowledge only to cope with course requirements, and these are strategies in surface learning (Entwistle 2001). Others see learning as a way to satisfy their own requirements to develop new skills by relating previous knowledge with experiences, and these are strategies in deep learning (Entwistle 2001). Encouraging creative thinking in science and technol-ogy is particularly difficult, as the lower level of
learning is often emphasized, and the teaching is instructor-focused, which is a passive learning method (Entwistle 2001; Robinset al. 2003).
When designing tools to encourage students in learn-ing computer programmlearn-ing, the development of higher cognitive (deep learning) skills should be considered (Deek & McHugh 1998). Many tools have been created to help students to learn, especially for novice program-mers in an introductory programming course. However, most tools are appropriate for surface learning, such as helping in program construction, compilation, testing and debugging (Deek & McHugh 1998).
Peer assessment involves students in the learning and in the assessment process. It is a tool for learning, and students can learn through marking by making judgements and providing feedback on other students’ work (Brownet al. 1997; Davies 2000). Students have Accepted:26 July 2007
Correspondence:Jirarat Sitthiworachart, Faculty of Information Technology, King Mongkut’s Institute of Technology North Bangkok, Bangsue, Bangkok 10800, Thailand. Email: [email protected]
opportunities to compare and discuss about what consti-tuted a good or poor piece of work during the peer assessment process. Dochy and McDowell (Dochy & McDowell 1997) remark ‘peer assessment is not only a tool to provide a peer with constructive feedback which is understood by the peer. Above all, peer assessment is a tool for the learner himself’. Linet al. (Linet al. 2001) also state that receiving many and frequent peer feed-backs help achieve better learning outcomes.
Many studies about peer assessment emphasize dif-ferent issues, such as plagiarism in essay assignments (Davies 2000), and contributions of individual grades in group work (Lejk & Wyvill 2002). We are interested in finding out whether peer assessment, which is a power-ful technique for fostering deep learning, is an accurate assessment method in a computer programming course. Tutors’ marking is usually accepted as reliable, but student peers’ marking in a peer assessment process is potentially suspect. Many studies about peer assessment report that students think peers’ marking may not be as accurate as tutors’ marking (Orsmond & Merry 1996; Davies 2000; Topping et al. 2000; Ballantyne et al. 2002). Therefore, the accuracy of the peer assessment method in a programming course should be assessed. In this paper, we describe a novel peer assessment tool and report the results of evaluating the tool through experi-ments involving large programming classes.
Web-based peer assessment
The peer assessment investigation was performed on 213 first year undergraduate students enrolled on a first year UNIX programming module in the authors’ Computer Science department. During the process, the students marked and provided feedback on three con-secutive assignments, and each assignment was marked by an anonymized group of three students, using a web-based peer assessment system and an anonymous communication tool. These assignments were also inde-pendently double-marked by two module tutors, in order to provide an expert reference against which the marks awarded through the peer assessment process can be compared.
Methodology
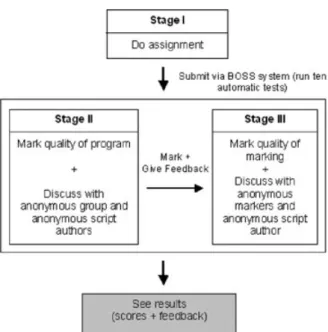
This peer assessment exercise was divided into three separate stages, as shown in Fig 1. The BOSS online
submission system (Joy et al. 2005) used in the peer assessment process is capable of running automated tests, running students’ submissions against a set of test cases. The automated test results were made available to markers along with the original submission through stages II and III, in the hope that the extra information would help students to understand the submissions while marking. In the second stage, students marked the quality of programming, and in the third stage, students marked the quality of the initial marking by responding to the 10 questions that form the marking criteria (i.e. program readability, correctness of program and pro-gramming style), and throughout the process discussed anonymously using the Anonymous Communication Device (ACD). Thus, students reflected on their own ideas by providing comments and discussing in a variety of roles (script authors, marker and feedback marker) using the ACD. As students have different levels of knowledge and ability in marking, guidelines were provided to identify the potential attributes of a good answer.
Architecture
The web-based peer assessment tool which we have developed incorporates an ACD which encourages Fig 1 Peer assessment process consists of three separate stages, including (1) students do the assignment in their own time; (2) students mark the quality of programming; and (3) students mark the quality of initial marking.
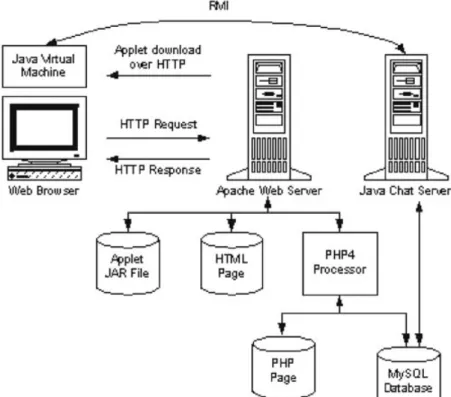
students to interact with each other, and hence supports independent learning (Turbanet al. 2005). The imple-mentation uses a PHP-enabled Apache server, accessed using a client Java applet for the ACD (see Fig 2). Stu-dents’ responses to the questions forming the marking criteria are recorded in a MySQL database, and we refer to an individual student’s set of responses as a ‘script’. Once the applet has been downloaded (using http), it creates its own connection to another server program, the ‘chat server’.
Mark assignment
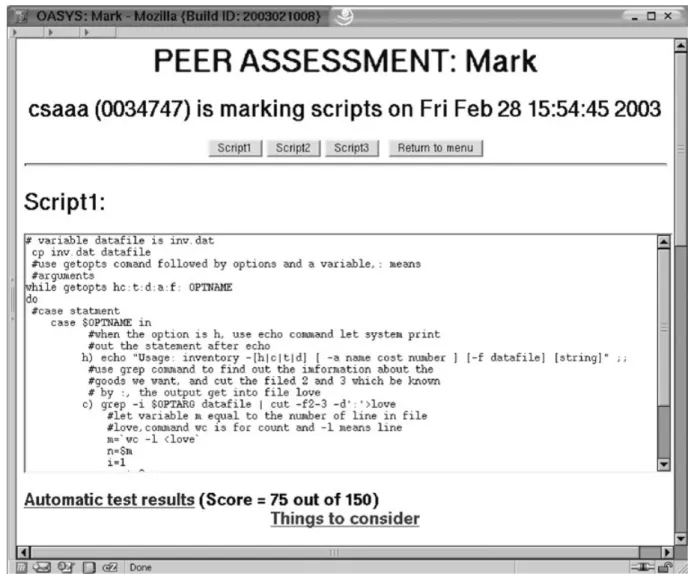
This tool provides anonymity for all users. Students are allowed to revise the marks they give until the marking deadline is reached. They receive a username and pass-word by e-mail: before starting the peer assessment exercise. After students login, the menu page displays the three steps for students to follow (i.e. mark the assignment, mark the quality of marking and see their own mark). The ACD window pops up automatically after students commence each marking step. They can easily see the scripts that they have been assigned to mark by clicking on the script buttons (Fig 3). They can view the automatic test results by clicking on the link on
each script page to open a popup window displaying the results. A ‘Things to consider’ link is provided below containing marking guidance.
ACD
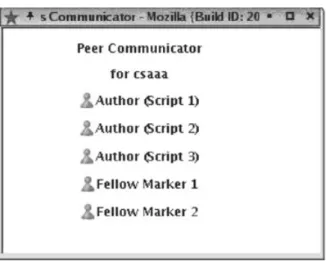
Figure 4 displays the three script authors of the assign-ments that students will mark, and two other fellow markers who mark the same assignments. If any one of these five persons is online, the students can talk anony-mously by clicking on the picture of that person, and a window dialog will appear. If that person is offline, stu-dents can leave offline messages. The second step – ‘marking the initial marking’ is similar, but the ACD allows the student to communicate only with one script author and the three markers who marked this script in the previous step. Thus, students can reflect on their own ideas by providing comments and, in a variety of roles, discussing with each other using the ACD.
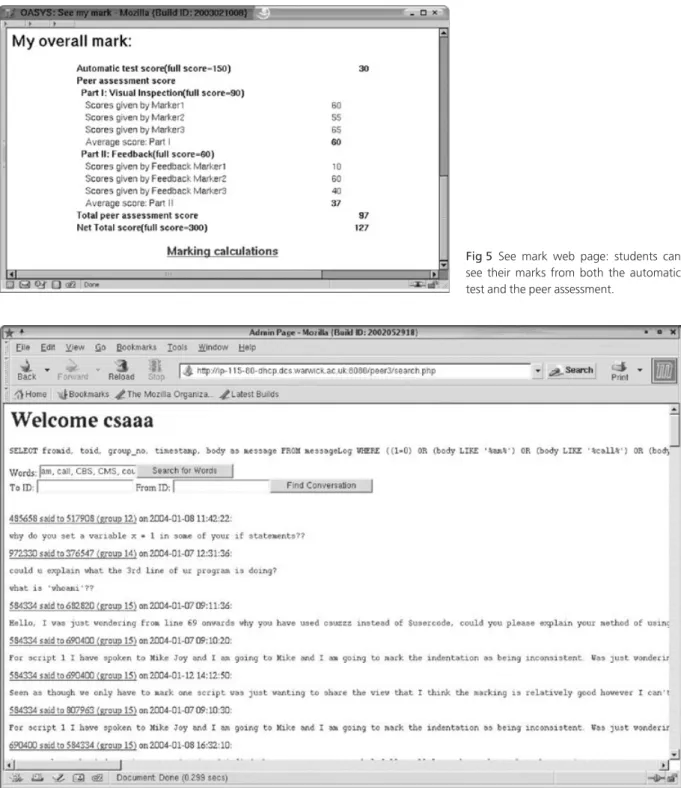
See marks
In this final step, students can see their marks from both the automatic test and the peer assessment (Fig 5). A ‘Marking calculations’ link at the bottom of the page
Fig 2Architecture of the web-based peer assessment system.
provides an explanation of how the overall mark is calculated. If the students do not mark any of three scripts, they may lose some marks. The marks and com-ments that the three peer markers gave the student’s assignment are also available, and include the mark that they were given based on the quality of their own marking.
Monitor marking
An administrator can monitor both the students’ marking and their conversations. A ‘monitor marking’ web page reports the students’ marks and any absent markers. The standard deviations of the three markers
for both marking the quality of program and quality of initial marking are calculated in order to know how spread out the marks are. If the standard deviation is less than a preset value, it is acceptable, but if the standard deviation is more than a given upper limit, it means the marks from the three markers have a very wide range, which suggests that the tutor may have to reconsider the marks for that student.
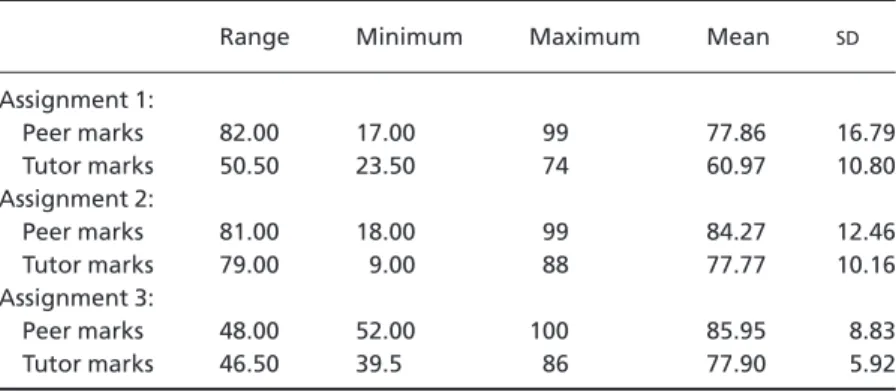
An administrator can also monitor the ACD in order to intercept inappropriate messages and conversations. The ‘ACD monitoring’ web page (Fig 6) reports all the students’ conversations through the ACD and can be used to search through the conversations of each indi-vidual group.
Fig 3Assignment script onMarkweb page:in this visual inspection step, students mark and provide feedback on the other three stu-dents’ assignments.
Results and discussion
At the end of each assignment, each student was required to fill in an online questionnaire, and at the end of the whole process, 20 volunteer students were inter-viewed. Peer and tutor marking are compared, using from an analysis of the total marks, the details of each mark awarded, and comments made according to the marking criteria. Marks within individual groups are also analysed to find out the consistency of group marking, and the marks from students with different abilities are compared. In addition to the analysis of both peers’ and tutors’ marking, questionnaires and inter-views were used to ascertain how satisfied students were with their marks, together with their opinions regarding the marking and the feedback they received (Fig 7).
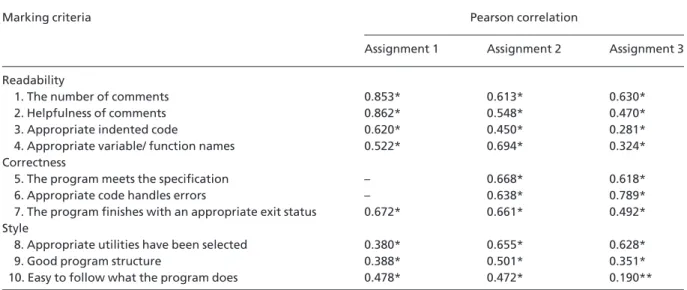
Table 1 summarizes the statistics relating to tutors’ and peers’ marks for program quality, based on 166 stu-dents from three assignments. Each mark is out of 100. Each of the marks in the three assignments is calculated from the average marks, given by two tutors (tutor marks), and the average marks given by three students (mixed range of student ability – peer marks).
In this experiment, the average of the peers’ marks is higher than the average of the tutors’ marks – 17%, 7% and 8% in assignment 1, 2 and 3, respectively. The dif-ference between the average marks decreased from assignment 1 to 3 because students had experience in marking from the first assignment. They knew exactly what the markers were looking for and they learned more about how to mark properly.
The 1st peer review, the marking is like ‘Oh my God, I’m marking someone else’s work’, whereas by the 3rd one you’re like ‘They don’t deserve that many marks, and I can’t give it to them’.
Relationship between marks given by the tutors and by peers
The relationship between the marks given by tutors and by peers is represented by the correlation coefficient. Two sets of marks correlate if changes in the peers’ marks are associated with changes in the tutors’ marks. A Pearson correlation is used to investigate the relation-ship between peers’ and tutors’ marks, as the distribu-tion of the interval data are close to normal (Vaus 2002). The Pearson correlation coefficients in the three assignments are positive and substantial (r>0.60 and Sig. (two-tailed)=0.000). The positive correlations achieve a high level of statistical significance because P<0.01 (Miller et al. 2002) (a significance level of 0.000 meansP<0.0005) (Best & Kahn 1989; Pallant 2001). There was the strongest positive relationship between the peers’ and the tutors’ marks in assignment 1 (r=0.85,n=166,P<0.0005). When the marks given by tutors are high; the corresponding marks given by peers are also high.
Interpretation of a correlation coefficient (Vaus 2002): Coefficient (r) Relationship • 0.00 to 0.20 Negligible • 0.20 to 0.40 Low • 0.40 to 0.60 Moderate • 0.60 to 0.80 Substantial
• 0.80–1.00 High to very high
However, the correlation coefficient in assignment 3 (r=0.62,n=166,P<0.0005) is lower than the corre-lation coefficients in assignments 1 and 2. This may be because assignment 3 is the most difficult assignment. Students have many assignments to finish at the same time at the end of term; therefore, they may not devote as much time to the marking process as they did earlier in the term.
Difference between marks given by the tutors and by peers
The results in the previous section suggest that there is a strong correlation between the marks awarded by a tutor Fig 4Anonymous communication applet: students can discuss
anonymously via ACD in a variety of roles (e.g. marker, feedback marker, author). ACD, Anonymous Communication Device.
and those awarded by peers, but the averages of the marks given by peers are higher than the averages of marks given by tutors. In this section, the differences between the marks given by the tutors and peers are
analysed. The purpose ofpaired-samples T-testis to test for significant differences between two group means from data that have been gathered by means of related measures design (Best & Kahn 1989; Pallant 2001). Fig 5See mark web page: students can see their marks from both the automatic test and the peer assessment.
Fig 6Anonymous Communication Device (ACD) monitoring web page reports all the students’ conversations through the ACD and can be used to search through the conversations of each individual group.
Therefore, this statistical test is considered to accept or reject the hypothesisH0below.
Hypothesis
H0: the mean of the peers’ and the tutors’ marks is not
sig-nificantly different
H1: the mean of the peers’ and the tutors’ marks is
signifi-cantly different
A 95% confidence interval for the difference in means is commonly used (Bryman & Cramer 2001). If the Sig. (two-tailed) value is less than 0.05 then there is a signifi-cant difference in the mean marks of the tutors and the peers. The differences in the mean marks of the three pairs are 16.89, 6.51 and 8.05, respectively. As the Sig. (two-tailed) values of all three pairs (0.0005) are less than 0.05, there are significant differences in the mean marks of tutors and peers (rejectH0).
The differences between the peers’ and the tutors’ marks may result from the different marking
perspectives. Students tend to give full marks for a program that they think is good, but tutors tend to give around 70% for the same program, as the following quote from a tutor illustrates. It is interesting that stu-dents tend to be comfortable with high marks, whereas tutors do not.
I don’t think I would give full marks for an assignment as a whole as it’s very difficult to say that something is 100% correct and it also gives the student the impression there is no room for improvement. In my view 70% is a good assignment mark. I consider 80% as a high mark and would very rarely give students a mark greater than this.
Marking criteria
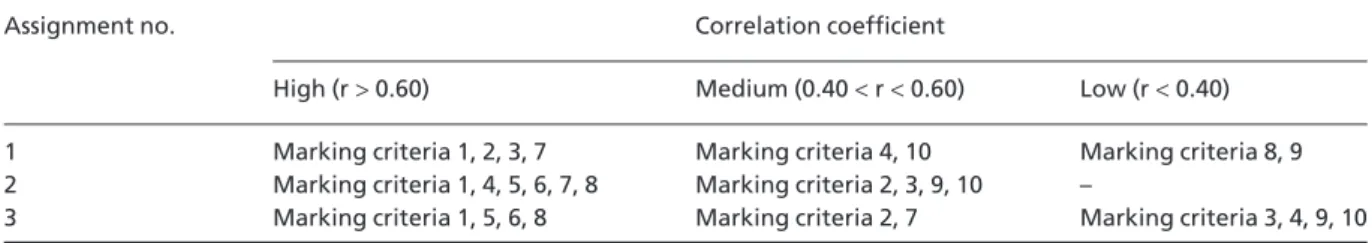
The correlations between the peers’ and the tutors’ marks (for each marking criterion) are analysed in more detail in this section, in order to find out for which marking criteria the peers’ marking is as accurate as the tutors’. Tutors and peers marked the assignment by answering the same questions specified in the marking criteria, which relate to program quality (i.e. readability, correctness and style). The marking criteria for assign-ment 1 consisted of eight questions, and assignassign-ments 2 and 3 each contained 10 (see Table 2). The number of questions was different because of the size and diffi-culty of the assignment. The Pearson correlation was used to identify the relationship between the tutors’ and the peers’ marks on 165 individual assignments for each marking criterion (Table 2).
Assignment 1
The strongest positive relationship (at a high level of statistical significance) between the tutors’ and the Fig 7Accuracy of the peer assessment analysis by comparing
peer and tutor marking (both marks and feedback), analysing marking within groups of peers and evaluating students’ opinions from the online questionnaire and interview results.
Table 1. Descriptive statistics of tutors’ and peers’ marks in three assignments (n=166).
Range Minimum Maximum Mean SD
Assignment 1: Peer marks 82.00 17.00 99 77.86 16.79 Tutor marks 50.50 23.50 74 60.97 10.80 Assignment 2: Peer marks 81.00 18.00 99 84.27 12.46 Tutor marks 79.00 9.00 88 77.77 10.16 Assignment 3: Peer marks 48.00 52.00 100 85.95 8.83 Tutor marks 46.50 39.5 86 77.90 5.92
peers’ marks was for marking criterion 2 (r= 0.86, n=165,P<0.0005), and the least positive relationship was for marking criterion 8 (r= 0.38, n=165, P< 0.0005). Therefore, marking criterion 2 – ‘helpfulness of comments’ – was the easiest for students to follow, but marking criterion 8 – ‘appropriate utilities have been selected’ – generated the most inaccurate marking, probably because the assignment 1 is small and there was only a small choice of utilities. Most students have no experience in marking and this was the first assign-ment they marked.
Assignment 2
The strongest and weakest relationship between the tutors’ and the peers’ marks (at a high level of statistical significance) were both for programming readability – marking criterion 4 (r=0.69,n=165,P<0.0005) and marking criterion 3 (r= 0.45, n=165, P<0.0005), respectively. Most of the correlations are higher than 0.50, which means most of the peers’ marks and tutors’ marks have a strong positive relationship at a high level of statistical significance. However, students and tutors have a different opinion on marking criterion 3. Some students gave different marks for the same script and hesitated to give low marks for inappropriate indenta-tion, which inflated their marks compared with the tutors’ marks.
Assignment 3
The strongest positive relationship (at a high level of statistical significance) between the tutors’ marks and peers’ marks was for marking criterion 6 (r= 0.78, n=165, P<0.0005), and the lowest for criterion 10 (r=0.19,n=165,P<0.015). The level of relationship between peers’ marks and tutors’ marks varies within each category of marking criteria, as there are high and low correlations in the same category. The highest correlation was in the program correctness category.
These results are supported by the following comment on marking criteria from a tutor who found that the subjective questions are difficult to mark consis-tently compared with the objective questions. The sub-jective and obsub-jective questions are summarized in Table 3.
The marking criteria I found the most difficult were those which were subjective such as ‘helpfulness of com-ments’, and ‘easy to follow what the program does’. It is not possible to mark such a large number of scripts all in one go, so maintaining consistency in the subjective cri-teria across all scripts can be challenging. Marking crite-ria such as ‘the program finished with an appropcrite-riate exit status’, ‘the program meets the specification’, and ‘appropriate utilities have been selected’ are much more objective and therefore easier to mark in general, and also to mark consistently.
Table 2. Correlations between tutors’ and peers’ marks for each marking criterion (n=165).
Marking criteria Pearson correlation
Assignment 1 Assignment 2 Assignment 3 Readability
1. The number of comments 0.853* 0.613* 0.630*
2. Helpfulness of comments 0.862* 0.548* 0.470*
3. Appropriate indented code 0.620* 0.450* 0.281*
4. Appropriate variable/ function names 0.522* 0.694* 0.324*
Correctness
5. The program meets the specification – 0.668* 0.618*
6. Appropriate code handles errors – 0.638* 0.789*
7. The program finishes with an appropriate exit status 0.672* 0.661* 0.492* Style
8. Appropriate utilities have been selected 0.380* 0.655* 0.628*
9. Good program structure 0.388* 0.501* 0.351*
10. Easy to follow what the program does 0.478* 0.472* 0.190**
*Correlation is significant at the 0.01 level (two-tailed). **Correlation is significant at the 0.05 level (two-tailed).
Table 4 shows the grouping of strong, medium and low positive relationships between peers’ marks and tutors’ marks for the 10 marking criteria. The group arrange-ment is based on the interpretation of a correlation co-efficient by Best and Kahn (Best & Kahn 1989). Most correlations from the three assignments are high, which means that there is a strong positive relationship between peers’ marks and tutors’ marks. In particular, in assignment 2, there was no low correlation. As can be seen in Table 2,
• marking criterion 1 – ‘the number of comments’– was marked accurately by students in each assignment; • marking criterion 9 – ‘good program structure’ – is in
the low correlation group in assignments 1 and 3. It should be noted that the correlations between two tutors’ marks for each marking criterion in three assign-ments are similar to the correlations between the peers’ and the tutors’ marks in Table 2. A comparison between the correlations for the peers’ and the tutors’ marks, and
the two tutors’ marks, reveals that the variance in the students’ marks is similar to the variance in the tutors’ marks. It depends on the type of marking criterion (objective/subjective) and the level of difficulty of the assignment.
Comment issues
Most research in peer assessment has analysed only differences in the marks between peers and tutors. In this research, the quality of comments related to the marking criteria are analysed as well. The comments from tutors on students’ answers in assignment 3 were shorter than the comments from students, but this analysis focuses on the quality of comments, and other related issues, rather than the lengths of the comments. A random representative selection of 72 students’ sets of comments is analysed, comparing their comments with those from the tutors on the same assignments (see Table 5). These results are valid for the following reasons.
Table 3. Objective and subjective
ques-tion type in marking criteria. Marking criteria Question type
Objective Subjective Readability
1. The number of comments √
2. Helpfulness of comments √
3. Appropriate indented code √
4. Appropriate variable/ function names √
Correctness
5. The program meets the specification √ 6. Appropriate code handles errors √ 7. The program finishes with an appropriate
exit status
√ Style
8. Appropriate utilities have been selected √
9. Good program structure √
10. Easy to follow what the program does √
Table 4. Correlation coefficient for 10 marking criteria from the three assignments.
Assignment no. Correlation coefficient
High (r>0.60) Medium (0.40<r<0.60) Low (r<0.40) 1 Marking criteria 1, 2, 3, 7 Marking criteria 4, 10 Marking criteria 8, 9 2 Marking criteria 1, 4, 5, 6, 7, 8 Marking criteria 2, 3, 9, 10 –
• The results reflect the population, as a large (n=72) sample of student comments was randomly selected (CRS 2003).
• The peers’ results are similar to the results from Table 8 – the feedbacks from different ability groups.
Peer and tutor comment behaviours Tutor comments
Most of comments from tutors focus on program cor-rectness (39.77%), and the extra comments (additional to the marking criteria) identify program mistakes and provide further explanation (Table 6). However, most comments from tutors about program readability and style are concise without further explanation, as the fol-lowing examples illustrate.
• ‘Well written, clear layout and very well commented. Satisfies specification well’.
• ‘Layout could do more to improve readability. Use of alternative utilities could have made the script shorter and improved readability’.
• ‘Script is rather long and comments/layout could do more to increase readability’.
Peers’ comments
Most comments from students focus on program read-ability (41.72%) with a high percentage (60.73%) of explanations relating to awarding of marks, recommen-dations for other programming styles and suggestions for alternative solutions, as illustrated by the following examples.
• Pointing out program mistakes – ‘The program would generate an error if . . . Use something like . . .’
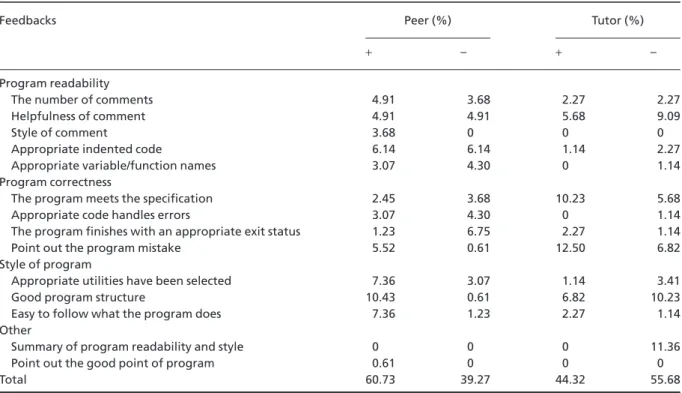
• Suggesting an alternative solution – ‘To reduce code, the line “. . .” could be used instead of . . .’ Table 5. Comparison between the peer and tutor feedbacks.
Feedbacks Peer (%) Tutor (%)
+ – + –
Program readability
The number of comments 4.91 3.68 2.27 2.27
Helpfulness of comment 4.91 4.91 5.68 9.09
Style of comment 3.68 0 0 0
Appropriate indented code 6.14 6.14 1.14 2.27
Appropriate variable/function names 3.07 4.30 0 1.14
Program correctness
The program meets the specification 2.45 3.68 10.23 5.68
Appropriate code handles errors 3.07 4.30 0 1.14
The program finishes with an appropriate exit status 1.23 6.75 2.27 1.14
Point out the program mistake 5.52 0.61 12.50 6.82
Style of program
Appropriate utilities have been selected 7.36 3.07 1.14 3.41
Good program structure 10.43 0.61 6.82 10.23
Easy to follow what the program does 7.36 1.23 2.27 1.14
Other
Summary of program readability and style 0 0 0 11.36
Point out the good point of program 0.61 0 0 0
Total 60.73 39.27 44.32 55.68
+With further explanation/ suggest other solutions. – Without further explanation/ no suggest other solutions. Calculation:
Percentage of feedbacks no of comments total no of comment =( . × ) . 100 ss x% = .
• Suggesting an alternative comment style – ‘I’m a huge fan of comments with brief descriptions before every function . . .’
• Commenting on the program structure – ‘The structure of the program is, on the whole, very good. Splitting the code into subroutines helps readability, and . . . The only suggestion I have would be . . .’
Peers’ comments compared with tutors’ comments The following are examples of feedback from peers and from the tutors marking the same script. In general, stu-dents and tutors have similar opinions about program readability, but they identify different programming issues. The tutors focused on programming mistakes, while students focused on the error handling functions, appropriate utilities and variable names. It seems clear that people provide different types of feedback, depend-ing on what they are interested in, but in general their opinions on a given program appear similar, as the fol-lowing quotes (relating to the same marked program) illustrate.
• Tutor: ‘The script doesn’t check for missing argu-ments to -o and -i options, otherwise it satisfies the specification. Clearly written, good use of functions. Comments could be more helpful.’
• Marker1: ‘The code is littered with useful comments . . . The error handling functions look correct as do the . . .’; ‘The utilities used have been selected appropri-ately, particularly the use of . . . The choice of shell_exec() has interested me – . . . – this seems like a much better alternative!’
• Marker2: ‘Overall good readability – well spaced out code which makes for easier reading . . . maybe some of the functions could have . . .’; ‘Ok, pretty good style, some pretty long if statements – (line 283) with embedded functions . . . These might have been better . . . Also a few if/elseifs maybe could have been better written with a switch/case . . .’
• Marker3: ‘The comments are good and descriptive, and the indenting is consistent . . . However, the vari-able names aren’t always good; for example, “dobYY” and “iArg” could be better . . .’
It can be concluded that peers identify similar comment issues to tutors (because of using the same marking cri-teria), and provide more explanations and suggestions than tutors who provide concise feedback without further elaboration. However, they focus on different issues – for example, tutors focus on program correct-ness (especially meeting the program specification, and whether there are programming mistakes), while peers focus on the program readability and style (see Table 6). Students also make suggestions about comment style, Table 6. Summary of peer and tutor
feed-back percentage. Feedbacks Peer (%) Tutor (%)
+ – Total + – Total Program readability 22.70 19.02 41.72 9.09 14.77 23.86 Program correctness 12.27 15.34 27.61 25.00 14.77 39.77 Style of program 25.15 4.91 30.06 10.23 14.77 25.00 Other 0.61 0.00 0.61 0.00 11.36 11.37 Total 60.73 39.27 100 44.32 55.68 100
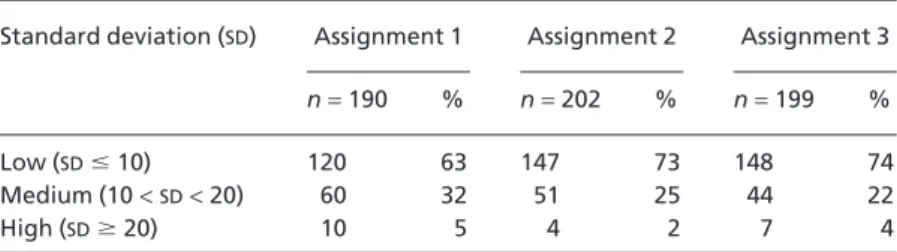
+With further explanation/ suggest other solutions. – Without further explanation/ no suggest other solutions. Table 7. Standard deviation of group
marks. Standard deviation (SD) Assignment 1 Assignment 2 Assignment 3
n=190 % n=202 % n=199 %
Low (SDⱕ10) 120 63 147 73 148 74
Medium (10<SD<20) 60 32 51 25 44 22
alternative utilities and program structure, for example encouraging the use of methods, which help to make a program easy to follow. Students tend to be concerned about program readability and style more than program correctness when they analyse other students’ pro-grams; however, most students provided useful comments.
Consistency of marks
Each group consisted of three students, with a mixed ability range. The standard deviation (sd) is calculated using the three marks (out of 90) from the three students in each group. The spread of the marks awarded by group marking is analysed in this section, and we discuss the problems of large mark differences within a group. Three categories ofsdare considered as follows:
Low marks are not much different
Medium marks are different
High marks are substantially different
As can be seen in Table 7, the number of high instances of sd decreased and the number of low instances increased, suggesting that group marking is more con-sistent in subsequent exercises. Most of thesds in the three assignments are low, which means the three markers are consistent. The percentage of low standard deviations increases from 63 to 74 (from assignment 1 to 3). The range of students’ abilities does not appear to have a significant effect on the marks awarded, and this is likely to be due the detailed marking guidance and the automatic test results provided. However, a small number of sets of marks have a high standard deviation, because of one of the three students providing a mark Table 8. The feedbacks from different ability groups.
Feedbacks Students’ abilities (%)
Good Average Poor
+ – + – + –
Program readability
The number of comments 7.22 2.06 2.94 5.88 4.94 2.47
Helpfulness of comment 5.15 2.06 5.88 4.90 6.17 6.17
Style of comment 0 0 2.94 0 3.70 0
Appropriate indented code 4.12 4.12 6.86 6.86 6.17 4.94
Appropriate variable/function names 8.25 4.12 4.90 3.92 2.47 8.64
Program correctness
The program meets the specification 10.31 1.03 7.84 0.98 2.47 0
Appropriate code handles errors 7.22 3.09 1.96 0.98 6.17 1.24
The program finishes with an appropriate exit status 2.06 8.25 2.94 0 1.24 2.47
Point out the program mistake 1.03 0 8.82 0 6.17 0
Style of program
Appropriate utilities have been selected 9.28 3.09 8.82 1.96 2.47 4.94
Good program structure 7.22 3.09 6.86 0 8.64 6.17
Easy to follow what the program does 5.15 2.06 7.84 3.92 6.17 3.70
Other
Suggestion to improve the program but it is not required in the program specification
0 0 1.96 0 0 0
Do not totally understand the program 0 0 0 0 2.47 0
Total 67.01 32.99 70.56 29.40 59.25 40.74
+With further explanation/ suggestions for other solutions. – Without further explanation/ no suggestions for other solutions. Calculation:
Percentage of feedbacks no of comments total no of comment =( . × ) . 100 ss x% = .
substantially different to the other two markers. One factor was the reluctance of some students to mark down, giving a high mark which their feedback com-ments did not support.
Student ability ranges
As results from the previous section indicate, marks within a group are not generally spread out. In this section, comments from individual students within each group are analysed. Each group of markers who marked the same scripts usually contained students of different abilities. Each student’s ability was classified by the number of marks from the automatic tests, as follows:
Good marks>80
Average marks in range 40–80% inclusive
Poor marks<40
We use this classification of student abilities first because the students who can write a correct program (pass the automatic tests) are likely to have a better pro-gramming ability than the weak students, and second because it is the only evidence available to us for creat-ing such a classification.
The comments from assignment 3 from 45 students with different abilities are compared in Table 8. The results in Table 8 suggest that the good students gave many comments with further explanations on ‘the program meets the specification’ and ‘appropriate utili-ties have been selected’, and that the percentages are similar to the feedbacks from the average students, but there are low percentages from the weak students. However, the highest percentage of feedback with further explanations from the weak students is on ‘good program structure’. This indicates that students who have poor abilities in programming may not be
inter-ested (or capable) of providing much feedback on the program correctness, but they provided more feedback with suggestions on program readability and style of program, attributes which do not require a thorough understanding of how a program works.
Questionnaire and interview analysis
This section discusses the students’ opinions about marking the program and how useful comments from peers were, with the following questions.
Are the comments from peers useful?
Results in Table 9 suggest that most students found the comments from peers with suggestions for improving their programming abilities to be useful, and helped them when doing the next assignment, as the following students’ quotes illustrate.
• Suggest alternative program solutions – ‘Some markers gave me alternative answers to the same question, which is good’.
• Point out program weaknesses – ‘It helped me focus on the weaknesses that I had and gave me more confi-dence in my ability’.
• Suggestions for program structure improvement – ‘They pointed out areas I could improve the com-menting of my code and how I could improve the structure of my programs’.
• Help for next assignment – ‘Since this assignment was the most complex, and worth . . . , I paid close attention to the comments given by students in the previous peer reviews to ensure that . . .’
• Encourage being a good programmer – ‘Comments are always helpful. Even if you have a perfect program that . . . , this is great encouragement. Or if Table 9. Responses from questionnaire and interview on useful comments.
Comments Students’ responses from
Questionnaire (yes/no question)n=104 Interview (n=20)
Useful 63 61% 12 60%
Most of them are useful – 0% 5 25%
Not useful 41 39% 2 10%
Not certain – 0% 1 5%
they spot some mistake . . . ; you get to learn very important things. (being anonymous has a point here, . . .). It is really a great opportunity to get into a pro-grammers’ atmosphere and have something to say.’
Are students satisfied with marks from peer assessment?
There were two sets of marks awarded by students in peer assessment (i.e. quality of program and quality of marking). Results from the questionnaires indicate that 74% of students (116 out of 156) were satisfied with their marks from peer assessment. However, some stu-dents were not satisfied with the marks awarded by peers for the following reasons.
• Harsh marks for the quality of marking – ‘I thought the marks received from part II were extremely harsh. Sure, I’m not the best marker in the world, but I feel that 10 and 15 out of 60 were unjustified.’
• Penalty marks for not completing the peer assessment process – ‘I marked the first script but then managed to forget to mark the remaining two. I do realize that this was fully my fault, but it does disappoint me.’ • Missing markers – ‘my work was not marked by all 3
and I only scored 60/150 in the automatic tests when all of them were successful.’
• Different interpretation of the assignment specifica-tion – ‘One guy marked me down because he dis-agreed with my interpretation of the assignment, which I deliberately put as a comment in the code, so the marker could see what I was doing and why.’ • Unfair mark compared with other students – ‘Not
fair. I know some . . . didn’t do much on error checking, . . .’
Do students feel comfortable when assigning marks? Results from the online questionnaire indicate that 122 students felt comfortable when assigning marks, but 44 students did not. The major problem seems to be that students believe that they are not qualified to be a marker because they have just started to learn how to program and they do not have enough knowledge to mark their friends’ work.
In the interviews, 11 out of 20 students indicated that they felt comfortable when assigning marks, though one student felt comfortable but only depending on the
dif-ficulty of the script. Most students appeared to under-stand what they were marking and 1–5 scales were appropriate for them and not difficult to make decisions on which marks to give. They seemed more comfortable with assigning marks in the subsequent peer assessment exercise because they learnt more from the other markers and had by then more experience in marking.
Anonymous marking is another factor that made stu-dents felt comfortable in assigning marks because they can concentrate on the program, not the person (friend-ship marking). However, a few students found that assigning marks is easy, but providing feedback on a good program is difficult.
Conclusions
The peer assessment process reported here is novel, as students are engaged not only in marking each other’s work, but also in evaluating the quality of marking of their peers. This stage helps students to develop their critical judgement skills and encourages them to take the assessor role in the previous stage seriously. More-over, the web-based peer assessment system which sup-ports this process is designed to provide anonymity throughout, in order to ensure the process is fair, and to encourage students to discuss without embarrassment.
The qualitative and quantitative analyses above suggest that peer assessment is an accurate assessment method for a programming course. Most students were actively involved in the learning process, were satisfied with marks given by their peers and accepted that the comments from peers were useful. The marking in this peer assessment process was possible because the system provided automatic test results, marking guid-ance and an anonymous communication tool. Students became familiar with the assessment process, and what is required to be achieved, and as they practiced their marking, their confidence increased. These results suggest that the web-based peer assessment system can be used to promote deep learning, and to develop stu-dents’ professional skills by requiring them to make evaluative judgements and provide specific feedback on other students’ work.
References
Ballantyne R., Hughes K. & Mylonas A. (2002) Developing procedures for implementing peer assessment in large
classes using an action research process.Assessment and Evaluation in Higher Education27, 427–441.
Best J. & Kahn J. (1989)Research in Education, 6th edn.
Prentice Hall, Upper Saddle River, NJ.
Brown G., Bull J. & Pendlebury M. (1997)Assessing Student
Learning in Higher Education. Routledge, London.
Bryman A. & Cramer D. (2001)Quantitative Data Analysis
with SPSS Release 10 for Windows: A Guide for Social Scientists. Routledge, London.
CRS: Creative Research Systems. (2003) The survey
system. Available at: http://www.surveysystem.com/sscalc. htm#terminology (last accessed 15 June 2005).
Davies P. (2000) Computerized peer assessment.Innovations
in Education and Training International (IETI)37, 346– 355.
Deek F. & McHugh J. (1998) A survey and critical analysis of
tools for learning programming.Computer Science
Educa-tion8, 130–178.
Dochy F. & McDowell L. (1997) Assessments as a tool for
learning.Studies in Educational Evaluation23, 279–298.
Entwistle N. (2001) Promoting Deep Learning Through
Teaching and Assessment: Assessment to Promote Deep Learning. American Association for Higher Education (AAHE), Washington, DC.
Joy M., Griffiths N. & Boyatt R. (2005) The BOSS on-line
submission and assessment system.ACM Journal of
Edu-cational Resources in Computing5, 1–28.
Lejk M. & Wyvill M. (2002) Peer assessment of contributions to a group project: student attitudes to holistic and
category-based approaches.Assessment and Evaluation in Higher
Education27, 570–571.
Lin S., Liu E. & Yuan S. (2001) Web-based peer assessment:
feedback for students with various thinking-styles.Journal
of Computer Assisted Learning17, 420–432.
Miller R., Acton C., Fullerton D. & Maltby J. (2002)SPSS for
Social Scientists. Palgrave Macmillan, New York.
Orsmond P. & Merry S. (1996) The importance of marking
criteria in the use of peer assessment. Assessment and
Evaluation in Higher Education21, 239–250.
Pallant J. (2001)SPSS Survival Manual: A Step by Step Guide
to Data Analysis Using SPSS for Windows (Version 10). Open University Press, Buckingham, UK.
Robins A., Rountree J. & Rountree N. (2003) Learning and
teaching programming: a review and discussion.Computer
Science Education13, 137–172.
Topping K., Smith E., Swanson I. & Elliot A. (2000) Forma-tive peer assessment of academic writing between
post-graduate students.Assessment and Evaluation in Higher
Education25, 149–169.
Turban E., Aronson J. & Liang T. (2005)Decision Support
System and Intelligent Systems, 7th edn. Pearson Education International, Upper Saddle River, NJ.
Vaus D. (2002)Analyzing Social Science Data: 50 Key