HAL Id: jpa-00254197
https://hal.archives-ouvertes.fr/jpa-00254197
Submitted on 1 Jan 1996
HAL
is a multi-disciplinary open access
archive for the deposit and dissemination of
sci-entific research documents, whether they are
pub-lished or not. The documents may come from
teaching and research institutions in France or
abroad, or from public or private research centers.
L’archive ouverte pluridisciplinaire
HAL
, est
destinée au dépôt et à la diffusion de documents
scientifiques de niveau recherche, publiés ou non,
émanant des établissements d’enseignement et de
recherche français ou étrangers, des laboratoires
publics ou privés.
Intermetallic Texture Analysis by X-Ray, Neutron and
Electron Backscattered Diffraction
T. Baudin, M. Dahms, C. Quesne, R. Penelle
To cite this version:
T. Baudin, M. Dahms, C. Quesne, R. Penelle. Intermetallic Texture Analysis by X-Ray, Neutron and
Electron Backscattered Diffraction. Journal de Physique IV Colloque, 1996, 06 (C2),
pp.C2-141-C2-146. �10.1051/jp4:1996219�. �jpa-00254197�
JOURNAL DE PHYSIQUE
IV
Colloque 2, supplement au Journal de Physique 111, Volume 6, mars 1996
Intermetallic Texture Analysis by X-Ray, Neutron and Electron
Backscattered Diffraction
T. Baudin, M. Dahms*, C . Quesne and R. Penelle
Universite' de Paris Sud Laboratoire de MLtaLZurgie Structurale, U.A. C.N.R.S. 1107, B&. 413, 91405 Orsay cedex, France
*
Institut fur Werkstofforschung, GKSS Forschungszentrum, Max-Planck-Str. 1, 21502 Geesthacht, GermanyAbstract. Texture characterization of intermetallic materials implies to solve the problem of overlapped pole figures of one or several phases when they are carried out by X-ray or neutron diffraction. Moreover, if the harmonic method is used to calculate the texture function, a complementary iterative method must be introduced to define the total texture function. A second iterative method must still be used to solve the problem of incomplete pole tigures measured by X-ray diffraction in reflection. An other approach consists in using individual orientation measurements, which allow to estimate the local texture which can be correlated to the microstructure but also to the global one if the orientation number is sufficient.
1. INTRODUCTION
Yamaguchi and Inui [l] showed that mechanical properties of the titanium aluminide (TiAI) strongly depend of the texture. So, it becomes useful to characterize quantitatively the texture using the Orientation Distribution Function (ODF).
The global (X-ray or neutron) and local (EBSD [2]) texture analyses are compared and discussed enlightening their respective advantages and disadvantages. So, when the ODF is calculated from pole figures measured by X-ray or neutron diffraction, it is necessary to separate the (002)/(200) ... overlapped reflections of the tetragonal phase and eventually the overlapping of some TiAl and Ti3Al (hexagonal phase) reflections in the case of y l a 2 aluminides [3]. On an other hand, to calculate the ODF from individual orientations, it is necessary to know the minimum orientation number to obtain a statistical ODF comparable to that calculated from pole figures.
The global texture analysis assumes the homogeneity of the microstructure because only 3 orientation parameters are measured knowing that a grain in a polycrystal is defined by 6 parameters. The 3 other parameters (or 2 in the case of a two dimensional analysis) correspond to the grain location parameters in the polycrystal that can only be defined from a local technique of orientation measurements.
2. ODF ANALYSIS
To calculate the ODF F(g) which corresponds to the probability to find grains with an orientation g within dg in the studied material, the harmonic method [4,5,6,7,8] is used and is described using the Roe formalism. From a global or a local analysis, the next equation must be solved :
F(g) =
C
C
C
f i , n ~ L (g) I m nC2-142 JOURNAL
DE
PHYSIQUE IVF(g) is expressed in the Euler space; g is an orientation characterized by
v,
8, cp (Roe notation) or cp,, $,1
q2 (Bunge notation); Tmn are spherical harmonic functions and flmn are the ODF coefficients.
2.1 X-ray or neutron diffraction
The equation which links the pole densities q ( q , ~ ) (normalized diffracted intensities at a point defined by the q and
x
spherical coordinates on the {hkl}pole figure) to the ODF must be solved :Where dy is the differential element of a rotation around the normal of the diffracting plane.
The two terms of this equation are thus expanded on the spherica1 harmonic basis. For the second term of equation (2), one finds equation (1) and for the first term of equation (2), one obtains :
After integration of F(g) (equation (I)), the new obtained expression is identified to equation (3) allowing to define a relation between the QIm and fimn coefficients, so :
So, the
fimn
coefficients corresponding to a set of experimental pole figures (the pole figure number defines the expansion order L) can be calculated. From the fl coefficients, the ODF can be thus calculated (equation (1)). Moreover, the pole densities correspon8ng to experimental pole figures or not can also be recalculated (equations (4 and 3)).2.1. I Incomplete pole figures
When the pole figures are measured by X-ray diffraction in reflection, the periphery of these pole figures cannot be determined because of the defocusing problem. Consequently, it becomes necessary to introduce a new mathematical approach which allows one to complete the pole figures. For that, an iterative method that takes into account the positivity condition of pole densities can be used (see [9,10] ; the method described in reference [9] is used in this study).
2.1.2 Overlappedpole figures (9,I I j
If the j index defines a phase, for the i overlapped pole figures of the j phases, one obtains
(with
x
Z a i j = l ) j=1 i=lConsequently, equation (4) becomes
Where the
fimn
and the a . . are the unknowns. To simplify the resolution, at the initial state (iteration NOO), the a values are assume2 to be known (so for example, if two pole figures are overlapped then al = a2'J
=0,5). Thus, it is easy to solve equation (7) because it is the same that equation (4) where only the fl coefficients are unknown. From the fimn coefficients, the Qlm corresponding to the non overlapped
px
figures can be recalculated and compared to the experimental overlapped ones. This comparison which uses a mean square method allows one to find new a . . values to continue the iterative calculation (equation (7)) until the convergency of the a . . values is obtaind.?I
2.1.3 Total texture function
The global texture analyses do not permit to separate the +hi et -hi directions of centrosymmetrical crystals [6]. In these conditions, it appears a mathematical indetermination since only the even part P(g) (I even)
-
can be calculated from pole figures. To assess the odd part P(g) and so the total ODF, it becomes necessary to introduce a new iterative procedure that allows one to estimate F(g) from F(g) using the-
positivity condition of F(g) (F(g) = S(g)
+
P(g) 2 0).2.1.4 Example
To sum up, in the more defavourable case, to calculate the ODF, it is necessary to use the harmonic method plus 3 iterative methods to solve the problems of incomplete and overlapped pole figures and to calculate the total ODF. To illustrate this approach a theoretical two phases (tetragonal and hexagonal) material is defined. Each phase is characterized by one orientation that is modelled with a gaussian function (see section 2.2). This approach allows one to construct pole figures :
"Tetragonal phase : 7 pole figures ( ~ = 2 2 , 6 7 , 8=56,14, (p=26,57 with c/a=2,0, $0=150 and L=22) "Hexagonal phase : 6 pole figures (~=8=(p=0,00 with c/a=1,6, $0=250 and L=22).
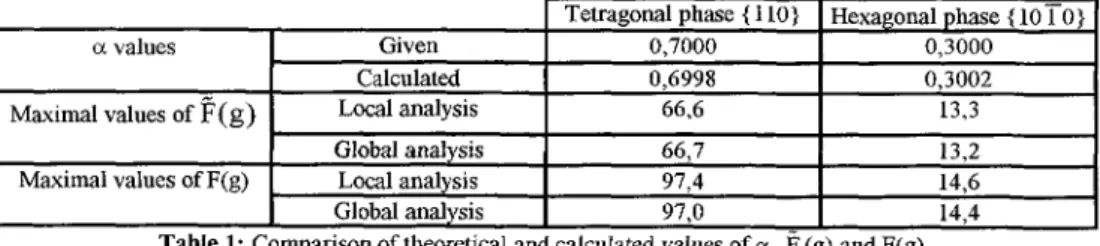
Then to assume X-ray measurements, the periphery (10") of pole figures is suppressed and finally, the { I 10) and ( 1 0 i 0 ) pole figures are numerically overlapped. Table 1 allows one to compare the given values to those calculated with the so described approach and shows the quality of this method.
cc values
Maximal values of (g)
Maximal values of F(g)
Table 1: Comparison of theoretical and calculated values of a,
F
(g) and F(g) Tetragonal phase { 116) 0,7000 0,6998 66,6 66,7 97,4 97,O Given Calculated Local analysis Global analysis Local analysis Global analysis Hexagonal phase { 1010) 0,3000 0,3002 13,3 13,2 14,6 14,4JOURNAL DE PHYSIQUE I V
2.2 EBSD
The flm coefficients can be calculated from individual orientations, each orientation being modelled with a gausslan function [12] :
K defines the gaussian function where the @O parameter characterizes the width at half height of the gaussian. Obviously, the main difficulty of this approach consists to choose the right number of orientations to calculate a statistical ODF i.e. comparable to the ODF calculated from pole figures measured for example by X-ray diffraction [13,14].
When this kind of local or global analysis is used, the microstructure is assumed to be homogeneous because only the 3 orientation parameters are taken into account. Only a local approach allows one to define the 6 (or 5 in the case of a two dimensional analysis) parameters allowing to weight each orientation by the grain area measured by image analysis or defined by an orientation number measured in the grain if the local measurements are performed on a defined grid. This last approach can be used when the EBSD is automatized (stage displacement and Kikuchi pattern indexation). This technique allowing to built up the studied microstructure is named Orientation Imaging Microscopy (OIM) [15]. The orientations are measured at each point of a XY grid (AX = AY > 0,1 pm). Then knowing that if two consecutive points have the same orientation they are in the same grain and on the contrary if the orientations are different a grain boundary separates the two points, it becomes easy to built up the grey level microstructure as a function of the Kikuchi pattern quality (white for beautiful patterns and black for poor patterns) or the color microstructure, each grain being colored according t o the crystallographic orientation [I 61.
3. GLOBAL TEXTURE OF A TITANIUM ALLOY ( 5 0 % ~ / 50%P)
The used titanium alloy was annealed t o obtain a "school" sample with two cubic and hexagonal phases having approximatively the same volume fraction. The texture of the two phases is characterized by X-ray diffraction in reflection and by EBSD. In the first case, 7 incomplete pole figures (10" at the periphery are not determined) have been measured knowing that the { 1 10) and (0002)and the (211) and (01 i 3 ) pole figures are overlapped. The ODF of each phase is calculated with L=34. In the second case, a square surface has been studied (X=Y=200pm; AX=AY=lpm). Figures l a and l b show respectively the experimental microstructure with a nodules in the
P
matrix and the microstructure built up from orientation measurements. In this last case, it is interesting to note that the volume fraction of cubic (grey) and hexagonal (black) phases have been found equal to 46 % and 54 % so very closed to the imposed volume fraction according to the heat treatment. One can observe that the grain boundaries are not perfectly define because the exploration step was too large. Indeed, to improve the microstructure definition (that is not the aim here) it is necessary to decrease the grid step.With the EBSD, it becomes easy to separate the two phases and so to calculate the corresponding ODFs. Figures 2a and 2b show the (pl=900 constant section plot of the ODF calculated for the cubic phase from pole figures measured by X-ray diffraction and from about 11200 individual orientations (@o=lOO, L=34) respectively.
The obtained results (main component near {130}<001>) are quite similar even if some differences appear firstly due to the sample location during the experiments and secondly to the choice of
4,
[14]. Moreover, it should be interesting to verifL if the orientation number or more exactly the grain number is sufficient to calculate an ODF, knowing that it appears some microstructural heterogeneities on figure lb.Figure 1: (a) experimental microstructure and (b) built up microstructure from EBSD
(a) (b)
Figure 2: (p,=90° constant section plot of the ODF calculated (a) from X-ray diffraction and @) from EBSD
4. LOCAL TEXTURE OF THE Ti48A148Cr2Nb2 ALLOY
This material so called GE (General Electric) provided by ONERA is particularly studied by
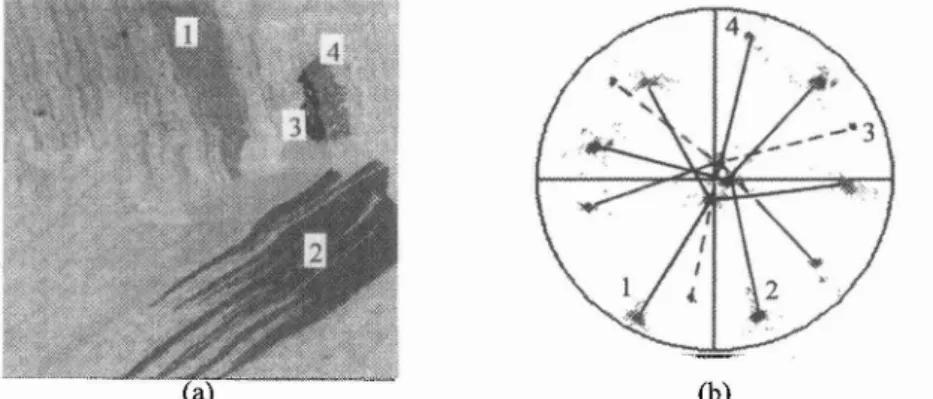
Dupont et al. [17]. Here, it is studied after a heat treatment (1 150°C-24 hours). The texture measured on the tetragonal phase (the volume fraction of the hexagonal phase is too low (about 5%)) by neutron diffraction (because of the large grain size) shows a { l l l ) < u v w > fiber texture (the fiber axis is perpendicular to the ingot axis). Figure 3a shows the microstructure (X=Y=350pm; AX=AY=lpm) built up from individual orientations and figure 3b shows that the crystallographic planes of lamellae sets (1 and 2) and twinned monolithic grain (about 23% of the volume fraction of the sample) (3 and 4) are near { I 11 } (see [l7]).
JOURNAL DE PHYSIQUE IV
5. CONCLUSION
The present study shows the advantages and the disadvantages of the global and local texture analyses in particular for intermetallic materials and in a general case for all multiphase materials. However, as it was described, all the disadvantages can be solved, and consequently it becomes difficult to choose the best method. In fact and in a general case, except for material with large or very large grains for which the X- ray and neutron cannot be used respectively, the two approaches are complementary.
In the case of EBSD measurements, the most important problem concerns the choice of the sufficient orientation number to calculate the ODF and it depends on the experimental procedure. Indeed, in a first approach, the orientations can be randomly measured on the surface analysed by X-ray diffraction and in a second approach, only a part of the microstructure can be analysed and in this last case, it is necessary to veri@ that the observed domain is representative of the total surface studied by X-ray diffraction.
Acknowledgements
Authors would like to thank S. Naka and M. Thomas from ONERA for fruithl discussions and for supplying the GE sample which was prepared by M.L. Dupont with LMS Orsay. TB and RP thank the DGADRET for its financial support that has permitted the development of a part of softwares.
References
[ l ] Yamaguchi M. and Inui H., "TiAl compounds for structural applications", First International Symposium on Structural Intermetallics, Seven Springs Mountain Resort, Champion, Pennsylvania, September 26-30 1993, R. Dariola, J.J. Lewandowski, C.T. Liu, P.L. Martin, D.B. Miracle and M.V. Nathal Eds. (TMS, Warrendale, Pennsylvania, 1993) pp. 127- 142
[2] Dingley D.J., "On line microtexture determination using backscatter Kikuchi diffraction in a scanning electron microscope", Eighth International Conference on Textures of Materials, Santa Fe, USA, September 20-25, 1988, J.S. Kallend and G. Gottstein Eds. (The Metallurgical Society, Warrendale, Pennsylvania, 1988).pp. 189-194.
[3] Dahms M., Beaven P.A., Tobisch J., Bermig G. and Helming K., Z. Metallkd. 85 (1994) 536-544. [4] Wiglin A.S., Soviet Phys. Solid State 1 (1960) 229-233.
[5] Bunge H.J., Z. Metallkd. 56 (1965) 827-874.
[6] Bunge H.J., Texture Analysis in Materials Science (Butterworth, London, 1982). [7] Roe R.J., J. Appl. Phys. 36 (1965) 2024-203 1 .
[8] Roe R.J., J. Appl. Phys. 37 (1966) 2069-2072.
[9] Dahms M. and Bunge H.J., J. Appl. Cryst., 22 (1989) 439-447.
[lo] Baudin T., Penelle R., Ceccaldi D. et Royer F., Mem. Sci. Rev. Met. NO10 (1990) 61 1-618. [ l l ] Dahms M., J. Appl. Cryst. 25 (1992) 258-267.
[12] Baudin T. and Penelle R., J. Appl. Cryst. 26 (1993) 207-213. [13] Baudin T. and Penelle R., Met. Trans., 24A (1993) 2299-23 11. [14] Baudin T., Jura J., Penelle R. and Pospiech J., J. Appl. Cryst (in press). [15] Adams B.L., Wright S.I. and Kunze K., Met. Trans. A. 24A (1993) 819-831.
[16] Baudin T., Paillard P. et Penelle R., C. R. Acad. Sci., Paris, t. 319, Serie I1 (1994) 1307-131 1. [17] Dupont M.L., Baudin T., Penelle R., Naka S. and Thomas M., this symposium.