No. 2011-014
US KNOWS US IN THE UK:
ON DIRECTOR NETWORKS AND CEO COMPENSATION
By Luc Renneboog, Yang Zhao
February 2011
Us Knows Us in the UK:
On Director Networks and CEO Compensation
Luc Renneboog a Tilburg University
Yang Zhao b Cardiff University
Abstract : We analyze the relation between CEO compensation and networks of executive and
non-executive directors for all listed UK companies over the period 1996-2007. We examine whether networks are built for reasons of information gathering or for the accumulation of managerial influence. Both indirect networks (enabling directors to collect information) and direct networks (leading to more managerial influence) enable the CEO to obtain higher compensation. Direct networks can harm the efficiency of the remuneration contracting in the sense that the performance sensitivity of compensation is then lower. We find that in companies with strong networks and hence busy boards the directors’ monitoring effectiveness is reduced which leads to higher and less performance-sensitive CEO compensation. Our results suggest that it is important to have the ‘right’ type of network: some networks enable a firm to access valuable information whereas others can lead to strong managerial influence that may come at the detriment of the firm and its shareholders. We confirm that there are marked conflicts of interest when a CEO increases his influence by being a member of board committees (such as the remuneration committee) as we observe that his or her compensation is then significantly higher. We also find that hiring remuneration consultants with sizeable client networks also leads to higher CEO compensation especially for larger firms.
Acknowledgements:
We are grateful to John Armour, Marco Becht, Lucian Bebchuk, Bernie Black, Riccardo Calcagno, Salim Chahine, Stijn Claessens, Mark Clatworthy, Thomas Crecquillon Martijn Cremers, Rafel Crespi, Peter Cziraki, Eric van Damme, Hans Degryse, Ingolf Dittmann, Piet Duffhues, Andrew Ellul, Allen Ferrell, Fabio Feriozzi, Fabiozi Ferri, Philipp Geiler, Marc Goergen, Willemien Kets, Christian Leuz, Marbri de Orto, Raghu Rau, Roberta Romano, Christophe Spaenjers, Oliver Spalt, Konstantinos Stathopoulos, Paolo Volpin and David Yermack for helpful comments on this paper. We would also like to thank the participants to seminars at the universities of Amsterdam, Tilburg, and Yale. The paper has also benefited from helpful comments - especially from the discussants Martin Conyon and Yuhai Xuan - at presentations at the Managerial Compensation Conference (2010) at the University of Cardiff, and the conference on Corporate Governance and Performance: Causation at Yale University (2010). All the remaining errors are ours.
Keywords: Executive remuneration, Professional and social networks, Corporate governance, Managerial Power,
Remuneration consultants. JEL codes: G3, J3, L14.
a Corresponding author. Department of Finance and CentER, Tilburg University, P.O. Box 90153, 5000 LE
Tilburg, the Netherlands, and European Corporate Governance Institute (ECGI), email: [email protected], phone: +31 13 4668210, fax: +31 13 466 2875.
b Cardiff Business School, Aberconway Building, Colum Drive, Cardiff CF10 3EU, the UK, email:
Introduction
“The strength of a wide-band professional network is that it gives access to deep
and tacit knowledge across a range of areas that you could never hope to touch, understand or gain access to.” (Mick Cope)
“The practice of interlocking directorates is the root of many evils. It offends laws human and divine." ... "Applied to corporations which deal with each other it tends to disloyalty and to violation of the fundamental law that no man can serve two masters. In either event it tends to inefficiency; for it removes incentive and destroys soundness of judgment. It is undemocratic for it rejects the platform: 'A fair field and no favors' " (Louis Dembitz Brandeis)1
Social and professional networks govern our lives; they are established through education, sports interests, club memberships, as well as connections resulting from our professional activities. The economics and finance literature has begun to pay more attention to the influence of managers’ and non-executive directors’ connections on corporate decision making and monitoring. Indeed, the effectiveness of corporate governance and corporate decision making may be significantly affected by formal and informal professional and social networks. For instance, Seidel, Polzer and Stewart (2000) document the strong impact of social ties on wage negotiations of minorities. The discriminating effect against minorities in the recruiting process of US high-tech companies is substantially lower when individuals belonging to minorities are referred to the firm by a friend or relative working in that firm. Educational networks of mutual fund managers influence their investment decisions as they are more likely to invest in firms managed by people who have studied at the same university (Cohen, Frazzini and Malloy, 2008a). These investments in ‘connected’ firms perform better. Cohen, Frazzini and Malloy (2008b) also document the impact of sell-side analysts’ social networks on their ability to collect superior information. They find that analysts perform better in terms of their stock recommendations if they have educational connections with companies’ directors. Hochberg et al. (2007) conclude that venture capital (VC) funds' performance is positively affected by the influence of the network positions enjoyed by the VCs’ parent firms. In contrast, networks may also have a detrimental effect on decision making. For instance, Kuhnen (2009) studies the effect of the professional networks of US mutual funds’ directors on their decisions on the hiring and contracting of fund advisors. If a candidate fund advisor is connected to the fund’s director through past business relationships, he/she is more likely to be appointed and paid a higher management fee. The fact that the returns of funds with advisors connected to the board of
1 Brandeis was Associate Justice on the US Supreme Court and made this statement before the passing of the
Clayton Act (1914) which prohibited extensive director networks as these could lead to collusion in concentrated industries. The quote appeared in the US House of Representatives Staff Report to the Antitrust Committee (1965:3).
directors are significantly lower than the returns on funds without such connections suggests that networks can bring about agency costs.
This paper examines the role of director networks on the top manager’s compensation and the pay-setting process in the UK. It is important to note that we will use the UK definition of a director who can be either an executive or a non-executive director.2 Over the past 15 years, executive compensation (around the world) has increased substantially at a pace significantly above inflation. Since the financial crisis that commenced in 2007, undeniable excesses in the remuneration policies have become manifest. When the S&P 500 stock index fell by 37.6% in 2008, 75% of the CEOs in the 2700 largest US companies received remuneration increases. Even in companies at the brink of bankruptcy, departing CEOs managed to enjoy huge severance packages. One example is Angelo Mozilo who was the CEO of Countrywide Financial that was saved by the Bank of America in June 2008, and was given $188 million as a send-off package. The UK situation is similar: in 2009, large companies including Marks & Spencer and HSBC generously increased their CEOs’ pay. In spite of academic doubts about the efficiency of the remuneration contract design (Bebchuk and Fried, 2003), the public debate on top management remuneration only flares up in times of crises such as the corporate governance/accounting disclosure crisis of 2000-2003 and the recent financial crisis. Each time, the top management remuneration practices are blamed to provide flawed incentives and to induce short-sighted corporate strategies (Hill, 2006). Curbing these remuneration practices proves to be difficult as soon as the outrage tones down. The arguments from the industry against curtailing managerial pay are usually that attracting talent necessitates adequate compensation as firms would otherwise lose their competitive edge. “We’re a very
big bank, we employ 200,000 people around the world […]. We have obviously got to pay our people appropriately. I think our customers will appreciate that people deserve a fair wage’ (HSBC gives its fat
cats ₤ 1.6 billion bonuses, 2010 (Guardian)). This is indeed the key question: is it the competitive market for managerial talent that sets the compensation contract or is the contracting process hijacked by the executive directors? In order to provide a (partial) answer this question, we study whether managerial pay and the pay-for-performance sensitivity is affected by professional networks, while controlling for the traditional explanations such as shareholder control and board composition.
Networks may be valuable to the firm for the following reasons: first, connections with (peer) companies through directorships enable a firm to gain access to information, even prior to its public disclosure. Such information is especially valuable when a firm is planning strategic alliances, mergers or acquisitions, or is expanding into new markets. Early notice of critical business changes allows the company to reconsider and adjust their own strategy in time. Furthermore, directors with strong networks
2 Executive directors are members of the board and exert a senior management position in the company (in the US,
they would usually be called officers). The non-executive directors (in the US often called directors) are board members who are not involved in the daily management; they often are managers in other firms.
are or develop into reputable figures in the society with access to politicians, employers’ organizations, and regulators. A network may also reflect managerial talent and a director’s past success in other firms. Thus, a large network reflects information, reputation and experience, and can be regarded as a guarantee of an executive director’s quality. For these reasons, directors’ connections may be valuable for a firm and translate into higher compensation and/or a different compensation contract structure. Key is that the value of a director to a company depends on the informational advantage generated by these connections, which allows a company to increase the compensation of its better connected executive and non-executive directors. The examples on pay excesses given above suggest that remuneration contracting is not necessarily a means to reduce agency problems but may be an agency problem itself if the remuneration contracting process is controlled by top management. Networked executive directors may accumulate
power and establish a stronger negotiation position vis-à-vis the board (and the remuneration committee)
such that they are able to design compensation packages that are beneficial to themselves but not to their corporations.
While some recent papers, such as Barnea and Guedj (2009) and Horton et al. (2009), relate pay to networks, our paper contributes to the literature in the following ways. First, we distinguish between the different roles of networks: managerial influence accumulation and information collection. Second, we separately study the strength of networks at the individual director level and at the company level, which are often mixed in the existing literature. Third, in addition to degree and (normalized) closeness, the network measures most frequently utilized in the network literature, we also employ (normalized) eigenvector centrality and (normalized) betweenness to capture different aspects of networks. Fourth, whereas most papers on networks employ cross-sectional data or data on a subset of companies (which may de facto invalidate network measurement), we have gathered a large data panel consisting of virtually all listed UK companies for a 12 year period (1996-2007), amounting to 13,854 firm years. Fifth, we control for the role of networks of remuneration consultants in the pay-setting process as well as internal and external corporate governance devices (shareholder voting concentration, board structure and composition, CEO characteristics, and corporate performance).
Our empirical analysis generates these insights. First, the network measures that are proxies of managerial influence explain higher CEO compensation and lower pay-for-performance sensitivity. Network measures that capture access to information and resources valuable to the firm are related to larger CEO remuneration, but do not have any impact on the pay-for-performance sensitivity. We demonstrate that managerial influence derived from networks has a stronger impact on compensation than the information value of networks. Second, at the company level, we use network measures to test the busy board hypothesis. Our results are in line with the hypothesis that companies with strong direct connections (which signifies that these directors are active in other firms and may hence be less effective monitors of the firm) over-pay their CEOs. Companies with networks yielding better information access
pay out a lower compensation to their CEOs, as they may rely less on the individual network of the CEO. Third, we confirm that there are marked conflicts of interest when a CEO is a member of board committees (such as the remuneration committee) because his or her compensation is then significantly higher. Fifth, the size of the client network of remuneration consultants increases CEO compensation, especially in large firms.
This paper is organized as follows. In Section 2, we discuss the literature and formulate the hypotheses. We describe in Section 3 how networks are captured and calculate the centrality measures. We discuss the methodology in Section 4 and summarize the descriptive statistics. In Section 5, we explain the results, while we discuss the robustness checks in Section 6. Section 7 concludes.
2. The Literature and Hypotheses
2.1 Director Networks and CEO Compensation
The optimal remuneration contracting view has been challenged by the rapid increase in managerial compensation and the lack of pay-for-performance sensitivity (Jensen and Murphy, 1990). A CEO can influence his remuneration contract when he holds a powerful position on the board, when directors are on each others’ remuneration committees which could lead to collusion, when non-executive directors are nominated by a dominant CEO, and when shareholder ownership concentration (and hence outside monitoring) is weak. We study this managerial power/influence (Bebchuk, Fried and Walker, 2002) or skimming (Bertrand and Mulainathan, 2001) view on compensation contracting, and focus – while controlling for shareholder control (Mehran, 1995) and board effectiveness (Yermack, 1996) – on the relation between executive and non-executive directors’ networks and the CEO’s compensation structure.
A CEO’s network grows stronger when he accepts more external directorships (Conyon and Read, 2004). Such a network can be used to extend the CEO’s power which could enable him to influence board decision-making to his own benefit. We label the connections built for the purpose of accumulating managerial discretion as managerial influence-oriented connections. Networks do not only increase a director’s influence but they also bring additional skills, knowledge, and information to the company, which may lead to corporate governance and performance improvements. Connections maintained for the sake of information collection are referred to as information value-oriented connections. Although most studies do not distinguish between the two functions of director networks, we use different types of centrality measures to describe a network’s different functions. Centrality measures that capture the level of connectedness in the local region based on adjacent connections are called the direct centrality
measures and are proxies for managerial influence (although they also yield information). We call the
distance to all other directors indirect centrality measures. They are used to evaluate the information value-oriented networks. It is important to understand that managerial influence and information collection are two aspects of the same network. These two functions are not exclusive; direct measures expressing managerial power or influence also capture information collection ability that could benefit the company. Nonetheless, the correlation between the direct and indirect centrality measures is low (see Section 3). This suggests that direct and indirect measures do indeed capture different aspects of the network which necessitates a separate analysis.
The (normalized) direct centrality measures are degree and eigenvector centrality which capture the power of the directors (for calculation details, see Section 3). Our managerial influence
hypothesis (hypothesis 1) states that: CEOs whose network consists of many direct connections can exert more managerial influence which is reflected in higher total compensation with low performance sensitivity. The value of the ‘managerial influence’ networks declines in the presence of a board with
more non-executive directors and of stronger shareholder power.
Guedj and Barnea (2009) show that the CEO’s compensation augments with network size. This result supports their reputation hypothesis: when directors are connected, they relax their monitoring of the CEO, which leads to CEO compensation increases. This is also in line with the essence of the managerial influence argument. Brown et al. (2009) broaden the professional network by also considering connections through education and social activities (golf club, charity organizations, etc). They find a positive relation between a CEO’s social network centrality and his total compensation, and an inverse relation between centrality and pay-for-performance sensitivity. Larcker et al. (2006) present an analysis with new director network measures which distinguish between friendly links and independent connections. They show that short friendly links are positively related to CEO compensation but negatively related to operating performance. This finding is also in line with the managerial influence hypothesis.
Director networks can have many advantages at the level of information collection. Early access to information can give a company a competitive advantage. Such networks may enable firms to develop more effective corporate strategies. In the managerial labour market, companies would hire or pay more to directors with networks of higher information value. The level of connectedness in terms of information transfers can be measured by indirect centrality measures: (normalized) closeness and betweenness. Once information emerges and spreads along the paths in director networks, a director with a high normalized closeness and betweenness has a higher probability of receiving this information (for calculation details, see Section 3). Our information-value hypothesis (hypothesis 2) states that: CEO
compensation increases with his access to information, which is proxied by his indirect network centrality based on his distance to other directors and his position in the entire network. The value of this information-network is reflected in higher compensation and a higher pay-for-performance sensitivity.
Crespi-Cladera and Pascual-Fuster (2008) analyze the correlation between executive directors’ pay and networks in Spanish electronics companies and provide evidence that CEO compensation reflects the information-collection value of networks. Likewise, Horton et al. (2009) find that executives’ network centrality is positively associated with their compensation. Executive directors seem to be rewarded for the resources they bring to a firm through their networks, while non-executive directors whose connections are more locally constrained earn a higher fee since their isolation may be perceived as an indication of their independence and superior monitoring capabilities.
Besides the individual level network measures, we also build networks at the company level where companies are vertices in the graph and shared directors are links between companies. The next two hypotheses on director networks evaluate the effects of managerial influence and information value from the perspective of the company rather than the CEO. In the literature on networks at the company level, it is argued that if a company has a strong network, it may be managed less well because non-executive directors have less time to monitor their firm and executive directors’ focus is dispersed (Fich and Shivdasani, 2006; Malmendier and Tate, 2009). Consequently, the governance of companies with many direct links may be deficient and may lead to a non-optimal compensation contracts. Hallock (1997) demonstrates that CEOs of interlocked companies earn on average a significantly higher monetary compensation than the non-interlocked ones and concludes (as do Fich and White, 2002) that board interlocks harm corporate governance efficiency and result in higher CEO compensation. We therefore formulate the busy board/managerial influence hypothesis (hypothesis 3) at the company level: In
companies with strong networks based on direct links, CEOs’ total compensation is higher with a lower pay-for-performance sensitivity.
If the company as a whole has good access to information throughout its directors’ networks based on indirect links and hence does not depend on the CEO’s network alone, there is less need to remunerate the CEO for his network. The company can then reward the CEO solely more for performance improvements. Therefore, we formulate the information value hypothesis (hypothesis 4) at the company level: The information collection efficiency as measured by indirect centrality at the
company level negatively affects the size of the CEO compensation package and improves the pay-for-performance sensitivity.
2.2 Controlling for Other Determinants of CEO Compensation
CEO compensation may not only be influenced by networks but also by corporate performance, the role of remuneration consultants, CEO characteristics such as tenure, board composition, ownership concentration by shareholder type, and some other characteristics including firm size, risk, or industry.
Remuneration consultants
Remuneration consultants have the best access to information on current remuneration practices and are influential in setting the remuneration policy of large firms. Through its remuneration consultant, firm A may gain access to the remuneration practices in its peer companies. The impact of a remuneration consultant on the remuneration policy of firm A can be twofold. A sudden increase in the remuneration in firm B belonging to a remuneration consultant’s network of clients may be quickly copied by the other clients (including A) of the consultant who hence spreads the information on the raising of the remuneration benchmarks. In contrast, remuneration consultants may advise that remuneration packages be based on objective standards and benchmarks that attenuate the upward spiral in compensation. Recent analyses seem to support that remuneration consultants are driving compensation up: Conyon, Peck and Sadler (2009), who investigate compensation consultants and executive pay in the US and the UK, conclude that CEO compensation is indeed larger and includes more equity-based compensation when a remuneration consultant is hired. Kabir and Minhat (2010) go one step further and report that CEOs’ equity-based compensation in the UK linearly increases with the number of remuneration consultants a firm hires. Moreover, the larger the consultant’s market share is, the higher the CEOs’ remuneration in the firms they advise. The authors conclude that competition between remuneration consultants leads to significantly higher executive compensation. We therefore expect a larger remuneration consultant network to contribute to higher CEO compensation.
CEO characteristics
A CEO with longer tenure is likely to obtain a higher remuneration package to compensate him for his company-specific human capital. Furthermore, his long experience may also make him more competitive on the managerial labour market (Murphy, 1986). A CEO with long tenure may be more entrenched and thus have more influence on his remuneration. This will be especially the case if he has a longer tenure than most of the non-executive directors on the board and if he serves on the compensation committee. We use CEO’s tenure and age to proxy for his overall experience (possibly acquired in several companies). Thus, we expect that older CEOs and CEOs with longer tenure receive higher pay.
Only rarely, women are leading listed companies: female top managers occupy only 3-5% of the (executive) board seats in listed US and UK firms. Apart from evidence of the existence of a glass ceiling, women managers also seem to be discriminated against in terms of salary. For instance, Bertrand and Hallock (2001) find that female top executives are earning 45% less than their male colleagues in large American companies. Kulich et al. (2011) confirm that only 3% of the executive board members are female in all listed UK firms and receive lower compensation than their male counterparts. In addition, compensation contracts of female managers are less performance-sensitive than those of male executives: female managers’ remuneration packages have less upward potential in case of good corporate
performance, but they lose less in case of poor performance. Therefore, we expect that the total compensation of female CEOS is lower than that of male CEOs, even under similar performance.
Although combining the functions of CEO and chairman of the board is discouraged in the UK Corporate Governance code, we still find many such cases though predominantly in small and medium-sized companies. We expect that the CEO who also assumes the tasks of chairman receives a higher remuneration to compensate him for the additional tasks but also because this CEO will be in a more powerful position vis-à-vis the other (non-executive) directors (Conyon and Peck, 1998). The conflicts of interest even augment when the CEO is also a member of the nomination committee which allows him to appoint friends as new board members or when he is a member of the remuneration
committee. We also control for the notice period included in the CEO’s employment contract, and we
expect that a longer notice period lowers the level of total compensation.
Board characteristics
Board composition has often been considered as one of the critical measures of corporate governance effectiveness. A high proportion of non-executive directors, separation of the roles of CEO
and chairman, and the creation of committees are expected to be important to turn the board into an
effective governance device. Core, Holthausen and Larcker (1999) confirm their hypothesis on the negative relation between CEO pay and board independence. More recent research on the US by Chhaochharia and Grinstein (2009) indicates that CEO compensation decreases in firms that comply with the new and stricter board structure regulations imposed on listed firms by the NYSE and NASDAQ in 2002-03. If a company has a larger percentage of non-executives on the board, we expect that CEO compensation can be restrained and that there is a stronger pay-for-performance sensitivity. Nonetheless, the effectiveness of the board has not always been satisfactory. For instance, Franks, Mayer and Renneboog (2001) find that non-executives seem to support the executive directors in the UK even in the wake of poor performance. If a company has a larger percentage of non-executives on the board, we expect that CEO compensation can be restrained and that there is a stronger pay-for-performance sensitivity.
Share stake concentration
A key aspect of corporate governance is the monitoring role exerted by major shareholders (Core et al., 1999). Executive directors owning shares in their firm have incentives that are more aligned with those of the other shareholders. Therefore, executive ownership may lead to more modest compensation packages. Less excessive compensation and a higher pay-for-performance sensitivity will arise in the presence of major share blocks held by non-executive directors (whose fiduciary obligations to monitor are now enhanced by stronger voting power) and by outside shareholders such as corporations,
and individuals and families whose voting power incentivises them to be active monitors. Given that the vast majority of institutional investors are rather passive monitors, we expect their presence to have little effect on CEO compensation.
Firm characteristics
Company size has been shown to explain most of the cross-sectional variation in total
managerial compensation (Murphy, 2000; Core et al., 1999). Larger companies pay their CEOs substantially more than medium-sized and small companies as it takes specific (and rare) managerial talent to lead large corporations, which also entails larger responsibilities. Therefore, we also expect that CEO compensation increases with firm size.
Including corporate performance-related incentives in the remuneration contracts is key in the classic principal-agent framework (Grossman and Hart, 1983). However, neither accounting nor stock market performance measures are perfect benchmarks. The former are backward looking and are liable to manipulation by the management in order to augment their bonus (Healy, 1985; Bergstresser and Philippon, 2006). Using stock prices as the yardstick has the advantage that one concentrates on (future) value creation, but can induce a myopic focus on the short term. Frequent overvaluation and undervaluation due to market sentiment may enable the management to take decisions that cater to this sentiment whilst aiming at maximizing their variable pay. We will include both accounting and stock performance measures in our models. Bertrand and Mullainathan (2001) and Renneboog and Trojanowski (2005) show that the benchmarks chosen in the remuneration contracts depend on the relative power of the management. Managers without principals prefer accounting benchmarks, and are frequently not remunerated for their intrinsic qualities but are paid for luck. In this study, we expect that the CEO’s total compensation, salary, bonus, and equity-based compensation are sensitive to the company’s performance, measured by both accounting and stock market performance.
It may take a CEO with specific human capital to manage a firm with a high level of riskiness. A risk-averse CEO may demand higher remuneration or a low pay-for-performance relation embedded in the contract to compensate him for managing a firm with more volatile cash flows or with a higher probability of financial distress.
3. Capturing Networks
3.1. The Network Definitions
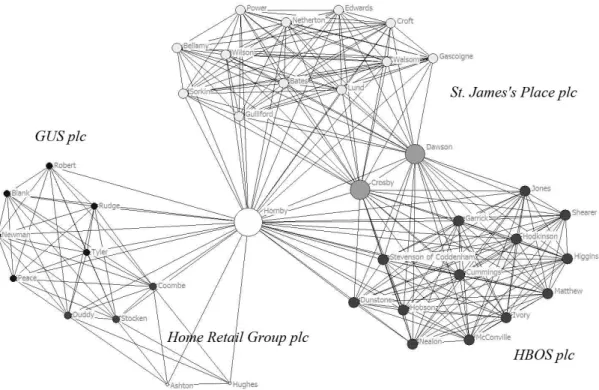
To quantify directors’ networks, we resort to several graph-theoretical measures. Figure 1 depicts the director network surrounding Andy Hornby, the CEO of HBOS plc, a banking and insurance company. Directors in HBOS plc are the dark grey circles at the right bottom corner. In 2006, Andy
Hornby was also a non-executive director in the life assurance and unit trust company St. James's Place plc, and in the retail companies GUS plc and Home Retail Group plc. This example is a fragment of a complete director network whereby a director is denoted by a vertex (or node). A connection between two vertices is called link (or edge, tie). The system of these vertices and links is a graph (or map). As links between two vertices are established when two directors are sitting on the same board, Andy Hornby’s four directorships create connections with 38 directors. Besides Andy Hornby, HBOS and St. James's Place share two more directors: Dawson and Crosby. Jo Dawson was an executive director in HBOS and a non-executive director in St. James's Place. James Crosby was the CEO in HBOS before Andy Hornby. Similarly, GUS and Home Retail Group shared three directors: Stocken, Coombe and Duddy. Oliver Stocken was a non-executive director in GUS and chairman of the board in Home Retail Group. John Coombe was a non-executive director in GUS and senior nonexecutive director in Home Retail Group. Terry was an executive director in GUS and the CEO in Home Retail Group. A sequence between two vertices, visiting no vertices more than once, is called a path. In the above graph, multiple paths exist between John Peace and Richard Ashton. For example: Peace – Duddy – Ashton, Peace – Stocken – Ashton, Peace - Coombe – Hughes – Ashton and etc. The length of a path is the number of links it comprises and a geodesic path is the shortest path between two vertices (which is not necessarily unique). In the above example, both Peace – Duddy – Ashton and Peace – Stocken – Ashton are geodesic paths between Peace and Ashton.
[Insert Figure 1 about here]
3.2 Measures of Centrality
In order to illustrate the calculation of various centrality measures, we construct a hypothetical network with six companies and ten directors. In Panel A and the figure of Appendix B, the numbers refer to firms and letters stand for directors. In order to compute the centrality measures, we record the network into a symmetric matrix, where 1 denotes a link between the two directors (Panel B). This matrix enables us to calculate the centrality measures (Panel D). The degree and eigenvector centrality measures focus on direct (local) connections in order to assess the managerial influence. Measures of indirect connections such as closeness and betweenness are used to capture the information collection ability.
The degree centrality of a vertex is calculated as the number of links held by that vertex. In the above example, the number of links – the degree centrality - for director a is 6. Panel A shows that director a is connected to 2 directors in company 3 and 4 directors in company 5. Note that since degree counts the connections between the CEO and the other board members in her company, this measure could be affected by factors influencing board size. However, as the board size in our sample does not differ much across firms, most of the variation in the degree measure is caused by the connections gained from external directorships.
Eigenvector centrality of vertex v (CE(v)) is equal to the sum of all adjacent vertices’ eigenvector centrality scores:
This calculation process begins with assigning score 1 to all the vertices. At each iteration, the score of vertex v is calculated as the sum of all adjacent vertices’ scores received in the previous iteration. In the above formula, matrix A is an n*n matrix with elements (v, j) and (j, v) equal to 1 if vertex j is adjacent to the target vertex v. Therefore, the centrality score for each vertex evolves after every iteration. The factor
λ
is to make sure that the centrality scores converge rather than explode after many iterations. The advantage of eigenvector centrality over other centrality measures is that it not only captures how many vertices are linked to the target vertex (as degree centrality does), but also includes the centrality of those adjacent vertices. Hence, a vertex will have a higher eigenvector centrality score if it is connected to more vertices with higher centrality scores.The farness of a vertex is defined as the sum of geodesic distances between this vertex and all other vertices that can be reached. We transform the matrix of Panel B into the geodesic distance matrix by replacing all the zeros by the geodesic distance (Panel C). According to this definition, a higher farness value indicates that the vertex is further from other vertices. In order to define closeness (and normalized closeness), we calculate the inverse of the sum of all geodesic paths from vertex v to any other vertex t:
∑
= ) , ( 1 ) ( t v d v C G cIn this formula, the closeness centrality of vertex v (Cc(v)) is equal to one divided by the sum
of the lengths of geodesic paths (dG) from v to any other vertex t. A high closeness value reflects the
shorter distance to all other vertices, which suggests that the target vertex is more central in the network. The normalized closeness is defined by the following formula where n is the number of vertices in the graph.
∑
− = ) , ( ) 1 ( 100 ) ( ' t v d n v C G cA higher normalized closeness score implies a shorter distance to other vertices, in which case the CEO is able to acquire the information faster. The closeness measure is defined over all the connected vertices in the graph (which entails that all isolated vertices do not have a closeness measure).
The betweenness of vertex v is defined as the sum of its betweenness ratios. A betweenness ratio is the number of geodesic paths from vertex s to vertex t passing through vertex v, divided by the number of geodesic paths from s to t. In the above example, no geodesic path needs to pass director c,
∑
==
N j E j v Ev
A
C
j
C
1 ,(
)
1
)
(
λ
therefore his betweenness score is zero. Geodesic paths between director c and all the other directors need to pass director b, which leads to the high betweenness score of director b. In formula form, this is:
∑
≠≠∈ ≠ = t s V t v s st st B v v Cσ
σ
( ) ) (where the denominator is the number of geodesic paths from vertex s to vertex t, the numerator is the number of geodesic paths from s to t with target vertex v on the geodesic paths. A high betweenness score of a CEO signifies that he has a ‘brokerage position’ between some otherwise separated groups. In the above example, director b would be the first person to know any information generated by director c. Such advantageous position is reflected in a high betweenness score.
One may argue that direct connections bring in information as well. This is true but direct centrality measures may be inferior to indirect ones in terms of quantifying information collection efficiency. For instance, directors with numerous direct connections in an isolated corner of the whole network can hardly receive information as quickly as directors in the centre of the network (even with fewer direct connections). Moreover, as suggested by Granovetter (1973), information from direct connections is likely to be of lower quality than that from distant connections, because directly connected individuals tend to have redundant (similar) information sources. Therefore, the indirect centrality measures are better proxies of the information collection efficiency of a CEO’s network. Panel D in Appendix B presents the different centrality measures for the directors in the above example.
To calculate network centrality at the company level, each company is considered as a vertex in the graph and two companies are linked if they share at least one common director. Once the graph of the company level network is drawn, the centrality calculation proceeds similarly to that at the director level. More specifically, the degree centrality of a company is the number of other companies it connects to through director interlocks. The closeness of a company measures how close it is to all the other reachable companies.
3.3 Sample Description: Director Networks
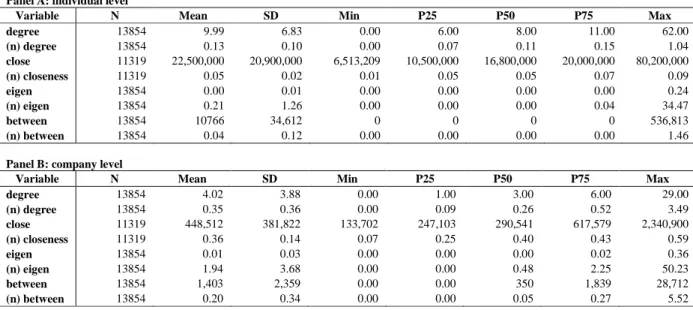
The degree measure for an average UK CEO is 10 with the median value of 8 (Panel A, Table 1). When we turn to the centrality scores of Andy Hornby, who has been the central director in the example shown in section 3.1, we find that he is much better connected than the average CEO in terms of direct links (38 direct links). It is safe to argue that the CEOs such as Andy Hornby with a large number of connections in adjacent companies have more managerial power on the board. However, a strong network based on direct links does not necessarily imply a strong position in the information collection networks. The normalized closeness measure for Andy Hornby is 0.05, which is slightly lower than the average and median level among the UK CEOs (0.054 and 0.052 respectively). Hence in this example,
although Andy Hornby is very active in networking, his network does not grant him better information collection ability.
Over time, the level of connectedness decreases, possibly due to more strict regulation3 on the maximum number of directorships the CEO can hold. Table 1 also exhibits that the CEOs of the largest corporations are significantly better connected than those leading FT Small Caps or FT fledglings.
[Insert Table 1 about here]
We now turn to networks on the company level: the average company has 4 interlocks with a median of 3 (Panel B, Table 1). All centrality measures indicate that the connectedness of British companies increased slightly at the beginning of our sample period (1996-1999), then remained stable until 2004 when a slight decline in the degree of connectedness commences. When we partition the sample companies according to size as reflected by index membership (FTSE 100, FTSE 250, FTSE Small Cap, and FTSE Fledging), we observe that larger firms have more direct links (degree) and are more closely related to other companies. The eigenvector centrality measure shows that FTSE 100 companies are in more important network positions than FTSE 250 firms, Small Caps and Fledglings. Lastly, the betweenness measures indicate that larger firms are more likely to be on any geodesic path in the graph, which implies that they are occupying the important network junctions.
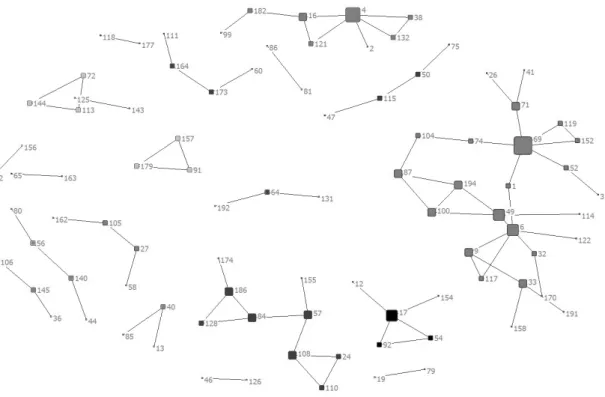
The network differences between sectors are remarkable. On average, companies from the financial, IT, and medical sectors are more connected than the other sectors. However, networks have different structural features. In the financial sector, most companies are connected with each other within a large component (including 75 companies), and only a few smaller isolated coalitions exist (See Figure 2a). In the IT industry (Figure 2b), companies are likely to be linked to other companies in their sector, but the networks are clustered in medium-sized components. Although the size of the subsample of IT firms is similar to that of the financial sector, the size of the largest component in the IT sector is only one third of that in financial sector. Moreover, the network density and the average and the extreme values of centrality measures in the IT sector are very different from those in the financial sector.
[Insert Figures 2a and 2b about here]
In the context of managerial compensation policies, it is also interesting to study whether firms are connected by employing the same remuneration consultant. Those connections may imply that information on remuneration policies in other firms are more easily dissipated through the remuneration consultants’ networks of clients. Over the period 1996-2007, 145 to 198 remuneration consultants were
3 The Higgs report (2003) requires that “the board should not agree to a full time executive director taking on more
than one non-executive directorship in a FTSE 100 company nor the chairmanship of such a company.” However, there are no direct limitations on the maximum number of directorships one can have.
active and we observe an increasing trend in the hiring of remuneration consultants. On average, a company is connected with more than 40 other companies through common remuneration advisors.
4. Data and Methodology
4.1 Estimation Methods
As our estimation method, we prefer random effects GLS regressions over fixed effects models because our panel data include a large cross-section (with more than a thousand companies a year). In addition, the random effects model has higher estimation efficiency and is a weighted average of between and within estimators. Lastly, the fixed effects model cannot estimate time-invariant variables, such as gender and position, which are important in our analysis. In virtually all model specifications, the explanatory variables are not correlated with the individual effects, as demonstrated by the Hausman test.
We run the following two sets of regressions on: a. the level of the CEO’s total compensation CEO total compensation it = α + β1 × Performance measures it
+ β2 × Network measures it + β3 × CEO characteristics it
+ β4 × Corporate governance measures it
+ β5 × Ownership concentrationit + β6 × Firm characteristics it +
∑
∑
= = 2007 1996 12 1 t j γj, t × Industry j × Time tThe network measure included is based on the director network function we intend to test (managerial influence versus information collection). We extend the analysis by replacing the above dependent variable by the compensation sub-categories such as salary, fees, bonus and equity-based compensation. The performance measures consist of accounting performance (return on assets) and a stock performance measure (market-adjusted return). CEO characteristics include the CEO’s gender, tenure, age, membership in committees (audit, nomination and remuneration), and the combination of the positions of CEO and chairman of the board. Board structure variables are important internal corporate
governance controls. Ownership concentration consists of the percentage of block holdings by category
of shareholder. We categorize all the share stakes held by directors and all the blocks of 3% or more into the various shareholder categories that are discussed in Section 4.5. Lastly, we include some firm characteristics such as size, capital structure, and stock price volatility. All regressions also include industry and time dummy variables.
b. The pay-for-performance sensitivity of CEO compensation Change in CEO compensation it = α + β1 × Performance measure it
+ β2 × Network measure it
+ β3 × Network measure it × Performance measure it
+ β4 × CEO characteristics it
+ β5 × Corporate governance variables it
+ β6 × Ownership concentration it + β7 × Firm characteristics it +
∑
∑
= = 2007 1996 12 1 t j γj, t × Industry j × Time tIn the above pay-for-performance sensitivity regression, the change in total compensation or subcategory of compensation is the dependent variable.
An analysis of remuneration contracting should also be related to the examination of CEO departure and dismissal because disregarding the CEO turnover decision may cause sample selection problems in the remuneration analysis (Renneboog and Trojanowski, 2010). When the analysis of changes in compensation only includes ‘surviving’ CEOs, the sample distribution is restricted which may lead to estimation biases. In order to study the compensation and turnover decisions simultaneously, we also apply the following Heckman sample selection method (a type-2 Tobit model).
+ Χ = + Χ = it it it it it it on Compensati Survival 2 2 ' 2 * 1 2 ' 1 *
ε
β
ε
β
1) 2) ≤ > = 0 if 0 0 if 1 _ * * it it it Survival Survival stayed CEO ≤ > = 0 if observed not 0 if _ * * * it it it it Survival Survival on Compensati on compensati Observedwhere
{
ε
1it ,ε
2it}
are drawn from a bivariate normal distribution with mean 0, variances2 1
σ
and
σ
22, and covarianceσ
12 (Amemiya, 1984).β
1 andβ
2 are vectors of the model coefficients. Inour models, i corresponds to a firm and t to a year. Turnoverit* and
*
it
on
latent variables that are not observable. However, the sign of the Turnoverit* variable can be observed
and coded as a binary variable CEO_stayedit: if a CEO loses his or her job (i.e., Survivalit* ≤0) it is
coded as 0, otherwise it is coded as 1. Obviously, compensation is only observed for CEOs who are not dismissed. Χ1it and Χ2it are the sets of explanatory variables explaining CEO turnover and compensation, respectively. They include the measures enumerated above. The two sets of explanatory variables, i.e., X1it and X2it, are not disjoint (they can differ, however).
Throughout the paper, we call Equation (1) the selection equation, while Equation (2) is the
regression equation. The selection equation explains CEO turnover, i.e., CEO_stayedit =1
corresponds to those firm-years when the CEO keeps his or her position. The regression equation explains the compensation of these CEOs in the subsequent year. As the notion of compensation sensitivity to performance is not meaningful for new CEOs, we restrict the remuneration analysis to CEOs with tenure of more than one year. Estimating the parameters of Equation (2) on the basis of the non-turnover sample only, would not be a valid alternative to the proposed method because the OLS estimator of
β
2 is biased when the selection of the regression sample is endogenous (i.e.,σ
12 ≠0).4.2 Sample Selection and Data Sources
The dataset comprises information on 1,758 companies4 for which we have 9,789 firm-years
with CEOs, 13,854 firm-years with CEOs and CEO-equivalents5 and 121,825 firm-years with all directors. All sample companies are listed on the London Stock Exchange (LSE). Virtually all companies belong to one of these indices: FTSE 100, FTSE 250, FTSE Small Cap, FTSE Fledgling, and FTSE AIM.
6
The FTSE 350 comprises both the FTSE 100 (the 100 biggest companies that represent about 81% of the market capitalization) and the FTSE 250 (the next 250 largest companies with about 15% of the UK market). FTSE Small Cap includes companies that are relatively small, and cover about 2% of the total LSE market value. We have info on virtually the complete UK market. This fact is important in the context of network research as limiting the sample size to e.g. FTSE 350 only would give a distorted picture of the networks existing in UK listed firms.
We collect the remuneration data as well as detailed board information from BoardEx, Manifest, and annual reports. Other company-specific data including sector categorization, accounting information (profit measures, capital structure, and firm size), stock performance and volatility are
4 Note that in some regressions, we only include 1,216 firms because indirect centrality measures cannot be
calculated for isolated firms.
5 Details about identifying CEO equivalents can be found in Appendix B.
6 FTSE All-Share can be seen as the aggregation of the FTSE 100, FTSE 250 and FTSE Small Cap Indices. It
gathered from Datastream Advance. Ownership data is provided by Thomson Financial and PricewaterhouseCoopers. Our dataset starts in 1996 (after the release of the Greenbury Report on Managerial Compensation in 1995) and ends in 2007.
In case the length of the financial year deviates from 365/366 days (it is then more than 30 days longer or shorter than 365), the remuneration and accounting information are adjusted accordingly to make sure they are comparable to other annual values. When a financial year is not coinciding with the calendar year, we apply this rule: e.g. we regard a financial year ending between January and June 31st 2005 as the year 2004 whereas we consider a financial year ending between 1st July and 31st of December 2005 as the year 2005.
4.3 Remuneration Data
The total remuneration package of a director can be dissected into these sub-categories: (i) salary, (ii) fee, (iii) bonus, (iii) equity-based compensation (stock options and long term incentive plans), (v) miscellaneous remuneration, and (vi) other. The salary includes a fixed payment and is usually paid out in cash (and exceptionally in shares). Fees are usually paid for consulting and supervisory services rather than for operational work and are hence more often compensation for non-executive directors or former executive directors. The bonus can consist of cash or shares and is usually paid when specific benchmarks or targets were reached over the past year (or past few years). Bonuses can also be voluntarily deferred or are compulsorily deferred for a vesting period of usually three years. In practice, the initial cash deferral bonus is often converted into stock at favourable terms if the CEO commits to remain in his company or meets some performance criteria over the vesting period. A deferred bonus realized in stock is recorded as restricted stock and categorized as equity-based compensation.7
Equity-based compensation includes restricted shares and stock options. Restricted shares are granted under different schemes such as shares appreciation rights and deferred bonus schemes. In most circumstances, the restricted shares cannot be sold until certain goals are reached and before the vesting period. Restricted shares are valued at the market price of the grant date. The market price at grant date was collected from Datastream Advance. Stock options give the CEOs the right to acquire company stocks at a predetermined price (exercise price). Stock options in the executive remuneration packages in the UK have often vesting conditions (performance benchmarks) and always vesting periods, typically three to five years. We approximate the value of the stock options by means of the Black-Scholes option pricing formula. Most options are granted at the money; the market price and stock price volatility at the grant date are collected from Datastream Advance. As we lack information about the time to maturity of
7 We include the deferred bonus plans in cash terms at the grant date. All performance related sub-categories are
stock options, we use ten years (the usual time to expiration at the grant date) as the default maturity for all stock option value calculations. The interest rate of 10-year UK government bonds (Gilts) is used as the risk-free rate.
Miscellaneous compensation includes compensation that is not paid out on a regular basis, and includes transaction bonuses, recruitment incentives, relocation expenses, and loss of office compensation. A transaction bonus is granted when the CEO has administered major corporate transactions, such as takeovers, or other types of asset restructuring. A deferred cash bonus (different from the deferred bonus defined above) is granted mainly with the aim of retaining the CEO. For instance, the CEO needs to remain employed for the vesting period (typically 3-5 years) in order to claim this cash award (which is not performance-related). The recruitment incentive is paid when a position is difficult to fill without such an additional allurement and is associated only with new appointments.
Relocation expenses are awarded in case the newly-appointed CEO needs to move nearer to his new firm.
The loss of office compensation is also known as severance pay (or a golden parachute). When the contract is terminated before it expires, the CEO is compensated for this early departure. The payment of the severance pay is often not contractually specified and is granted even when the CEO is fired following poor performance. Our dataset also contains a remuneration category labelled ‘Other’, which is rare and includes all forms of compensation and benefits that are not included in any of the above categories. It consists of the CEO’s (medical) insurance paid for by the firm, some ‘ad hoc benefits’ or ‘unusual compensation’ about which the firms do not give detailed information. We also have information about pension contributions done by the company for the benefit of executive directors. Given that this information is not complete, we do not include its value in the CEO’s compensation.
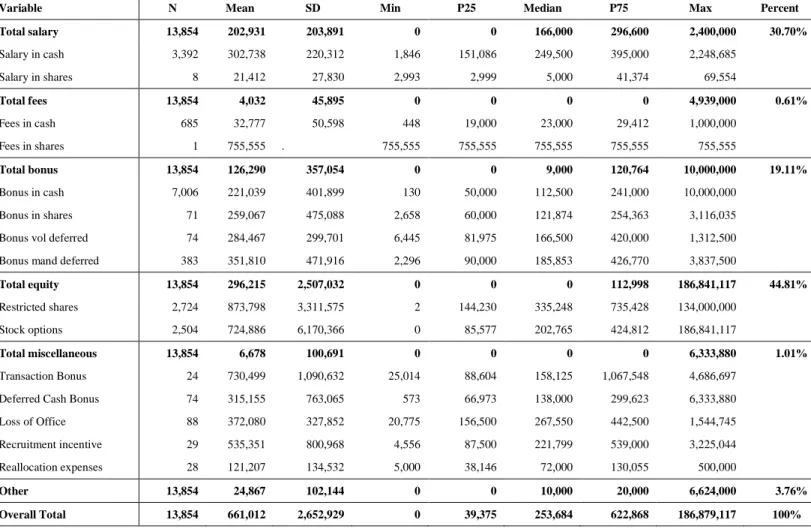
Table 2 reports descriptive statistics on remuneration for the whole sample period. The most important components of a CEO’s compensation package in the UK are equity-based compensation (restricted shares and stock options), fixed salary, and bonus. On average, ₤ 296,215 is paid to a CEO each year as equity-based compensation, which accounts for 44.8% of his total remuneration. The salary on average amounts to ₤ 202,931 or 30.70% of the total remuneration. The bonus is also a significant source for a CEO’s wealth accumulation with an average of ₤ 126,290 or 19.11% of the total compensation. The remaining compensation components such as fees, miscellaneous compensation and other are only marginal and add up to a mere 5% of CEO compensation.
[Insert Table 2 about here]
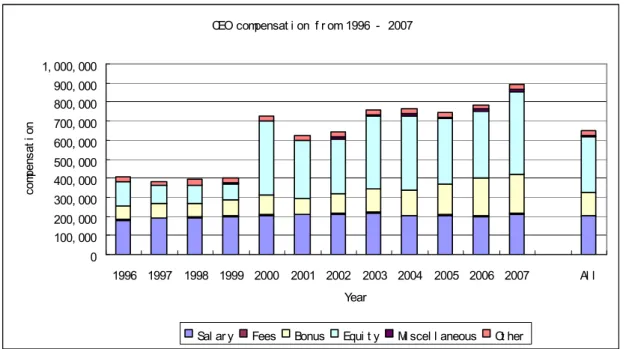
How did the value of compensation packages evolve? Figure 3 shows a strong increase in the total remuneration which peaked in the year 2000 (following the strong stock market boom of the 1990s), was followed by a short-lived decrease in 2001-2002 (coinciding with the equity market decline and the collapse of the M&A market) and then kept rising till 2007. By 2007, the total remuneration for the CEO
had almost doubled relative to 1996. Over the entire sample period, the total remuneration increased at an average rate of 9.43% per annum. There are only modest increases in the fixed salary over time, but the augmentation of the bonus and equity-based compensation are striking. Particularly in 2000, when the stock market peaked before the bursting of the high tech bubble, the equity-based compensation also became the most valuable aspect of a compensation package (amounting to 53.04% of the total remuneration). Moreover, if we look across the industries, the distribution of CEO compensation is highly skewed: a small number of well paid CEOs (mostly from FTSE 350) have driven up the average CEO compensation in the UK market. Lastly, equity-based compensation is still a smaller part of total remuneration of UK CEOs than that of US CEOs. In 2007, CEOs of S&P 500 companies were on average
paid a total compensation of USD 13.4 million whereas UK CEOs of FTSE 100 companies received ₤ 4.3
million (USD 8.6 million).
[Insert Figure 3]
We find that the companies in the industries of Financial Services, Food Producing, Media, and Utilities reward their CEOs the most. The highest paid CEO in 2007 was Bart Becht from the Reckitt
Benckiser Group with a compensation of ₤ 31 million, followed by Terence Leahy from Tesco’s earning
₤ 21 million. For each of these CEOs (and most other top earners), more than 80% of their remuneration
packages consist of equity-based compensation.
Partitioning the sample firms based on membership of the FTSE 100, FTSE 250, FTSE Small Cap and FTSE Fledgling, we find that the CEO remuneration of the largest firms (FTSE 100) is about 10, 5 and 2.5 times larger than that of the Fledglings, Small Caps and FTSE 250 firms, respectively. The growth in nominal salaries for the CEOs leading Fledglings is 9.84% per annum. The growth is stronger at about 19.5% annually for small caps and FTSE 250 firms, and 15.3% for the largest firms (FTSE 100). The structure of the compensation packages in large companies is markedly different from that of smaller firms. The bonus, restricted shares, and stock options make up a larger proportion (up to 70%) of the total executive directors’ compensation of the largest companies (FTSE 350). In the FTSE Small Cap and FTSE Fledgling companies, the proportion of the performance-related compensation is less than 60% and 40%, respectively.
4.4 CEO, Board, and Firm Characteristics
The CEOs’ average age is about 53 years. While this average age remains relatively stable over time, the average tenure declines from 8.7 years in 1996 to 4.9 years in 2007. Executive directors are somewhat younger than the nonexecutive directors; they are 50 and 58 years, respectively. The age and trend in tenure also persist in firms of different sizes and sectors - only the CEOs in the largest companies
have a shorter tenure. The vast majority of the CEOs is still male, although the proportion of female CEOs has slightly increased over time (from 0.8% in 1996 to 2.6% in 2007).
[Insert Table 3 about here]
Across our sample period, CEO turnover amounts to 23.75% which includes 1.1% turnover resulting from the decease of CEOs and 12.25% from retirements.8 We also collect information on the CEOs’ contracts such as the notice periods. More than three quarters of the companies (77%) are required to inform the CEO twelve months prior to the dismissal. For about 12%, the notice period is longer than 20 months.
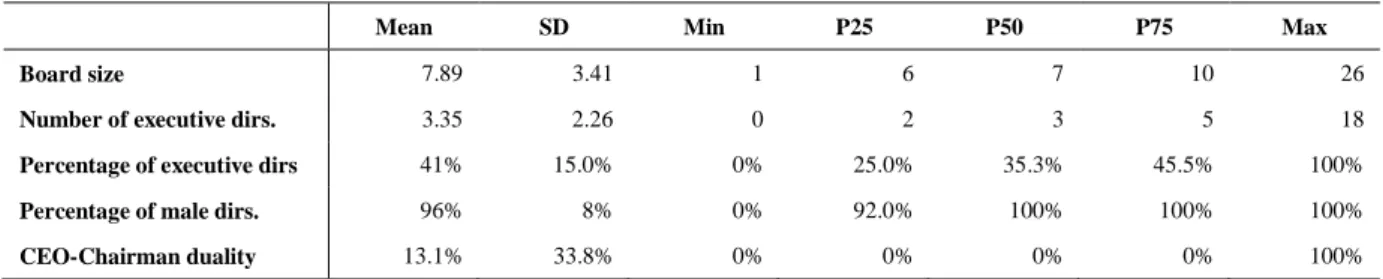
On average, the board consists of 8 directors of which 5 are non-executives (Table 4, Panel A). Merely 4% of the board members are female. In 13.1% of the firm-years, the CEO also chairs the board of directors. This high number is surprising given that board duality can harm the board’s supervisory power and that the UK Corporate Governance Code discourages board duality. There is however a significant decline in board duality over time: in 1996, 21.0% of the CEOs had also assumed the tasks of chairman but this number dropped to 7.0% by 2007.
[Insert Table 4 about here]
The UK Corporate Governance Code also requires that a firm has audit, nomination, and remuneration committees. In the context of the functioning and independence of these committees, it is important to note that these committees should be staffed mainly by non-executive directors. Most companies, with the exception of a fraction of the very small firms, comply with the UK code and have audit (98%) and remuneration committees (88%). In more than 80% of all firm-years, there is a nomination committee (Table 4, Panel B). Panel C demonstrates that at least one executive director participates in the decision making of the nomination committee in more than half (53.5%) of the firm-years. The presence of executive directors on the remuneration committee is also remarkable. Conditional on the presence of a remuneration committee, at least one executive director is a member of the committee in one out of five firm-years. In Panel D, we examine the extent to which CEOs are present in the committees. Nomination committees have often been criticized for not being sufficiently independent from the CEO as he could influence the appointments of non-executive directors who are unlikely to oppose his views and to monitor the executive directors actively. In about 44% of the firm-years, the CEO is a member of the nomination committee which he chairs in 11.5% of the cases. CEO membership of the remuneration committee creates obvious conflicts of interest, and Panel D
8 The retirement turnover comprises the departure of CEOs who are 63 years old or above. Given that the true
reason behind the turnover is not available – most firms use euphemistic terms to describe the CEO’s departure - we do not distinguish between voluntary turnover and disciplinary turnover for the non-retirement cases.
exhibits that the CEO is a member of the remuneration committee in 10% of the firm-years and even chairs this committee in 2% of the cases. CEOs’ committee membership linearly decreases with company size, but the CEO is still a member of the remuneration committee in about 2.5% of the firm-years in FTSE 100 firms and in 7% of FTSE 250 firms.
Remuneration committees frequently hire remuneration consultants (42% of all companies in 2007) and report who their main consultant is in the annual report. The most frequently hired remuneration consultant is New Bridge Street Consultants (hired by 15.3% of the firms), followed by Towers Perrin (5.8%), and Deloitte and Touche (4.9%). Of the listed companies, 22.8% report that they only use internal advice to set managerial pay.
4.5 Insider and Outsider Ownership Concentration
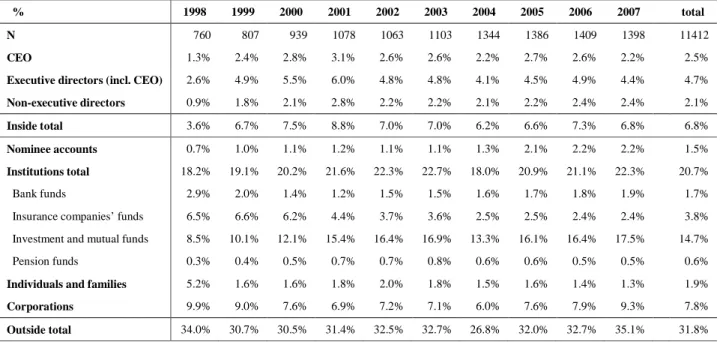
We categorize all the share stakes held by directors and all the blocks of 3% or more into the following shareholder categories: (i) investment and mutual funds, (ii) insurance companies, (iii) pension funds, (iv) banks, (v) nominees accounts, (vi) individuals and families not related to a director, (vii) industrial and commercial companies, (viii) CEO, (ix) executive directors (excluding the CEO)s and (x) non-executive directors. Categories (i) to (iv) constitute the institutional investors9, and classes (viii) to (x) make up the insider ownership. Table 5 exhibits that the ownership concentration is rather stable over time and fluctuates around 35%. Insider ownership amounts to about 7% over the whole sample period. Relative to other countries (the US and Continental Europe) where executive directors rarely hold a combined share stake of more than 0.5% in listed companies, executive ownership in the UK is high with an average of almost 4.7% of the equity that gives the insiders significant voting power. The average CEO holds 2.5% of the market capitalization. From 1998 to 2001, an upward trend in insider ownership concentration is visible, partly caused by an increase in the use of equity-based compensation for the top management. In the subsequent period, the combined insider stakes stabilize around 6.8%. The shareholder category with the highest ownership concentration is the investment funds which on average hold almost 14.7% of the equity. The investment funds’ share stake has increased gradually over the sample period from 8.5% in 1999 to 17.5% in 2007. The ownership concentration held by banks and pension funds has remained relatively stable over time. All the institutional shareholder classes combined control around 20.7% of the concentrated voting rights. The combined equity stakes of industrial and commercial corporations amounts to almost 8%.
[Insert Table 5 about here]
9 The owners behind the nominee accounts are often also institutional investors (Franks, Mayer and Renneboog,
5. Results
5.1 Compensation and Director Network Centrality
Total compensation and its components
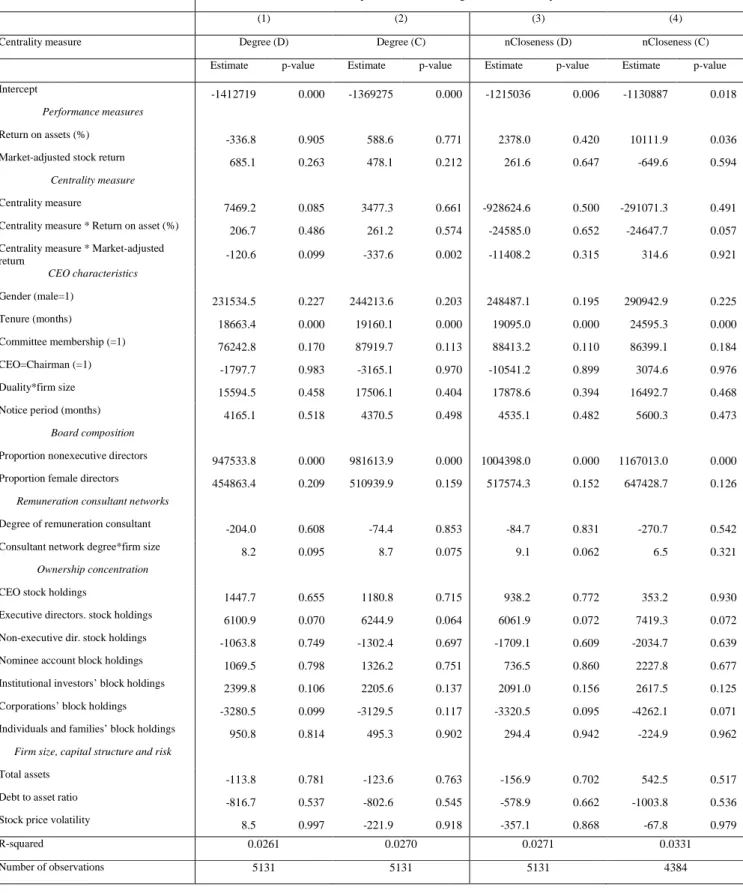
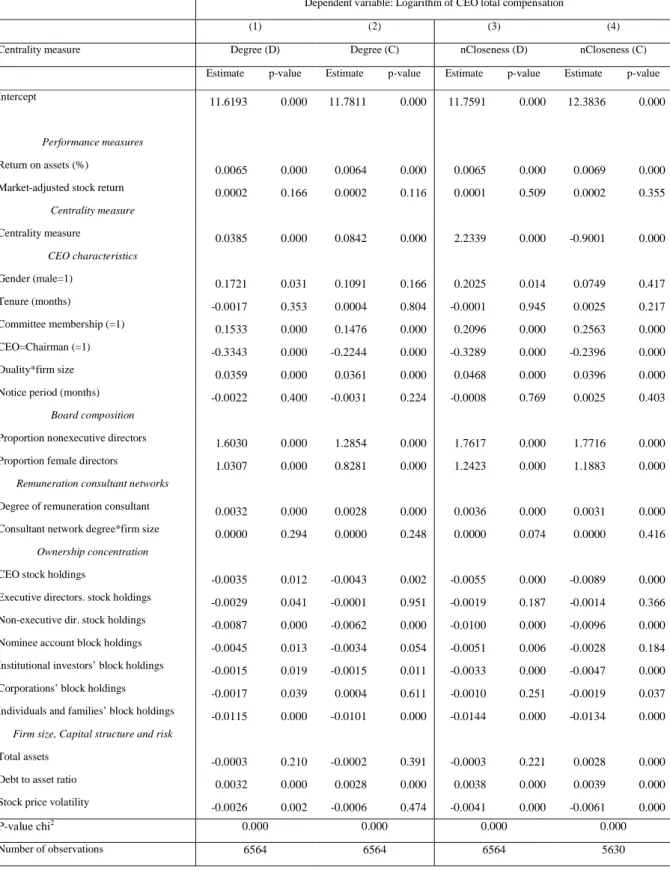
In Table 6, we estimate the impact of director networks on the CEOs’ total annual compensation. The degree centrality at the individual director (CEO) level (Degree (D)) is positively correlated with the CEO’s total compensation. This implies that CEOs with a strong network based on direct connections have higher compensation. When we replace degree by a second measure of direct networks at the director level, namely by the eigenvector centrality of the network, we reach similar results (not shown).
We also investigate the relation between networks based on indirect connections (the closeness level) which proxies for the information-value of the network, and CEO remuneration. Normalized closeness (nCloseness (D)) indeed significantly boosts CEO compensation. This implies that a CEO’s network resources are valuable to and rewarded by the company. The correlation between direct and indirect centrality measures such as degree and normalized closeness is very small (0.18). When we include both measures in one model, both remain strongly statistically significant. This evidence suggests that both the managerial influence hypothesis (Hypothesis 1 - influential CEOs extract higher compensation) and the information-value hypothesis (Hypothesis 2 -CEOs with valuable information networks extract higher compensation) are upheld. We find that the direct links explain twice as much of the variation in the total CEO remuneration than do the indirect links, which implies that managerial influence hypothesis is more strongly supported.
[Insert Table 6 about here]
We now turn to the centrality measures at the company level. The degree of a company shows how many boards are interlocked with its own board. Company degree (Degree (C), column (2) of Table 6) has a significantly positive impact on the CEO’s total compensation. A high degree at the company level signifies that the board members are active in many other companies as executive or non-executive directors, which implies that these directors divert some of their time and energy. The probability of collusion may also increase with the number of board interlocks. When a board is more interlocked, corporate governance may become less effective, and as a possible consequence, the CEO may be able to extract higher compensation. So, our findings fail to reject hypothesis 3 (busy boards/managerial